0600
Multi-site Concordance of DWI Metrics: Results of the NCI Quantitative Imaging Network ADC Mapping Collaborative Project1Radiology and Biomedical Imaging, University of California, San Francisco, CA, United States, 2Radiology, University of Michigan Health System, Ann Arbor, MI, United States, 3Translational Bioimaging Group, Barrow Neurological Institute, Phoenix, AZ, United States, 4Brigham and Womens Hospital, Boston, MA, United States, 5Radiology and Radiological Science, Johns Hopkins University, Baltimore, MD, United States, 6Translational and Molecular Imaging Institute, Icahn School of Medicine at Mount Sinai, New York, NY, United States, 7Radiology and Biophysics, Medical College of Wisconsin, Milwaukee, WI, United States, 8Martinos Center, Massachusetts General Hospital, Boston, MA, United States, 9Oregon Health & Science University, Portland, OR, United States, 10Radiation Oncology, Radiology, and Biomedical Engineering, University of Michigan, Ann Arbor, MI, United States, 11Radiation Oncology, University of Michigan, Ann Arbor, MI, United States, 12Radiology, Neurology & RadOnc, University of Washington, Seattle, WA, United States, 13University of Texas, Austin, TX, United States, 14Institute of Imaging Science, Vanderbilt University Medical Center, Nashville, TN, United States, 15Applied Physics Division, National Institute of Standards and Technology, Boulder, CO, United States, 16Medical Physics and Radiology, Memorial Sloan-Kettering Cancer Center, New York, NY, United States
Synopsis
Reproducibility of diffusion metrics is essential given the increasing role quantitative diffusion weighted imaging plays in diagnosis and treatment monitoring. Here we examined the variability in apparent diffusion coefficient (ADC) measures resulting from different post-processing software implementations utilized by researchers across the NCI Quantitative Imaging Network. Agreement between the majority of implementations was good; typical biases for in vivo ADC measures of 2-3%, and lower biases in phantom scans. Higher deviations (above 5%) detected among individual implementations and scanner-generated parametric maps highlighted inadequacies in meta-data and post-processing parameters that need to be addressed in multi-site study settings.
PURPOSE
Quantitative diffusion weighted MRI (DWI) is playing an increasing role in diagnosis and treatment monitoring of cancer. For validation and reproduction of results and meta-analyses in multi-center studies, it is essential that different implementations produce consistent results. The purpose of this study was to evaluate the feasibility of centralized analysis and the reproducibility of quantitative DWI parametric maps from software platforms employed by institutions in the NCI Quantitative Imaging Network (QIN) for phantom and in vivo DWI acquisitions.METHODS
Analysis metrics and protocols for the phantom (Ph4b) and in vivo (Br2b, Br4b) DWI are described in Figure 1. Original DICOM images for the in vivo studies1 were deidentified, preserving private attributes necessary for DWI processing, and shared via TCIA2. Images of the polyvinylpyrrolidone (PVP) diffusion phantom3 were shared by the DWI task force of QIBA RSNA through the NCIPHub4. Each protocol included scans from three MRI scanner manufacturers: Siemens, Philips and GE Medical Systems (GEMS).
12 DWI analysis platforms from 11 QIN sites, using IDL, Matlab, 3D Slicer, OsiriX, AFNI, C++ and QIBAPhan1.3 implementations, were included in the study. B-values were provided for manual entry where necessary. Parametric maps were sent for centralized analysis. File formats included DICOM, NIFTI, NRRD and Matlab. Manufacturers' software (scanner-generated) ADC maps were also evaluated.
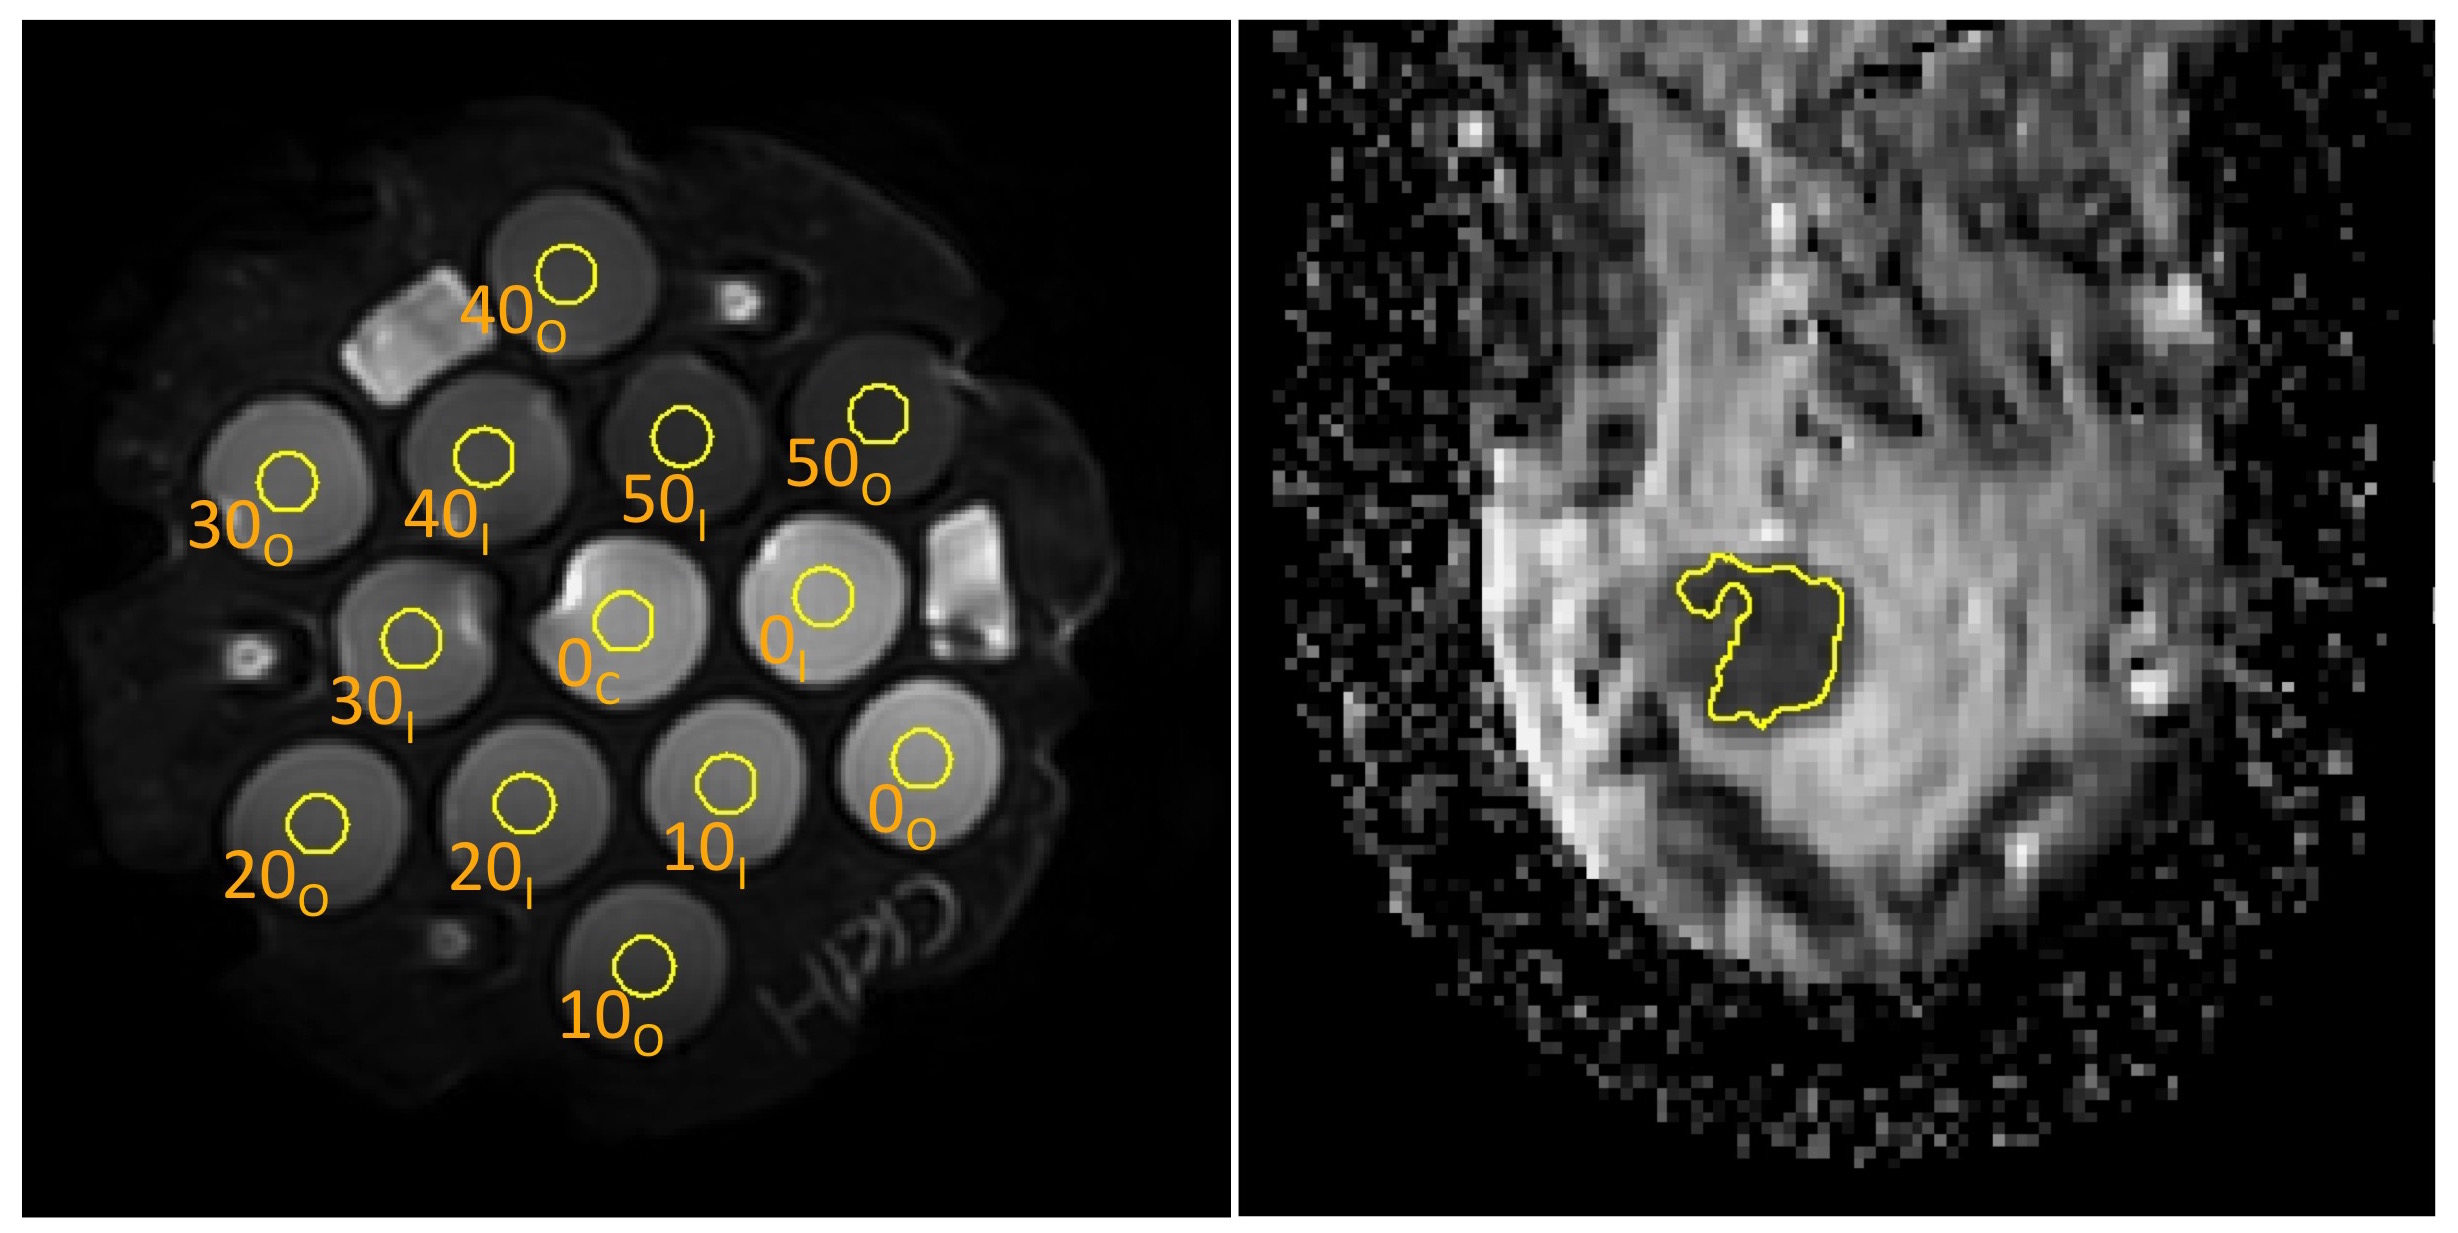
Maps were converted to a modified-DICOM format and scaling factors were set in the meta-data to produce ADC maps in common units of 10-6 mm2/sec. ROIs were defined as shown in Figure 2: thirteen middle-slice 1cm circular regions for each phantom study, and a single, multi-slice, whole-tumor region for each breast scan. ROIs were applied to the parametric maps yielding mean values of the diffusion metrics. Concordance was evaluated from the percent difference of each measurement from the median value for all QIN sites. Pairwise within-subject coefficient of variation (wCV) was calculated for all site pairs and metrics to establish groupings of similar (wCV<0.1%) results.
RESULTS
Practicalities: All 12 platforms provided mono-exponential ADC maps for the Br2b and Br4b groups, and perfusion-suppressed ADC3slow values for Br4b. 8 platforms provided perfusion-fraction maps for Br4b. All sites were able to handle all multi-vendor DICOM image sets, but interpretation of the full directional data from the GEMS scanners (Br4b, IDs 203, 204) was challenging for several sites due to unfamiliarity with this format. All maps were centrally analyzable, but required a variety of manipulations including scaling, slice order reversal, and masking of NaN values.
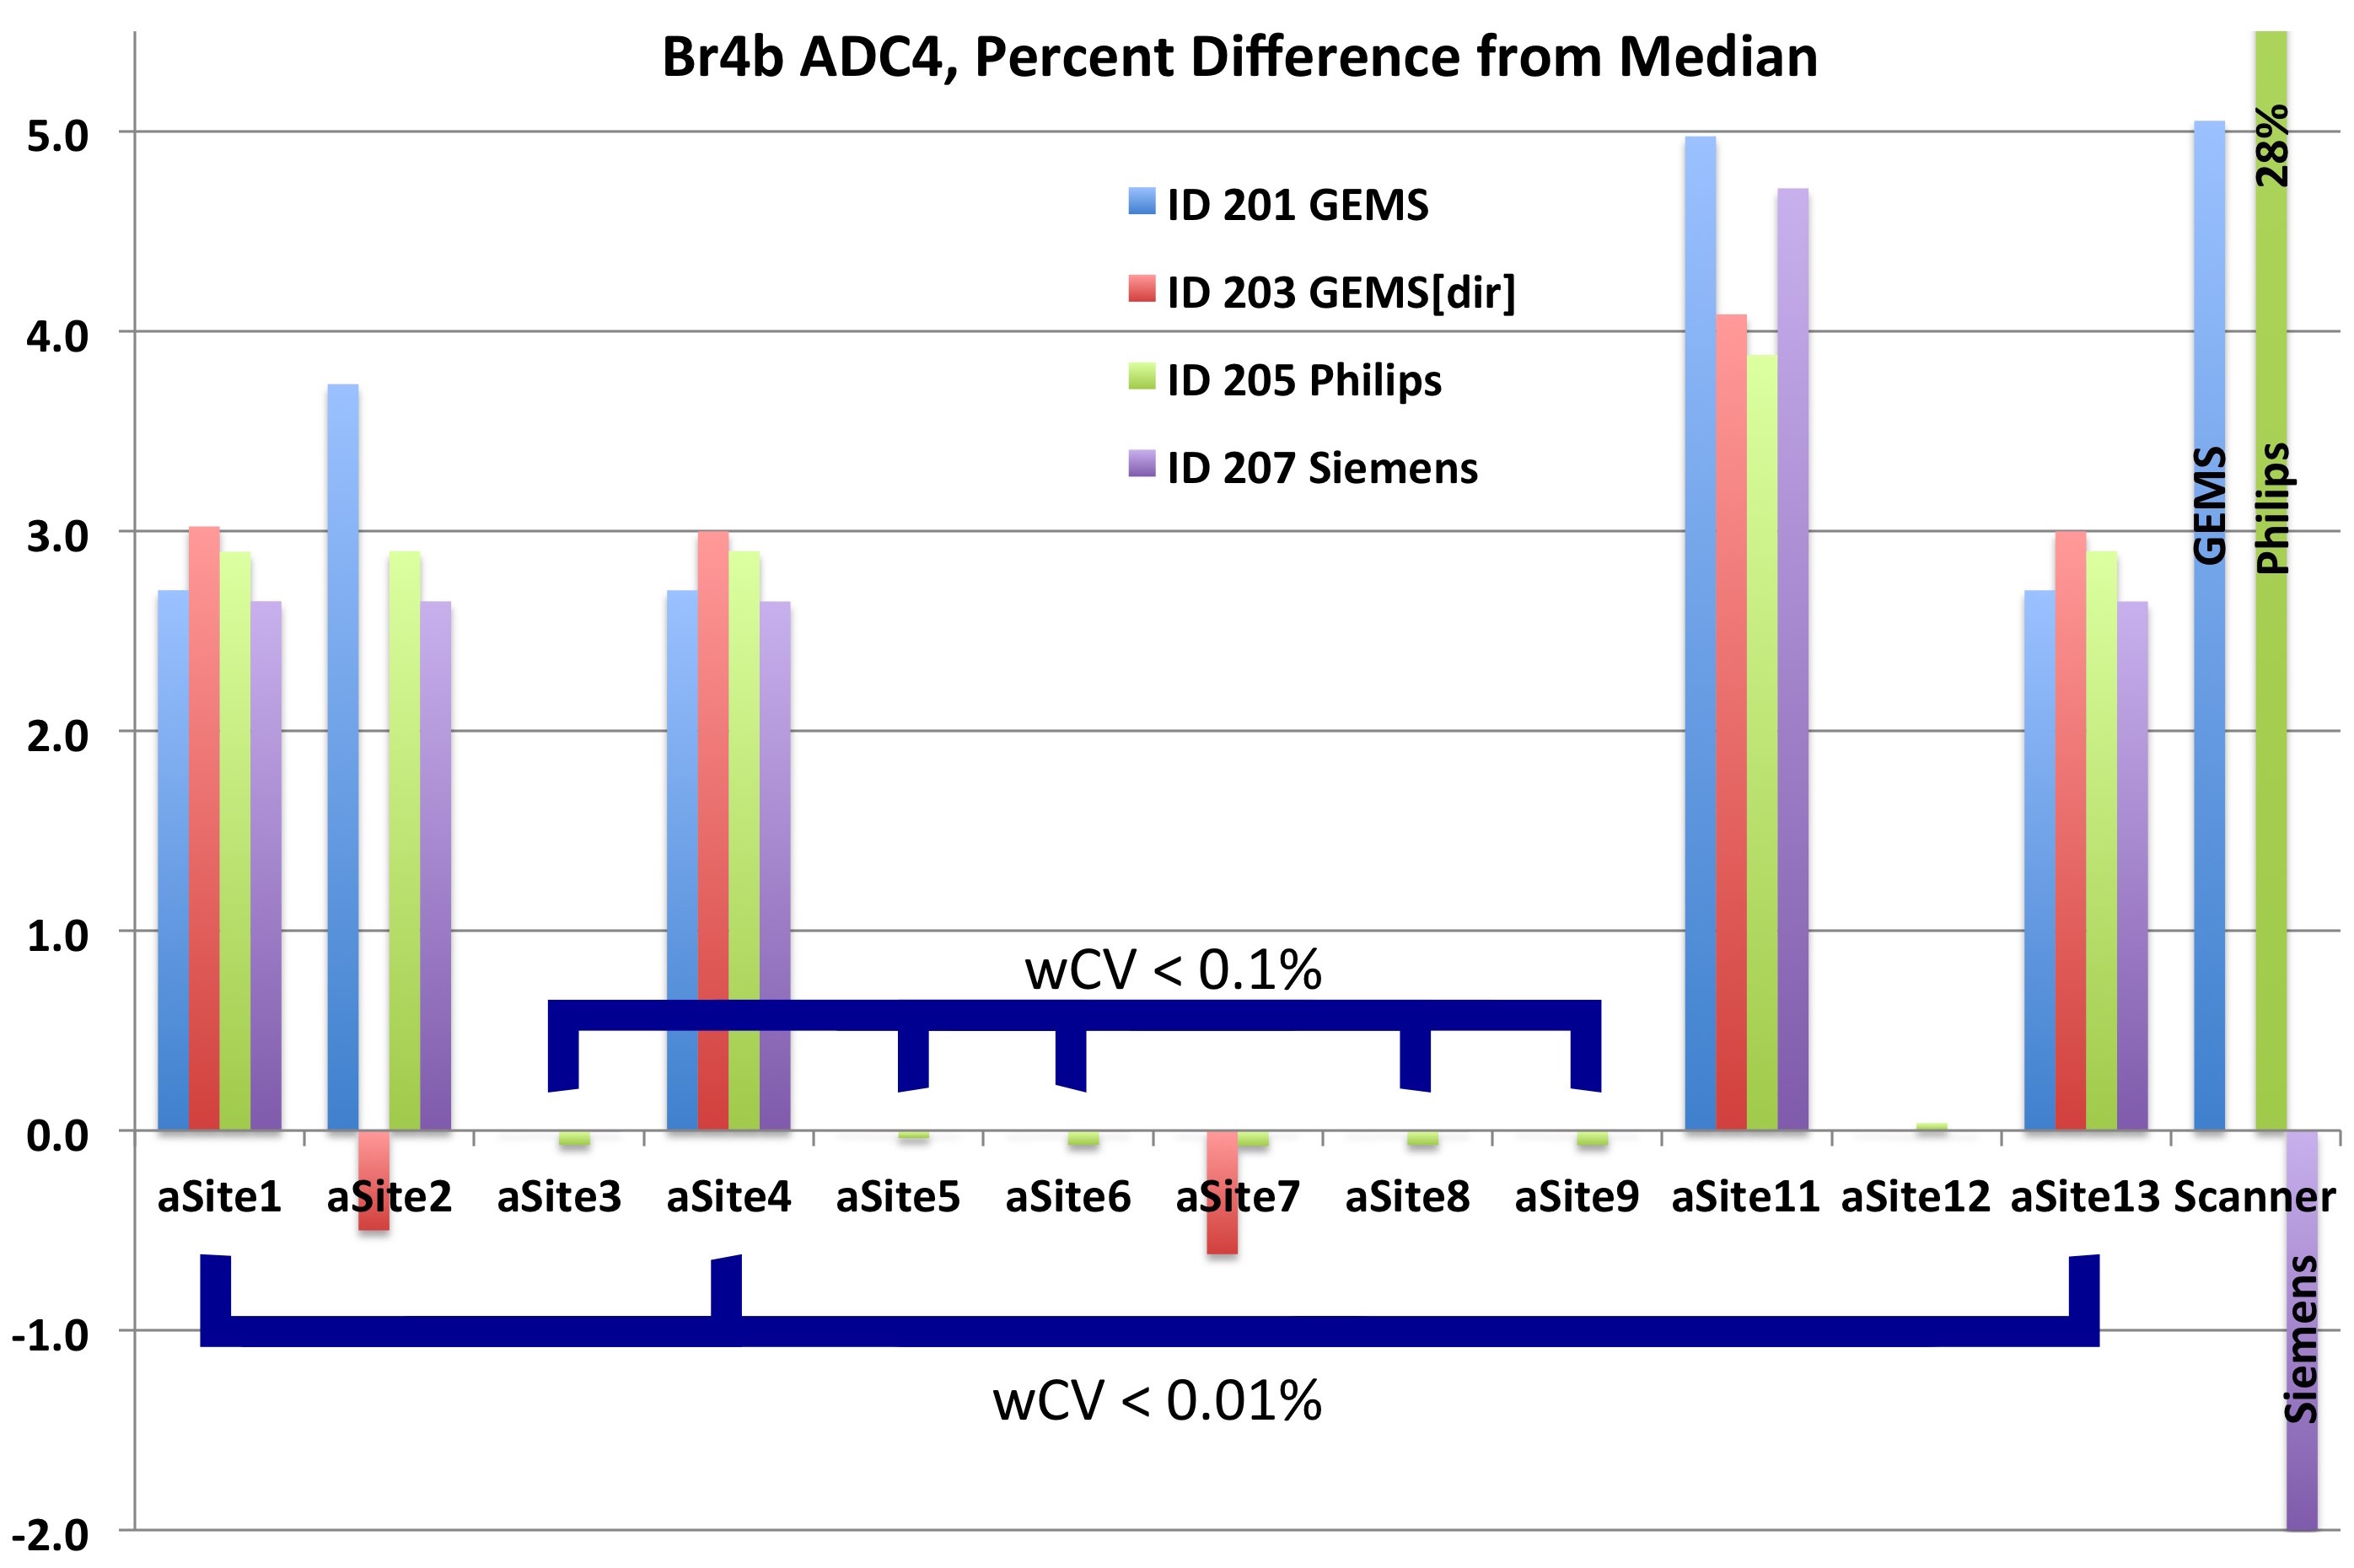
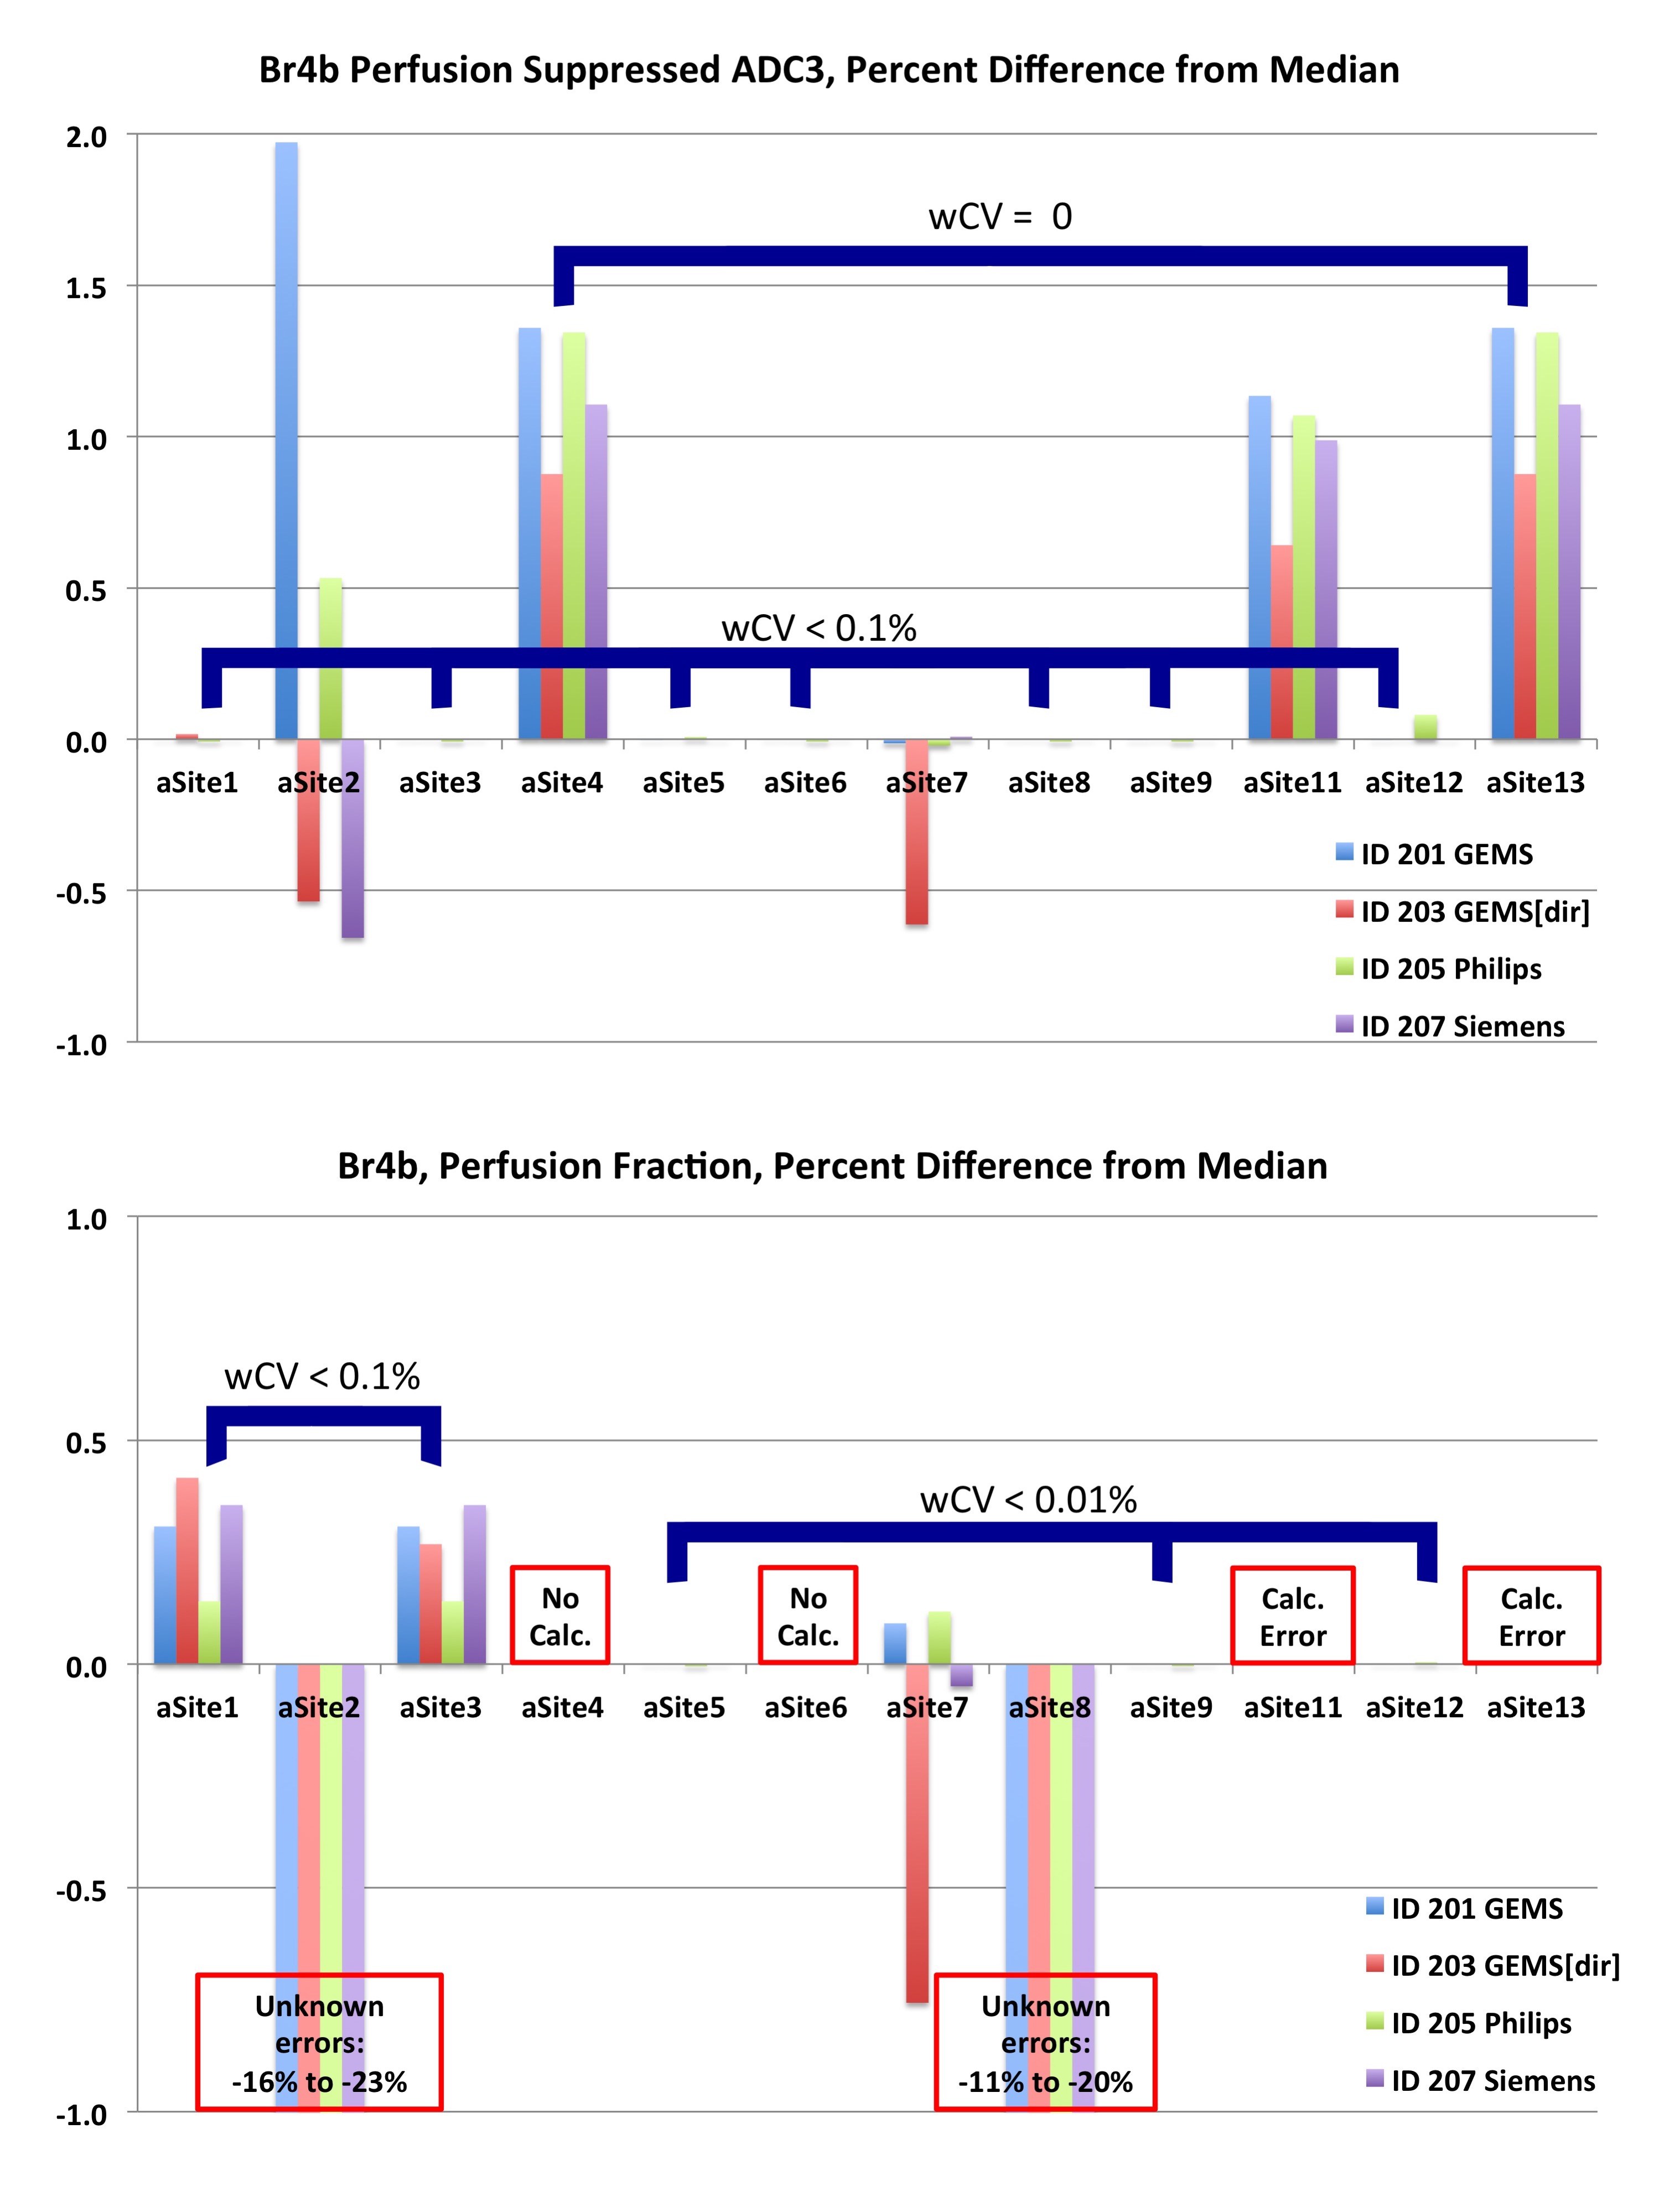
Breast scans: For the Br2b ADC2 metric, 10 of 12 platforms gave essentially identical results (maximum wCV < 0.01%). Site 5 had a consistent 0.05% positive bias relative to the median, while Site 2 varied from 0.8% to 1.1%. The GEMS and Philips scanner-generated maps were within 0.5% of the median values, but the Siemens map gave a -1.4% bias. Figure 3 shows the results for the Br4b ADC4 analysis. Eight sites were grouped: [1,4,13] with wCV<0.01% and [3,5,6,8,9] wCV<0.1%. ADC values differed 2.8±0.2% between the two groups and up to 5% for non-grouped sites. The Philips scanner map had a 28% error due to inaccurate scaling information in the DICOM. Figure 4 shows results for the perfusion suppressed analysis. For the grouped sites these metrics showed less variation than ADC4, but several individual implementations exhibited unexplained larger variations.
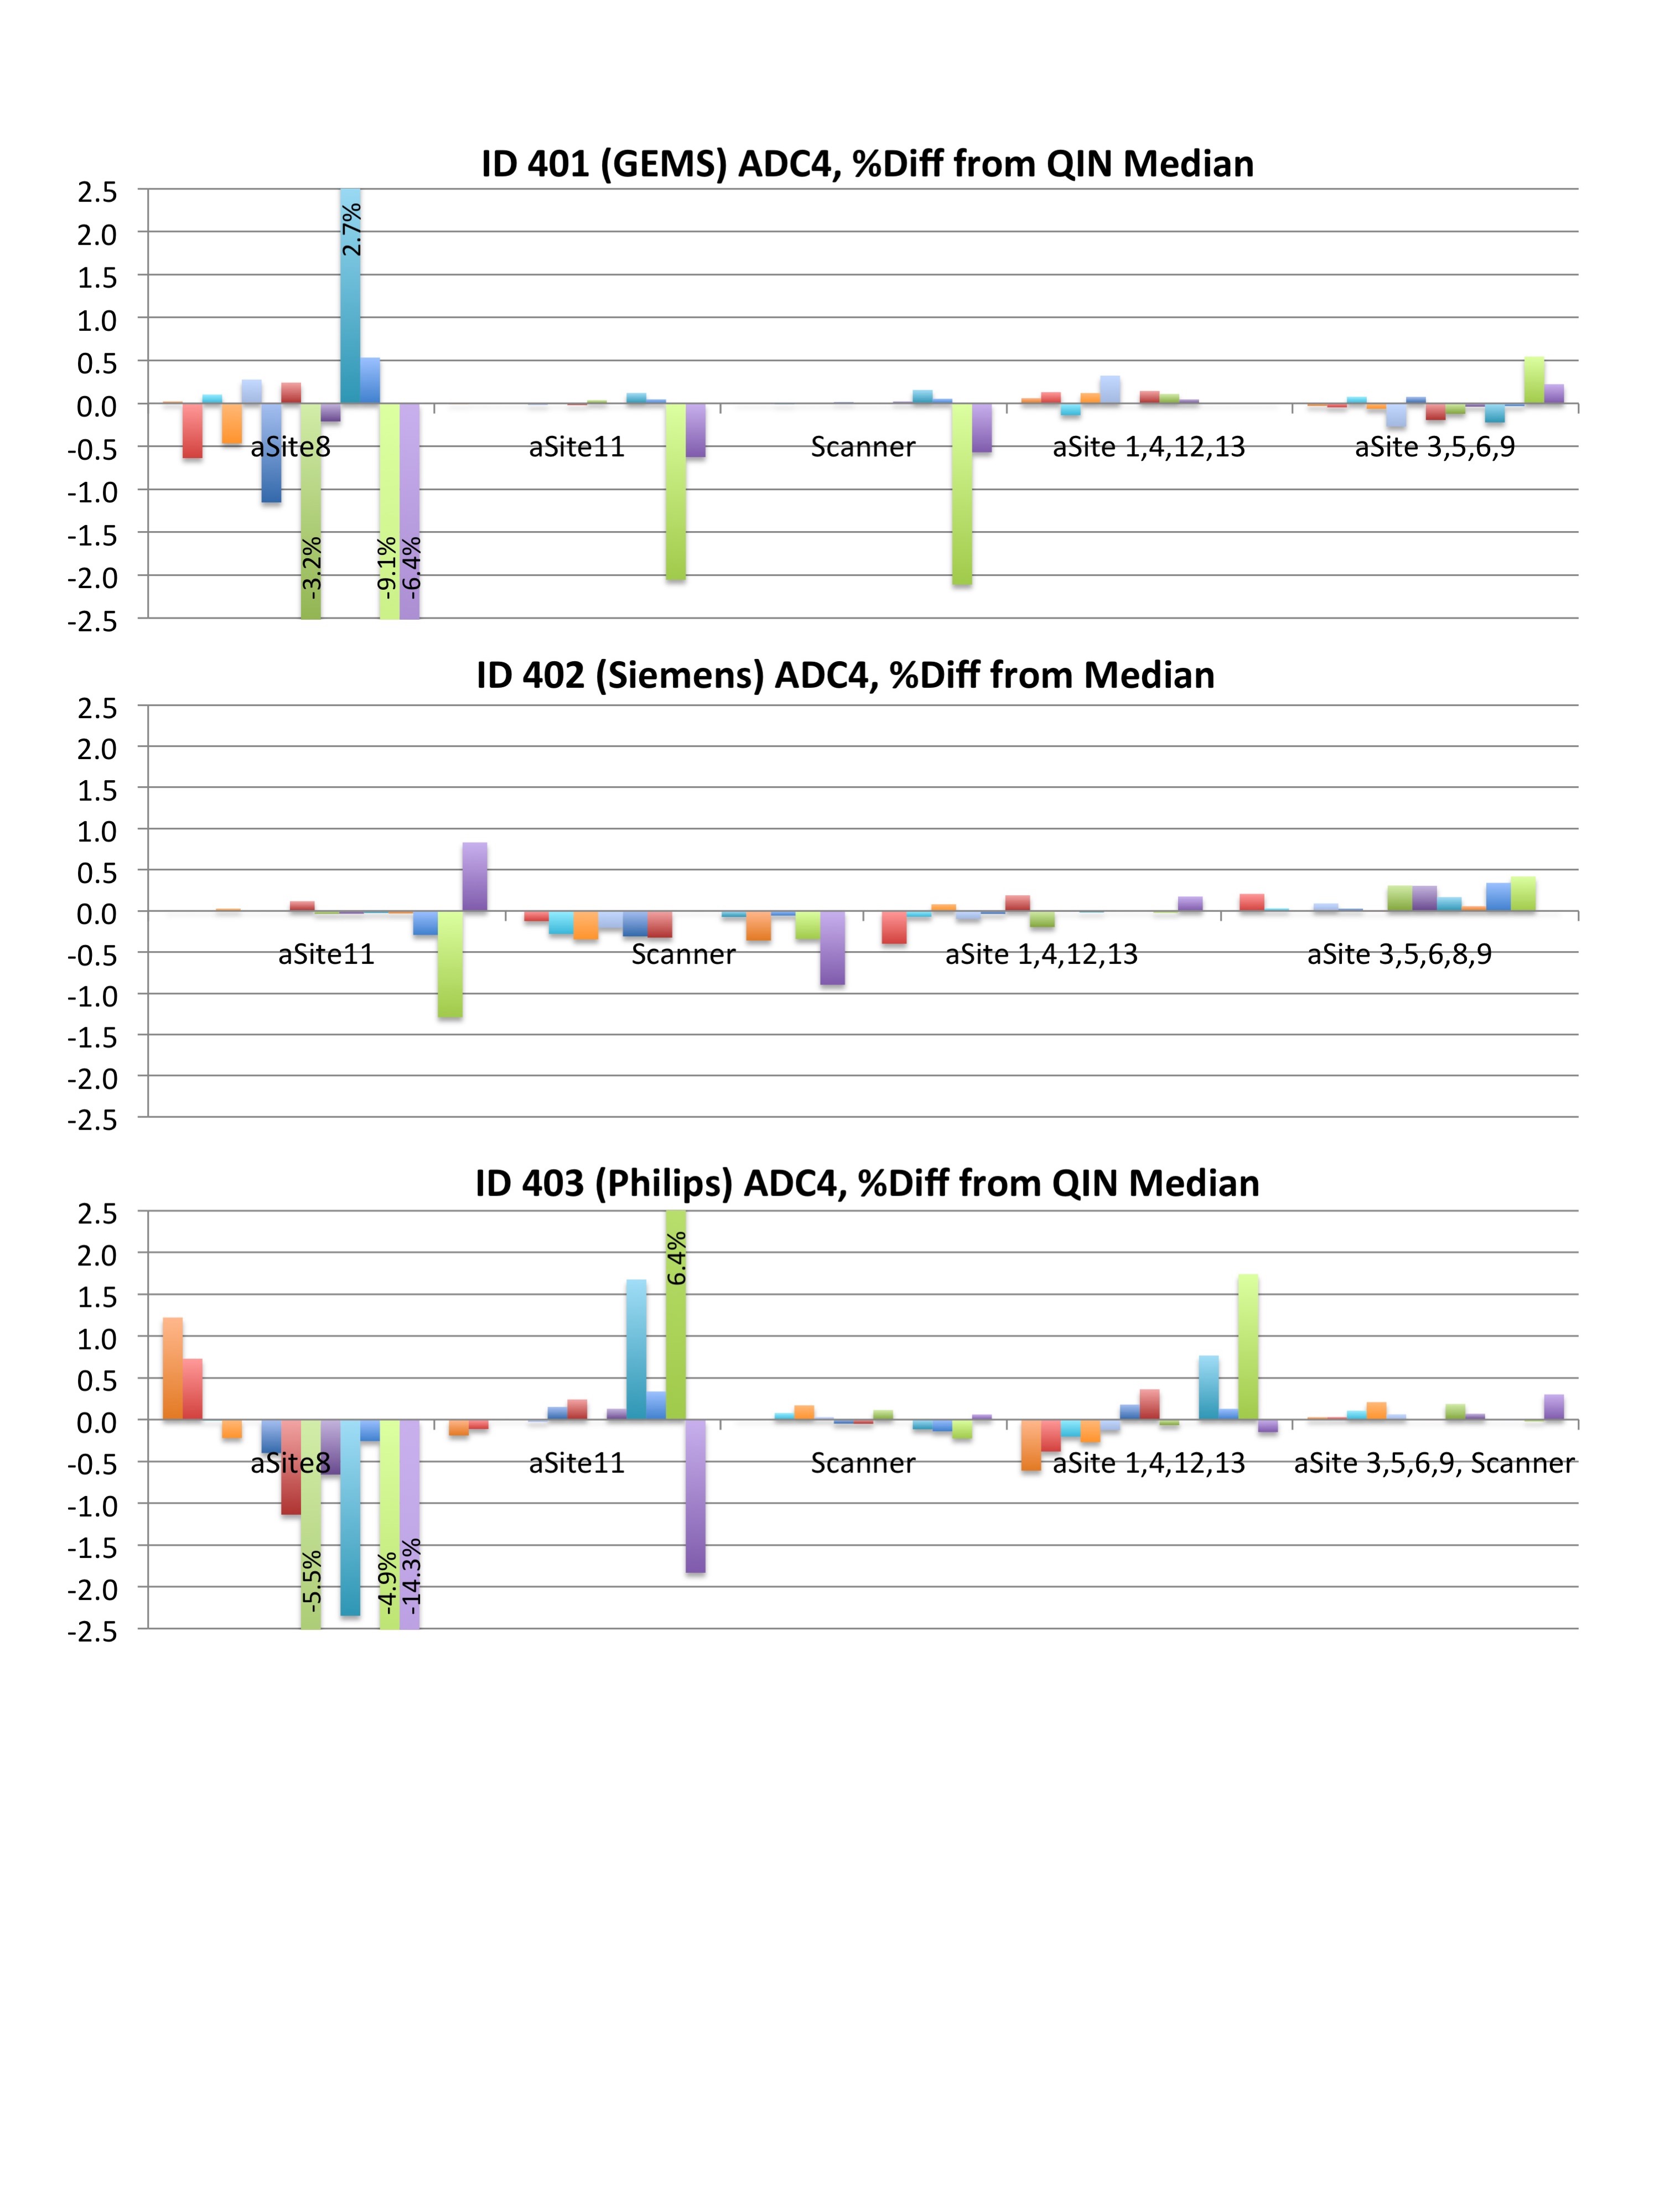
Phantom scans: ADC maps provided by ten sites and scanner-generated maps were analyzed for the three phantom scans, with ADC4 variations shown in Figure 5. Paired wCV measurements over all phantom measurements gave similar groups to the Br4b results (wCV < 0.1%). Differences between the two groups were smaller than for the breast scans, with RMS percent difference in ADC values for all ROI of 0.29%, 0.30%, 0.62% for GEMS, Siemens, and Philips scans respectively. Site 8 showed large differences from the other sites, traced to errors in the DICOM meta-data rather than differences in the ADC algorithms.
DISCUSSION AND CONCLUSION
This study highlights the practical challenges of multi-center ADC analyses and the metric variation arising from algorithm choices, and shows that preservation of critical DICOM meta-data in DWI is essential to avoid significant errors. Adoption of a common format, such as the parametric map DICOM standard extension under development5, would aid meta-analysis of multi-center ADC based studies. Agreement between the majority of implementations was good; the biases in in vivo ADC measures of 2-3% with individual excursions to ~5% are comparable to those reported by Zeilinger6 using different methods. Biases appear particularly common for more complex DWI analyses, and between vendor-generated and post-processing maps, and may be of concern in multi-site studies.Acknowledgements
This research was supported by National Institutes of Health Grants: U01CA151235, R01CA190299, U01CA166104 , U01CA151261, U24CA180918, U01CA140204, U01CA172320, U01CA176110, U01CA154601, U01CA154602, U01CA183848, U01CA142565, U01CA148131
ACRIN receives funding from the NCI, U01CA079778 and U01CA080098
References
1. American College Of Radiology Imaging Network (ACRIN) 6698 Trial, Diffusion Weighted MR Imaging Biomarkers for Assessment of Breast Cancer Response to Neoadjuvant Treatment. https://www.acrin.org/6698_protocol.aspx
2. Clark K, Vendt B, Smith K, et al. The Cancer Imaging Archive (TCIA): Maintaining and Operating a Public Information Repository. Journal of Digital Imaging. 2013; 26(6): 1045-1057. doi: 10.1007/s10278-013-9622-7. http://www.cancerimagingarchive.net
3. Boss M, Chenevert T, et al. Multicenter Study of Reproducibility of Wide Range of ADC at 0C. Proc. RSNA (2016) , Chicago, IL
4. NCIPHub, https://nciphub.org
5. Parametric Map DICOM storage, dicom.nema.org/Dicom/News/june2014/docs/sup172.pdf
6. Zeilinger MG, Lell M, Baltzer PAT, et al. Eur Radiol (2016). doi:10.1007/s00330-016-4403-6
Figures