0594
Genetic rescue of brain morphometry in a mouse model of neurodevelopmental disorder1Neurosciences and Mental Health, SickKids Hospital, Toronto, ON, Canada
Synopsis
In this study, we scanned a mouse model of Rett syndrome before and after reactivation of Mecp2, the gene strongly implicated in the disorder. We found that reactivation of Mecp2 at three different time points in adulthood lead to drastic growth of the neuroanatomy across many regions of the cortex, cerebellum and medulla. Our findings demonstrate that the developmental delayed brain retains an innate plasticity that can be recruited to restore neuroanatomical structure in adulthood.
Introduction
Autism and other Neurodevelopmental disorders (NDD) are caused by genetic and environmental factors that disrupt brain maturation. Interestingly, recent pharmacological and genetic interventions in NDD mouse models have shown that many of the behavioural and cellular impariments can be rescued, suggesting that the developmentally impaired brain is amendable to treatment in adulthood1. Although these findings are exciting, of particular interest is the near complete reversal of phenotypes following knock in of Mecp2, a gene strongly implicated in Rett syndrome2,3. In this mouse model, the Mecp2 gene is silent from birth leading to behavioural and neuronal impairments in early life. However, at the time of the experimenters choosing, the functional Mecp2 gene can be reactivated leading to a restoration of homoeostasis and a structural / functional rescue of the cellular environment. Many of the rescue studies used low-throughput methods to quantify intervention efficacy in a limited number of brain regions and restricted their analyses to a few time points, only providing a snapshot of the cellular changes over space and time. In this study, we longitudinally scanned the Mecp2 mouse model with in vivo magnetic resonance imaging to gain a whole-brain perspective of the neuroanatomical trajectory following Mecp2 reactivation. We repeated the experiment at three different time points; a) in males during the early (P50 to 80) and severe (P80 to 110) stages of phenotype progression and c) in adult females with stable and mild phenotypes (P200 to 230) to determine whether the timing of Mecp2 reactivation influences the spatial and temporal dynamics of the neuroanatomical outcomes.Methods
In order to control the timing of Mecp2 reactivation, we crossed heterozygous Mecp2-STOP (Mecp2tm2Bird/J) females with Cre (CAG-cre/Esr1) males. Male and female mice possessing a functional, or silent copy of the Mecp2 gene were scanned in vivo with a Manganese-enhanced MRI protocol (MEMRI: T1-weighted gradient echo, TR=26ms, TE=5.37ms, FOV=7.7x2.0 x2.0cm3, matrix=770x202x202, 100um3 isotropic resolution, 4 nt, 1 hour). After the baseline scan, mice were treated for 4 weeks with oil or tamoxifen followed by a post-treatment MEMRI scan. The acquired images from mice possessing a functional, silent or reactivated copy of Mecp2 from the early, severe and mild experimental groups were aligned using iterative linear and nonlinear registrations steps4. This process generates a consensus average of each individual brain and the deformations from this average. The Jacobian-determinants, which represents local volume changes, were then used in the statistical analyses. Multiple comparisons were controlled with the false-discovery rate.Results
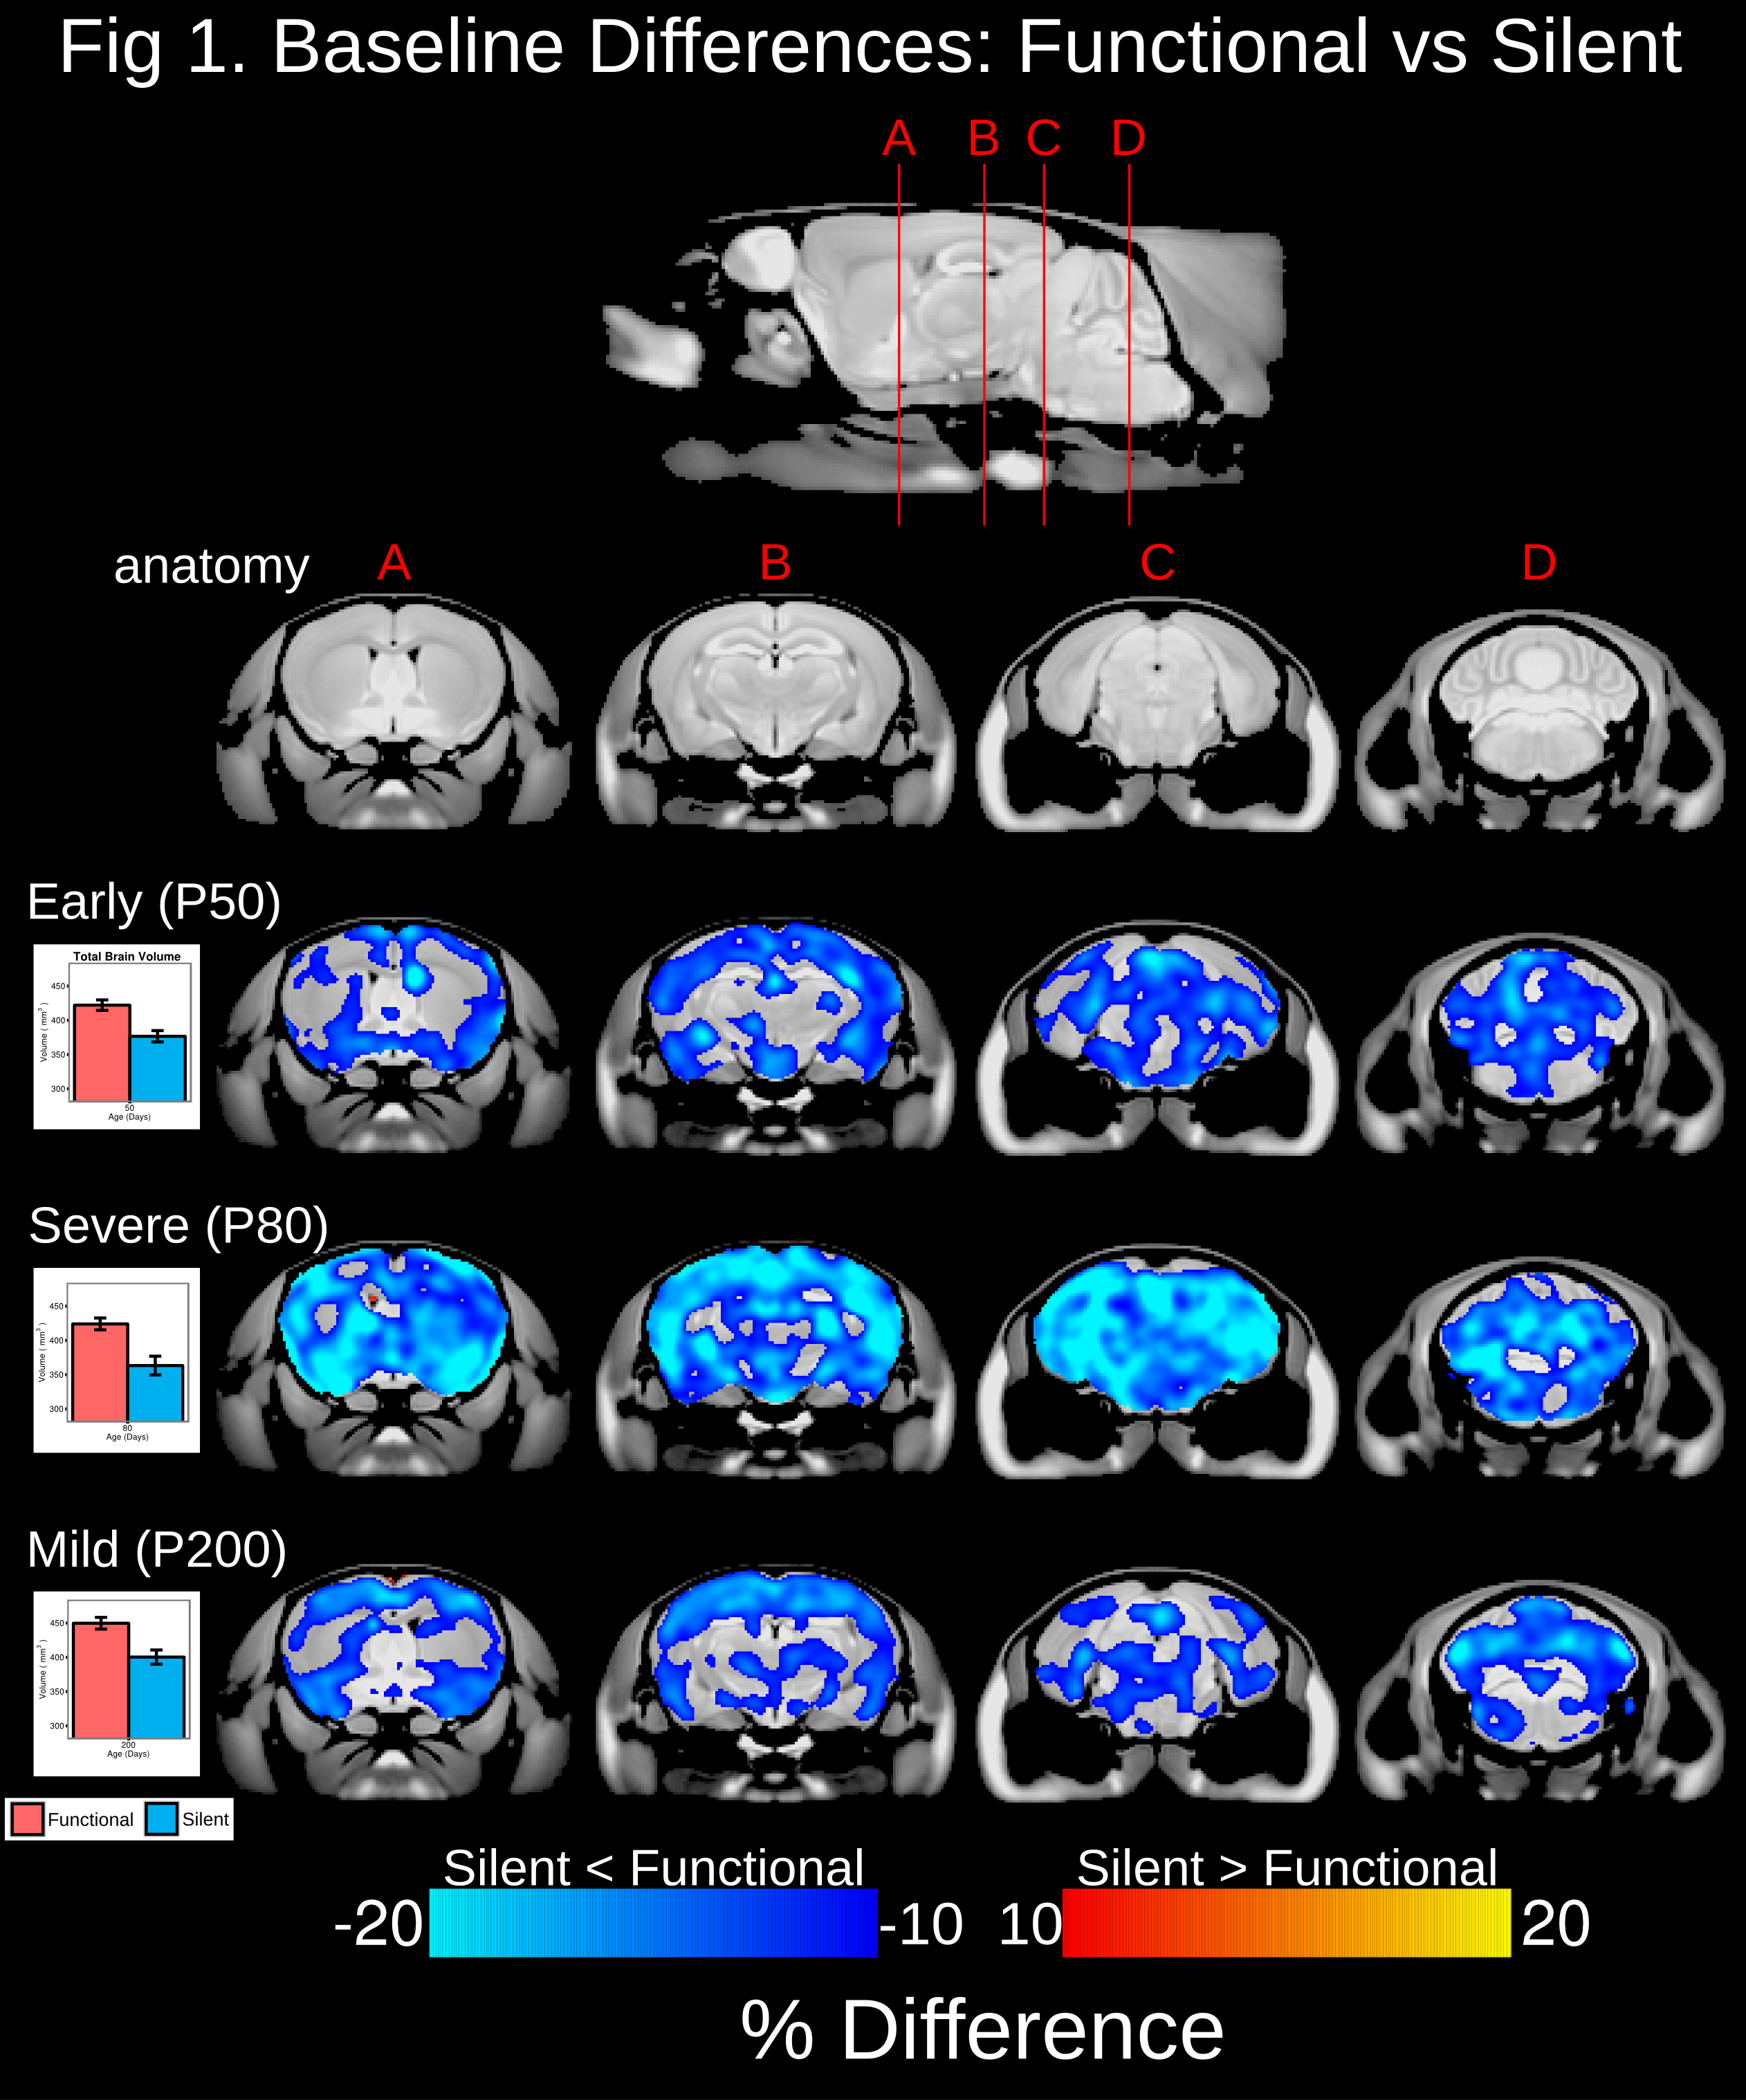
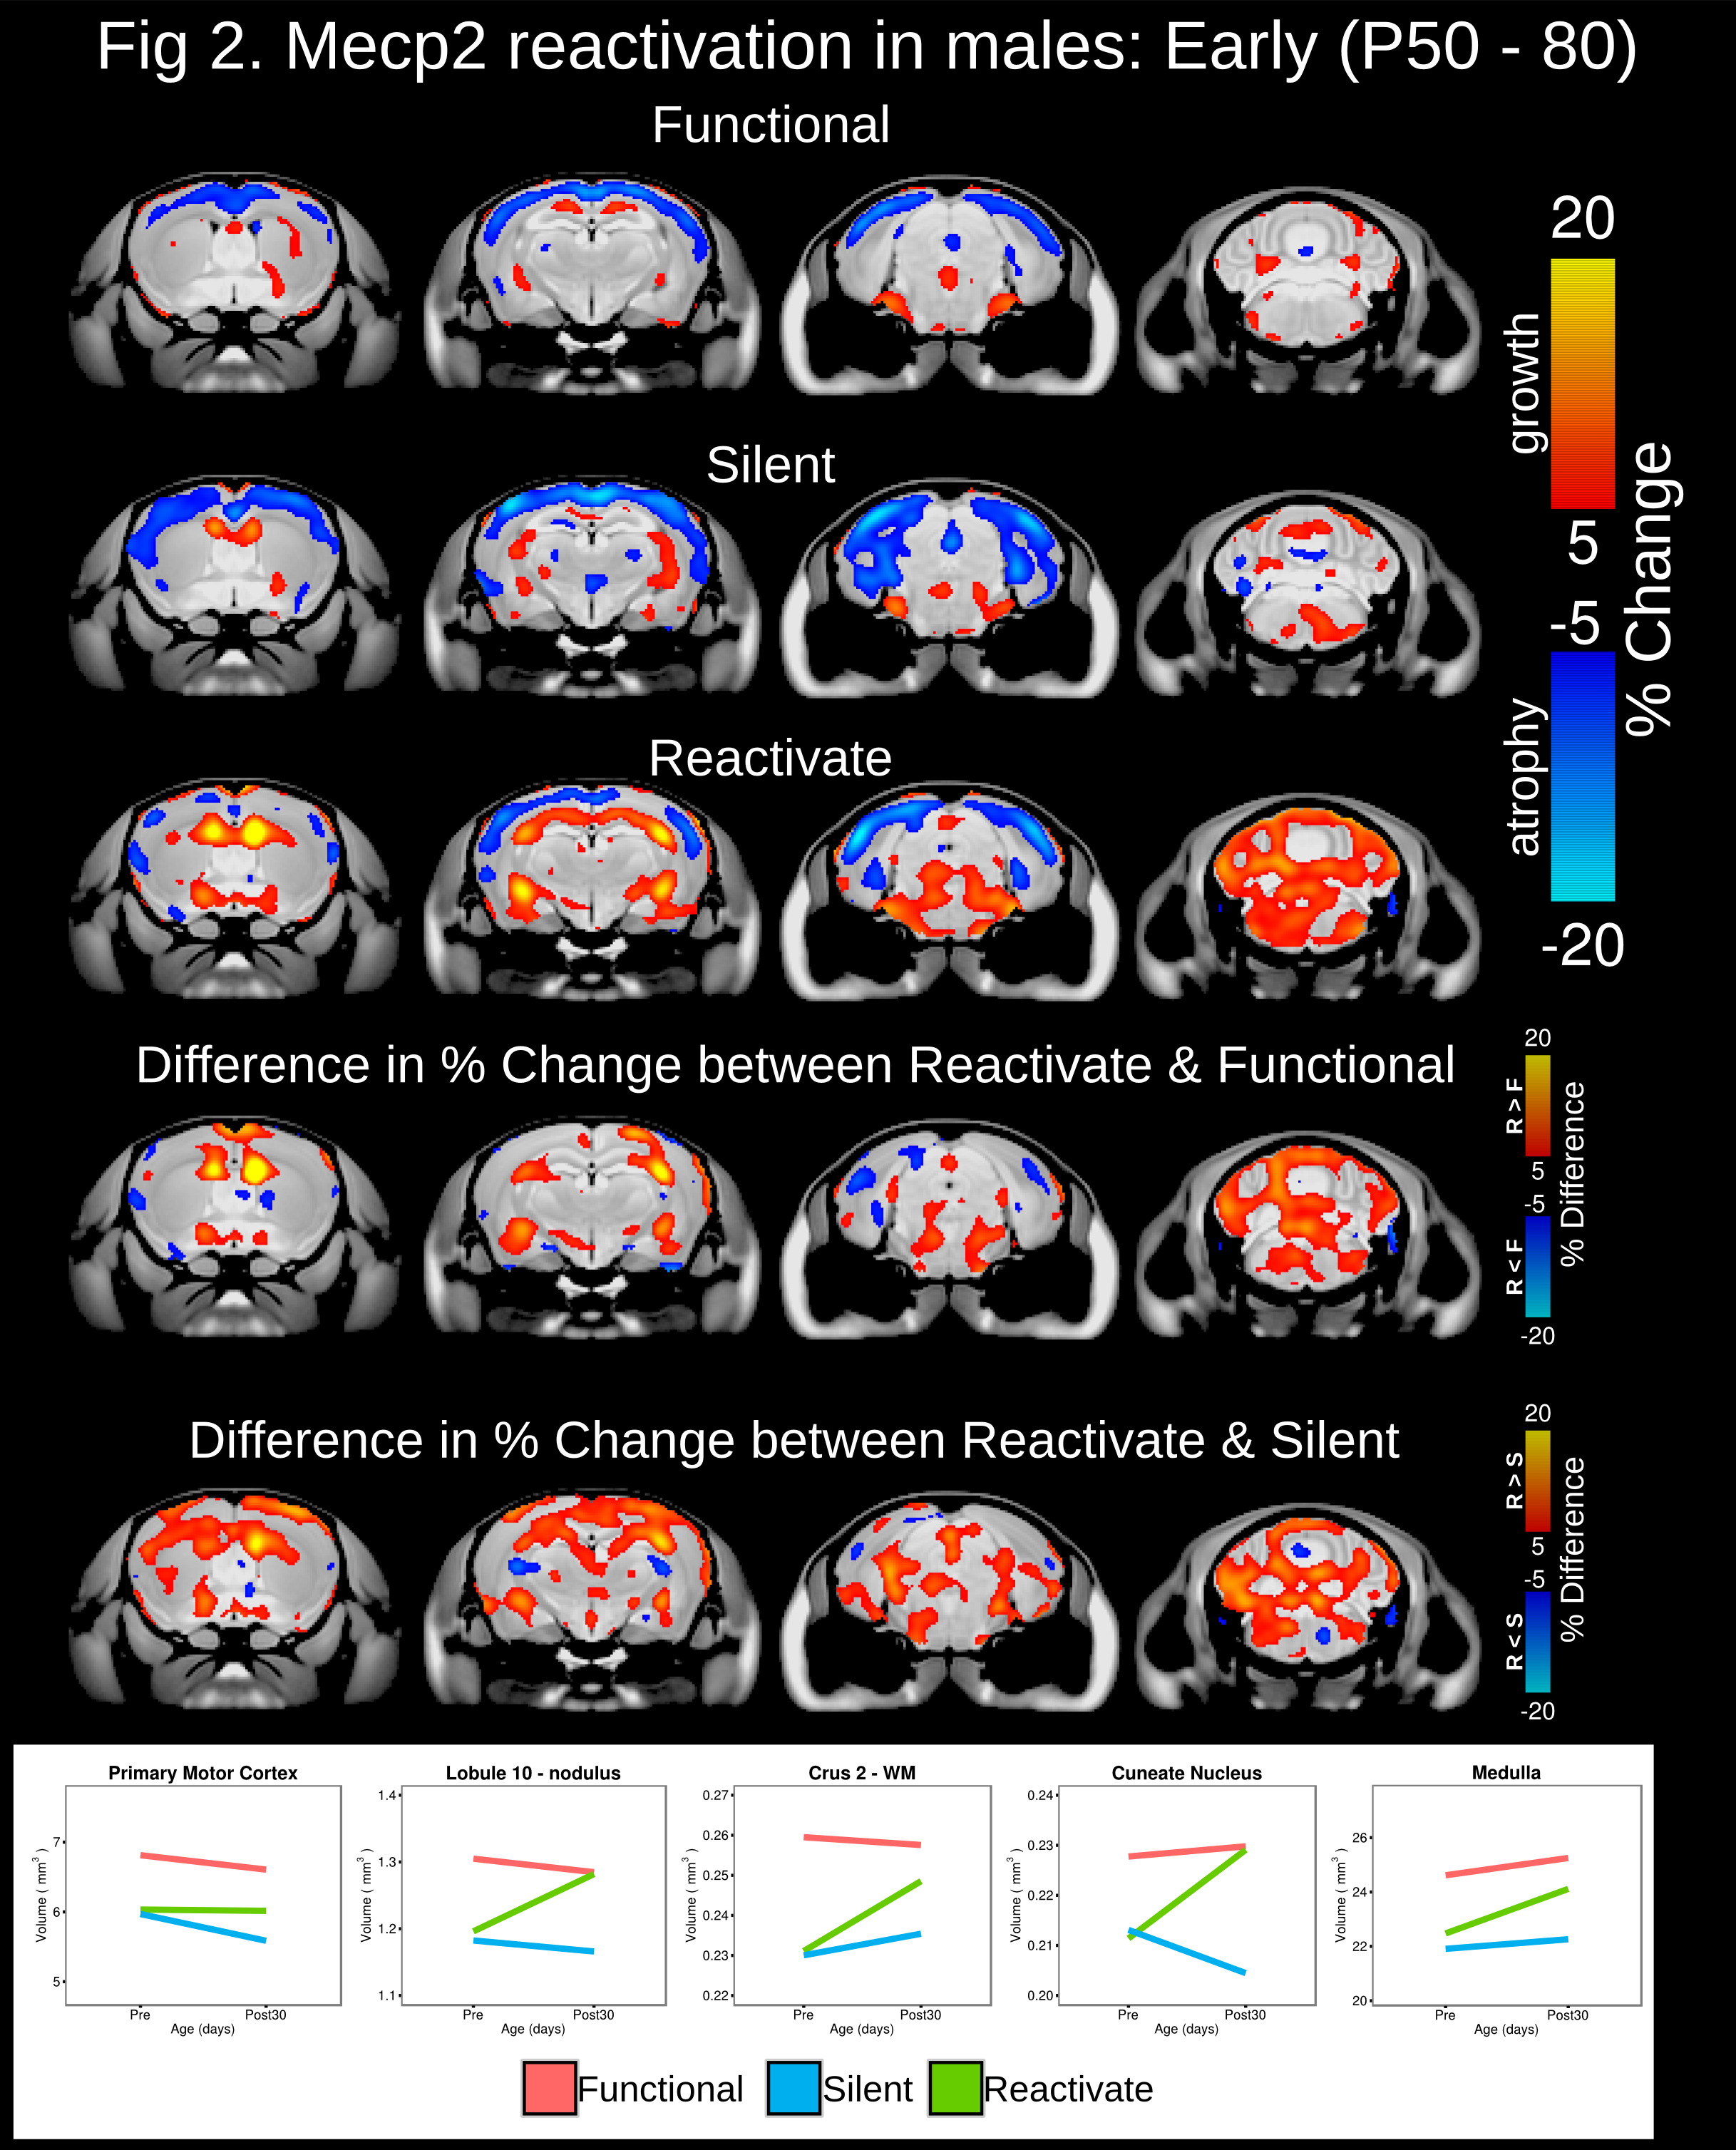
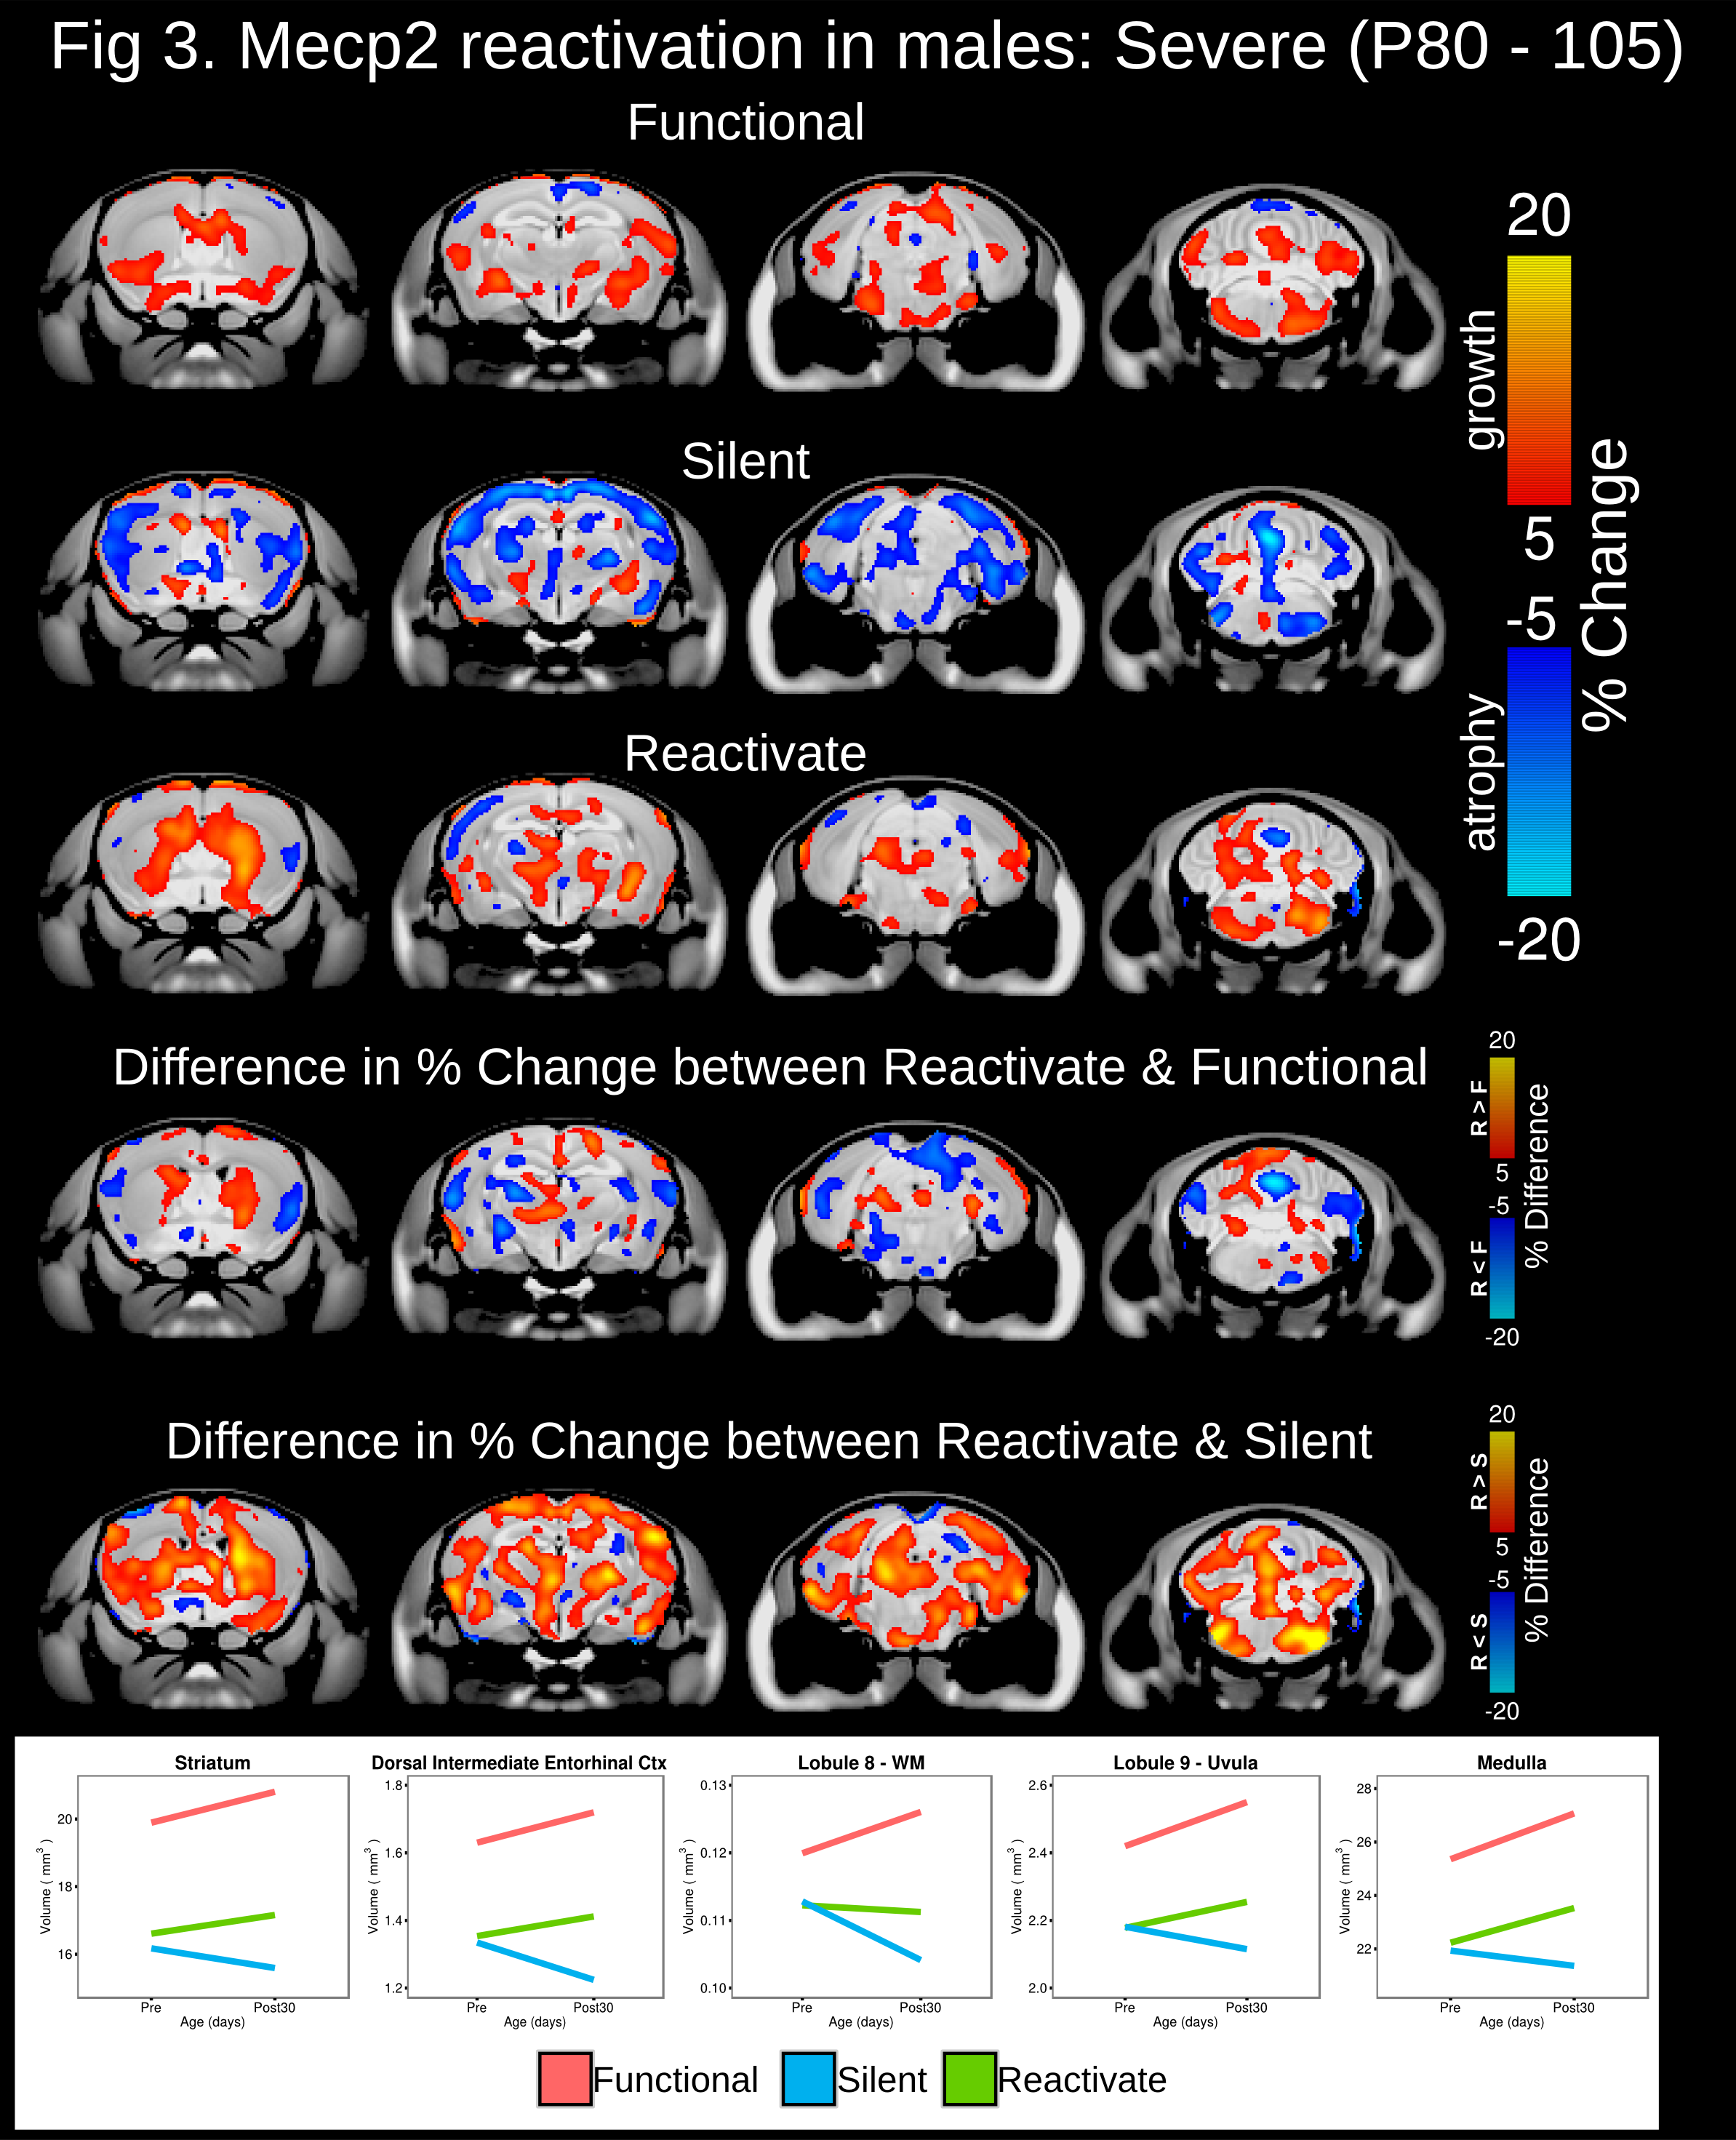
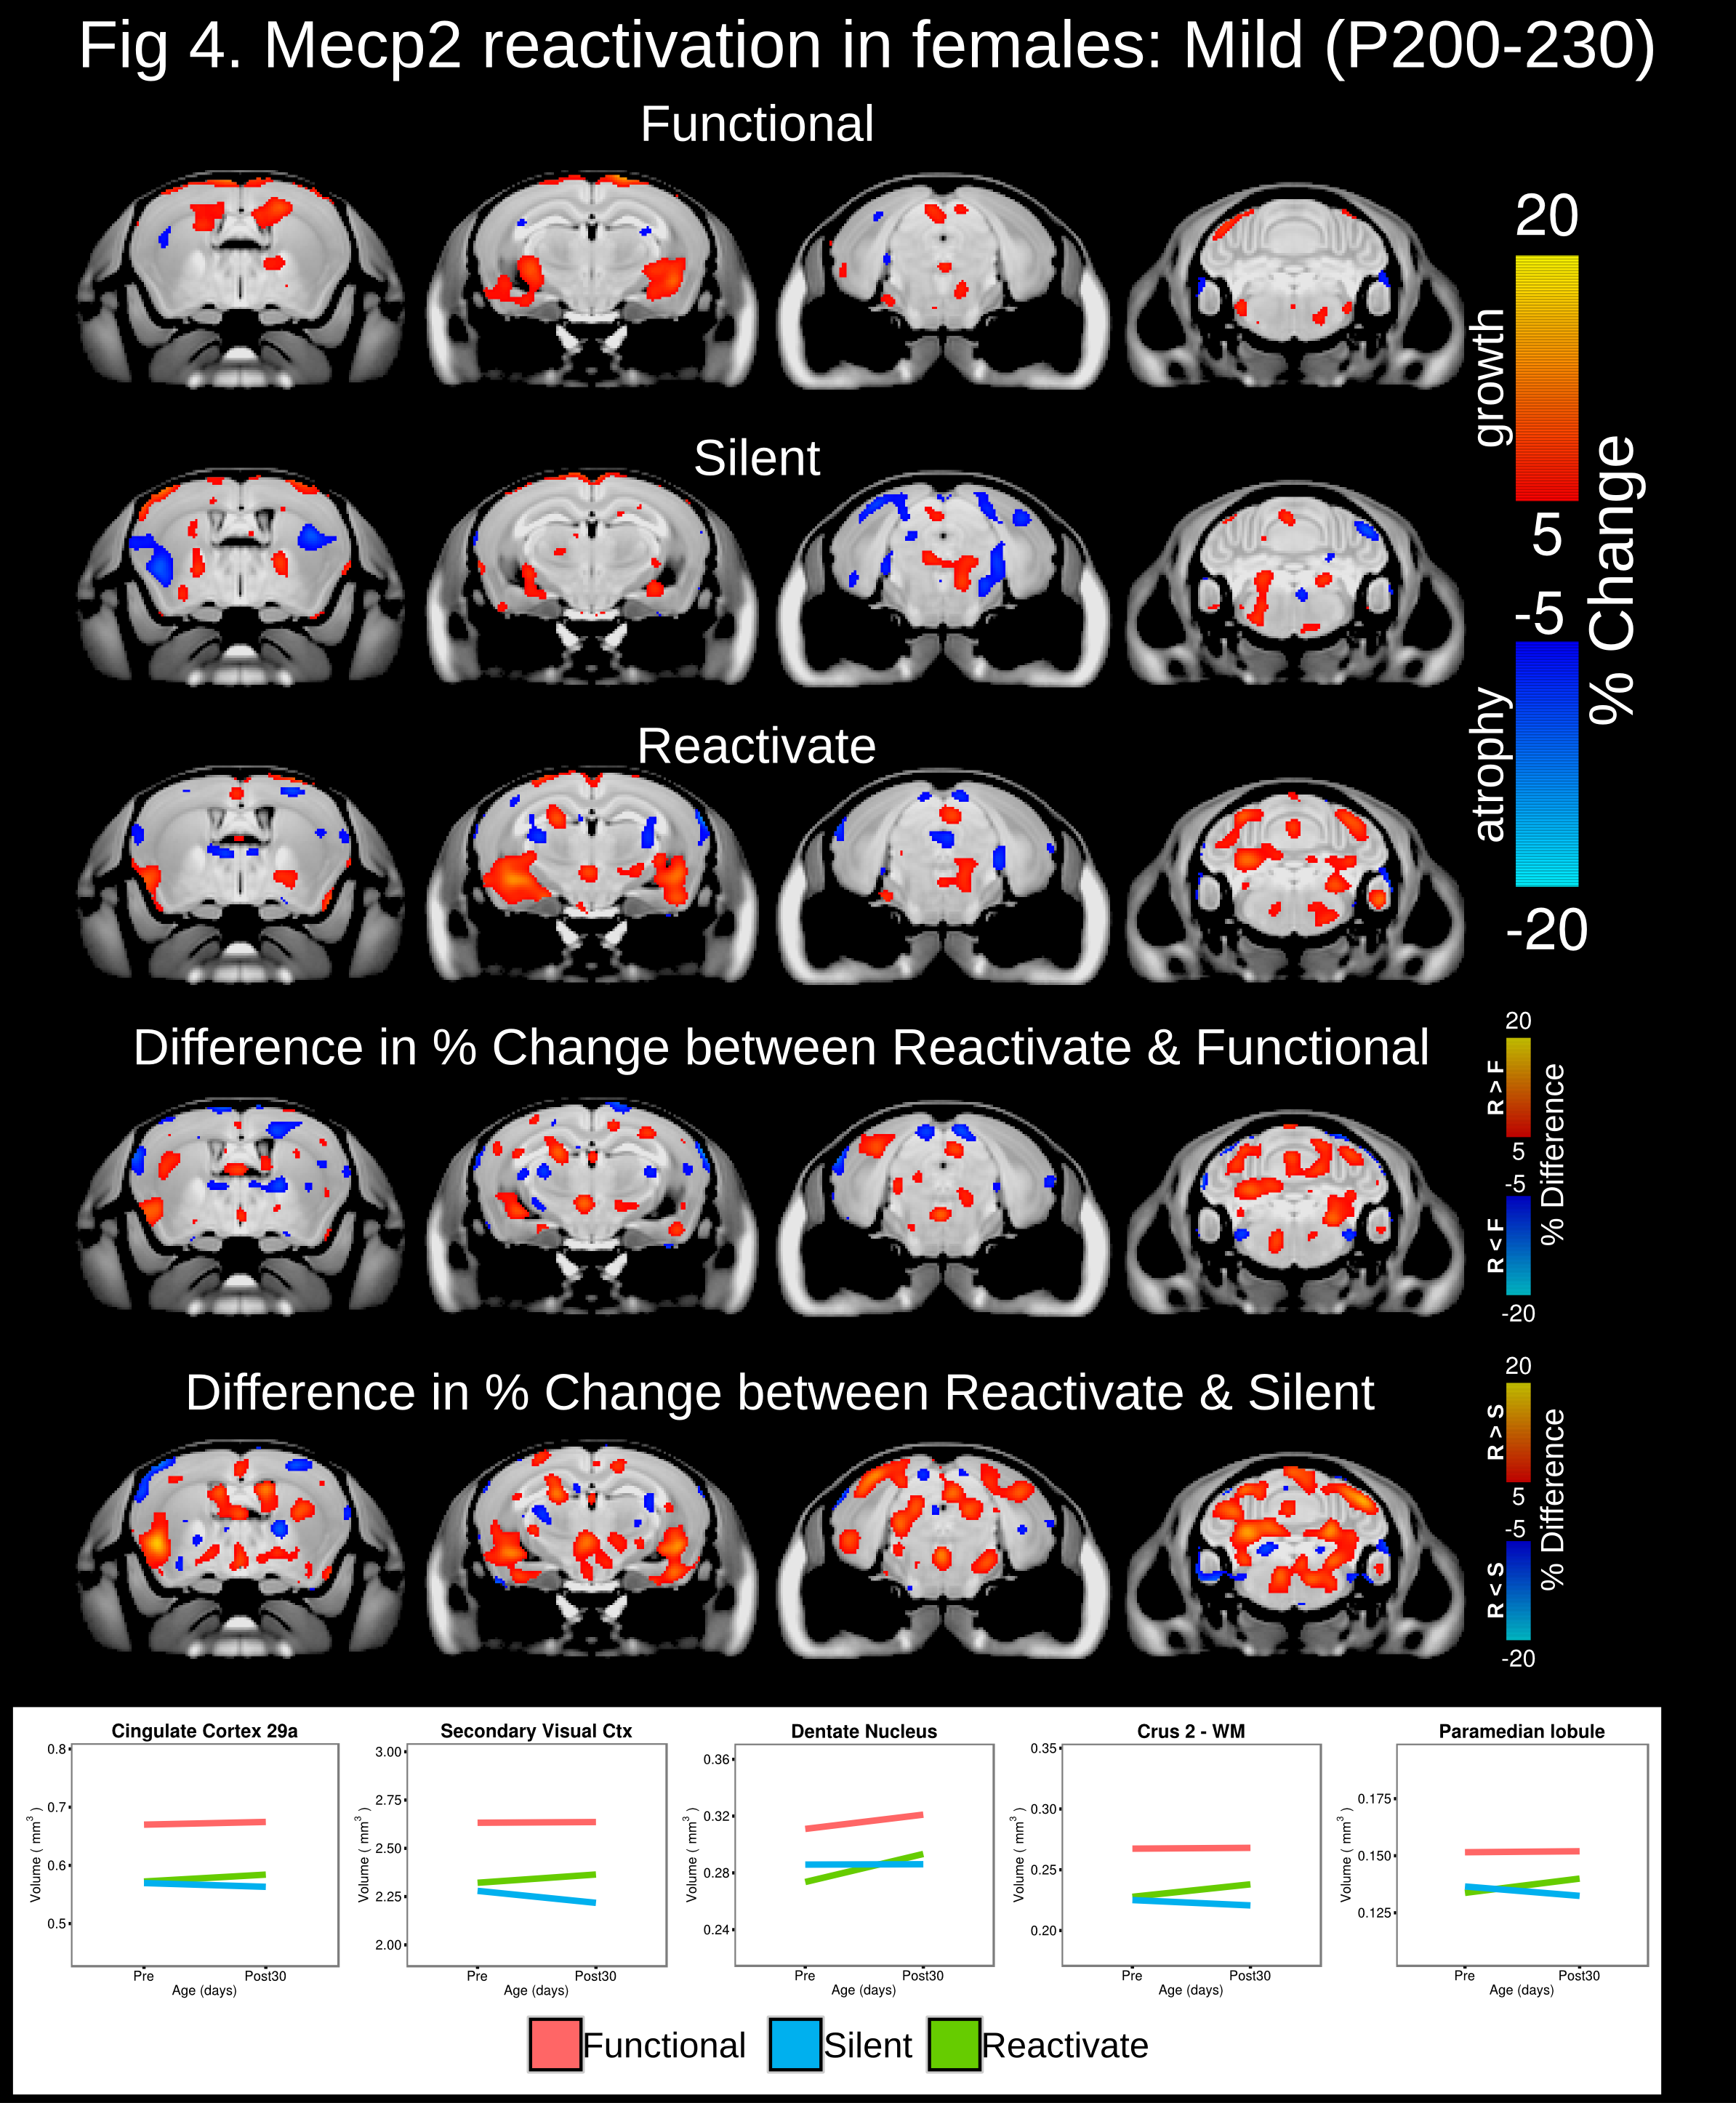
At baseline, total brain volume was 10-14.3% smaller in mice possessing a silent compared to functional copy of Mecp2 from the Early, Severe and Mild experimental groups (Figure 1). Drastic volumetric decreases were localized to the cortex, hippocampus, amygdala, midbrain, medulla and cerebellum. In the Early experimental group, Mecp2 reactivation lead to greater than 5% volume increases within regions of the cortex, striatum, hippocampus, midbrain, cerebellum and medulla (Figure 2). Interestingly, the growth trajectory in the reactivated brain was greater than both the functional (>5%) and silent groups, leading to a full neuroanatomical rescue in regions of the cerebellum and a drastic deviation from silent mice across the cortex, hippocampus, cerebellum and medulla. Mecp2 reactivation during the onset and progression of severe Rett-associated phenotypes lead to a drastic deviation in growth trajectories between reactivated and silent mice across many neuroanatomical regions (Figure 3). Late Mecp2 reactivation increased the growth trajectory relative to functional mice in the striatum and a few cortical and cerebellar regions. However, unlike the early time period, the growth trajectory in the reactivated brain increased at the same rate or to a lesser extent than the functional group. In the female mice with mild phenotypes, Mecp2 reactivation lead to neuroanatomical growth within the globus pallidus, entorhinal cortex and cerebellum (Figure 4). Although more subtle than the males, the growth trajectory in female reactivated mice was greater than functional and silent mice within these regions, particularly the deep cerebellar nuclei and Crus1/2 of the cerebellum (>5% difference).Discussion
These findings demonstrate that Mecp2 reactivation in male and female mice leads to volumetric increases across adulthood, particularly within regions of the cerebellum and medulla. Although baseline differences exist, Mecp2 reactivation during the early stages leads to a normalization of neuroanatomical volumes with mice possessing a functional copy of Mecp2 (i.e. wildtypes), an effect that was not achieved in the other experimental groups. However, reactivation during the severe stages of Rett phenotypes leads to a drastic deviation with silent mice which tend to have pronounced neuroanatomical atrophy during these stages of severe phenotype progression.Acknowledgements
No acknowledgement found.References
1. Ehninger, D., Li, W., Fox, K., Stryker, M.P., Silva, A.J. (2008). Reversing neurodevelopmental disorders in adults. Neuron, 60(6),950-60. doi: 10.1016/j.neuron.2008.12.007.
2. Guy, J., Gan, J., Selfridge, J., Cobb, S., & Bird, A. (2007). Reversal of Neurological defects in a mouse model of Rett syndrome. Science, 315, 1143-1147.
3. Robinson, L., Guy, J., McKay, L., Brockett, E., Spike, R.C., Selfridge, J., et al. (2012). Morphological and functional reversal of phenotypes in a mouse model of Rett syndrome. BRAIN, 1-12.
4. Avants, B.B., Epstein, C.L., Grossman, M., Gee, J.C. (2008). Symmetric diffeomorphic image registration with cross-correlation: Evaluating automated labelling of elderly and neurodegenerative brain. Med. Image Anal., 12, 26-41.
Figures