0592
Detailing the Origin of BOLD fMRI in Mice: Somatosensory Stimulation versus Pharmacologically Induced Blood Pressure Alterations1Berlin Ultrahigh Field Facility (B.U.F.F.), Max Delbrueck Center for Molecular Medicine (MDC), Berlin, Germany, 2Max Delbrueck Center for Molecular Medicine (MDC), Berlin, Germany, 3Experimental and Clinical Research Center (ECRC), a joint cooperation between the Charité Medical Faculty and the Max Delbrueck Center, Berlin, Germany
Synopsis
The combination of somatosensory fMRI (sfMRI) and mouse genomics holds great potential to unravel the underlying mechanisms of chronic pain. Transient stimuli were shown to induce unspecific BOLD patterns in mice. It is known that increases in mean arterial blood pressure (MABP) can mimic BOLD activations in rats. To detail the origin of the unspecific BOLD patterns evoked in the murine brain we performed sfMRI along with pharmacologically induced blood pressure alterations while monitoring MABP. We compared MABP changes, BOLD signals and BOLD patterns between the types of stimuli and observed confounding effects of MABP on murine BOLD fMRI.
Introduction
The combination of somatosensory fMRI (sfMRI) and mouse genomics holds great potential to unravel the underlying mechanisms of chronic pain [1,2]. When mild noxious electrical/heat stimuli are applied to the mouse paw unspecific blood oxygenation level-dependent (BOLD) patterns are observed in the murine brain [1,2]. The interpretation of BOLD responses commonly assumes the origin to be neural activation (neurovascular coupling), but recently it was shown that mild noxious heat stimulation in mice induces significant increases in mean arterial blood pressure (MABP) [2]. It is known that strong MABP alterations can mimic BOLD activations in rats [4,5,6]. We hypothesize that BOLD responses in anesthetized mice may be at least partially caused by MABP alterations rather than neural activations.
To detail the origin of such BOLD responses we performed fMRI of somatosensory stimulation along with pharmacologically induced blood pressure alterations in the same mice while monitoring MABP. We compared MABP changes, BOLD signals and BOLD patterns between the types of stimuli to investigate the potential confounding effect of MABP on murine BOLD fMRI.
Materials & Methods
Animal preparation: 13 male C57BL/6N mice were studied under 1% isoflurane. The animals were intubated, artificially ventilated and paralyzed [2]. The left femoral artery was cannulated to allow for continuous monitoring of MABP during fMRI. To induce MABP alterations phenylephrine (10mg/kg) or angiotensin II (500ng/kg) was injected (i.v.). Subcutaneous hindpaw electrostimulation was carried out at 1mA (0.5ms length, 12Hz, 15sec trains).
MR Imaging: High-resolution sagittal T2-weighted imaging was used to position 19 axial slices for T2*-weighted fMRI (GE-EPI, TR/TE/FA = 2500ms/11.0ms/80°, FOV/matrix/resolution = 16x12x11.4mm / 80x60x19 / 200x200x500μm), TA = 5min. Cerebral vasculature was mapped using time of flight MR angiography, registered to a mouse brain atlas and combined using maximum intensity projection. All images were acquired on a 9.4T Bruker Biospec with a transceive cryogenic quadrature RF surface coil (Bruker, Ettlingen, Germany).
Data analysis: FMRI data were motion corrected, smoothed, registered to a mouse brain atlas and statistically analyzed using FSL. As explanatory variable we used a) the neural model (15 sec block, double gamma convolution + temporal derivative) and b) the MABP signal trace. Group conjunction maps were created by adding the binarized (activation yes/no) statistic maps of individual mice (FWE corrected at p<0.05).
Results
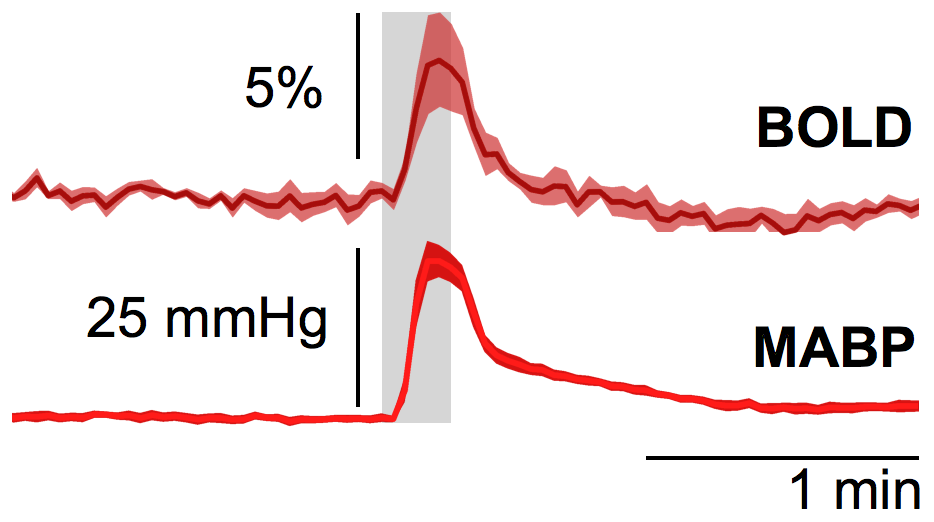
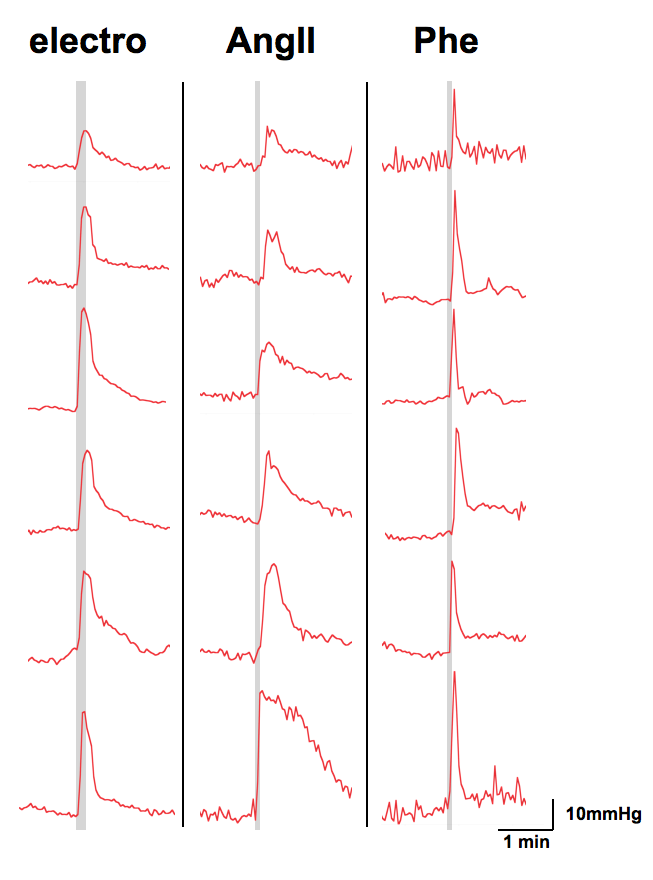
Subcutaneous electrostimulation of the hindpaw (1mA) was found to evoke MABP alterations of 15 to 40 mmHg (Fig. 1), whose temporal profiles displayed great similarity to the BOLD responses. Pharmacological stimulations via injection of angiotensin II or phenylephrine produced comparable MABP alterations (Fig. 2) and hence may be used to mimic the MABP increases in response to electrostimulation.
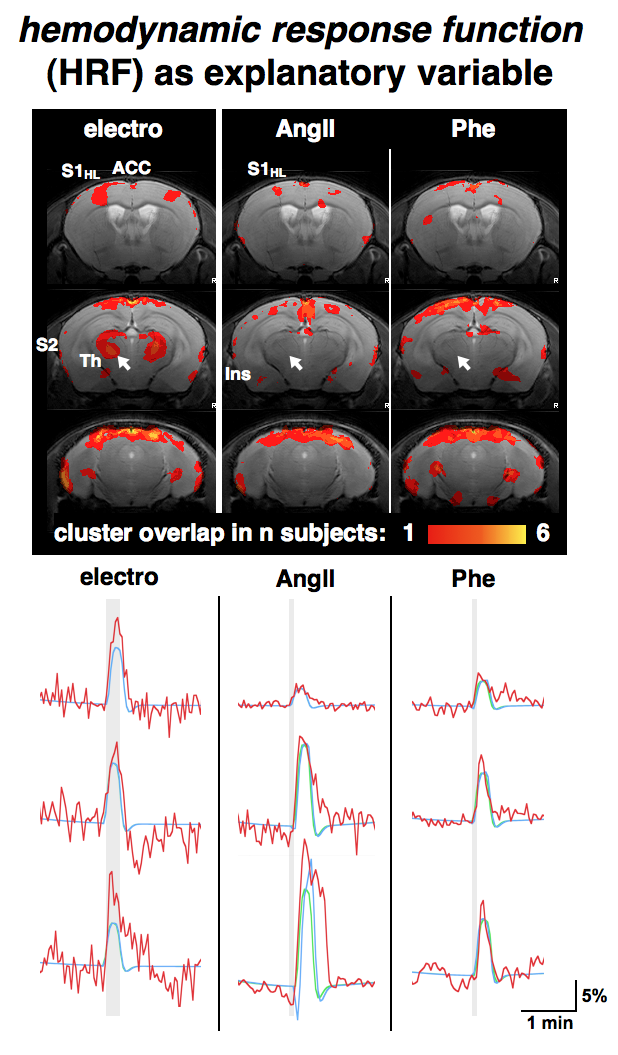
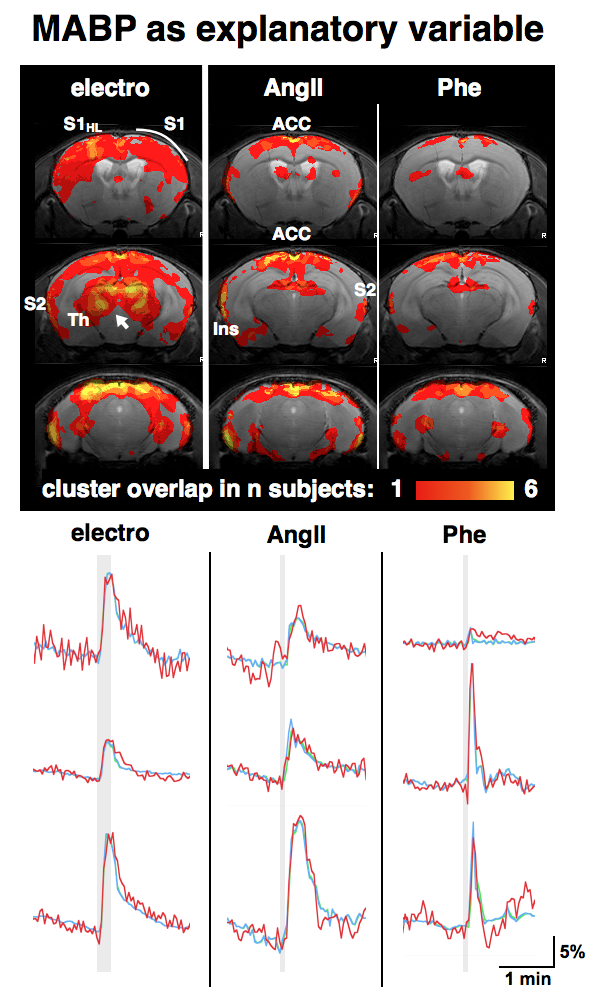
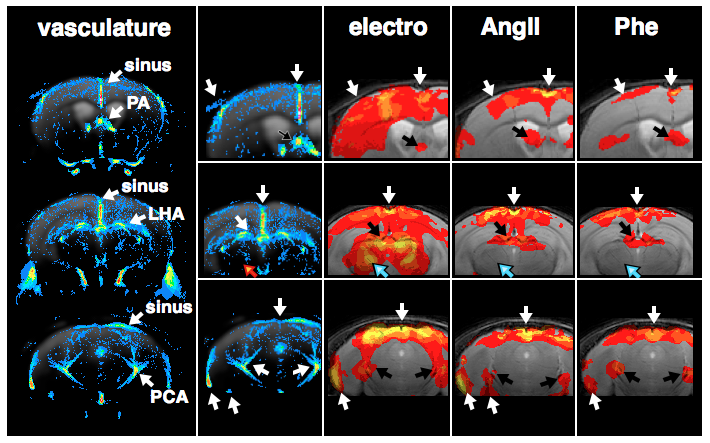
GLM-based fMRI analyses were performed assuming either the hemodynamic response function (HRF) of the electrostimulation paradigm to be the origin of the BOLD responses (Fig. 3) or assuming the MAPB increases to be the origin of the BOLD responses (Fig. 4). MAPB increases showed large BOLD patterns across the brain, not only for the pharmacological stimulations, but also for electrostimulation. These BOLD patterns included structures of the so-called pain matrix: primary and secondary somatosensory cortex (S1, S2), anterior cingulate cortex (ACC) and insular cortex [7,8]. Some somatosensory key areas (segments of S1 and thalamus) appear to be only or more affected with electrostimulation (Fig. 3 /4, white arrows). The HRF-based analyses produced more distinct BOLD patterns. The thalamus was visible exclusively in the electro-stimulated group, but many brain areas – including the S1 for the hindlimb – were visible also in AngII stimulated mice. Spatial comparison of MAPB explainable BOLD with the cerebral vasculature show that areas prone to BOLD effects are often associated with large arteries and the sigmoid sinus (Fig. 5).
Discussion and Conclusion
Here we show that somatosensory stimuli (even at a low current of 1mA, which is widely considered innoxious) cause remarkable increases in systemic blood pressure in mice, which in turn produces BOLD signals in numerous brain areas, including some of the pain matrix. In these brain areas it is entirely ambiguous if observed BOLD patterns are evoked by somatosensory transduction or MABP alterations. The colocation of BOLD ‘activations’ and larger blood vessels appear to be highly relevant, as these areas were found to be biased by MAPB-induced BOLD. These findings have pronounced implications for fMRI-based pain research in mice, since noxious stimulation inherently causes increases in systemic blood pressure.Acknowledgements
No acknowledgement found.References
1. Schroeter et al. NeuroImage. 2014;94:372-84. 2. Reimann et al. SciRep. 2016;6:17230. 3. Kalisch et al. NeuroImage. 2001;14(4):891-8. 4. Tuor et al. Magn Reson Imaging. 2002;20(10):707-12. 5. Gozzi ez al. Magn Reson Imaging. 2007;25(6):826-33. 6. Jeffrey-Gauthier et al. Pain. 2013;154(8): 1434-41. 7. Legrain et al. Prog Neurobiol. 2011;93(1):111-24. 8. Mouraux et al. NeuroImage. 2011;54(3):2237-49.Figures