0586
Simple approach to improve time series fMRI stability: STAbility-weighted Rf-coil Combination (STARC)1NIMH, Bethesda, MD, United States, 2NIMH, United States, 3SFIM, NIMH, Bethesda, MD, United States
Synopsis
Advanced EPI -especially at high resolutions- is often limited by signal instabilities arising from a variety of unwanted artifacts. These include: GRAPPA ghosts interference, Nyquist ghosts, phase offset interference patterns, and fat rings. The sources of these artifacts are all somewhat locally confined and are often differently pronounced in different elements of multi coil arrays. Here we propose a simple approach of STAbility-weighted Rf-coil Combination (STARC) that reduces the likelihood of those artifacts. It increases tSNR and fMRI sensitivity up to 50% without a loss in quantifiability, without loss in temporal resolution, and without loss in spatial resolution.
Purpose
Most MRI data are acquired with RF-coil arrays of approx. 12-64 elements. To obtain optimal image quality and highest image SNR at in the final combined image, the signal from individual channels are combined with weighting factors derived from their local signal strengths. The most common approach is based on using the signal magnitude itself as a weighting factor in the so-called Sum-of-Squares (SOS) combination method. This algorithm is a good choice to optimize SNR in anatomical sequences. In functional MRI time series, however, we would benefit more from optimized temporal stability (tSNR), rather than image SNR only. In this study, we sought to develop and evaluate a new, simple, and straight-forward coil combination scheme that adapts local weighting factors not only based on the signal itself, but also based on the signal stability across time. We call it STAbility-weighted Rf-coil Combination (STARC).
Methods
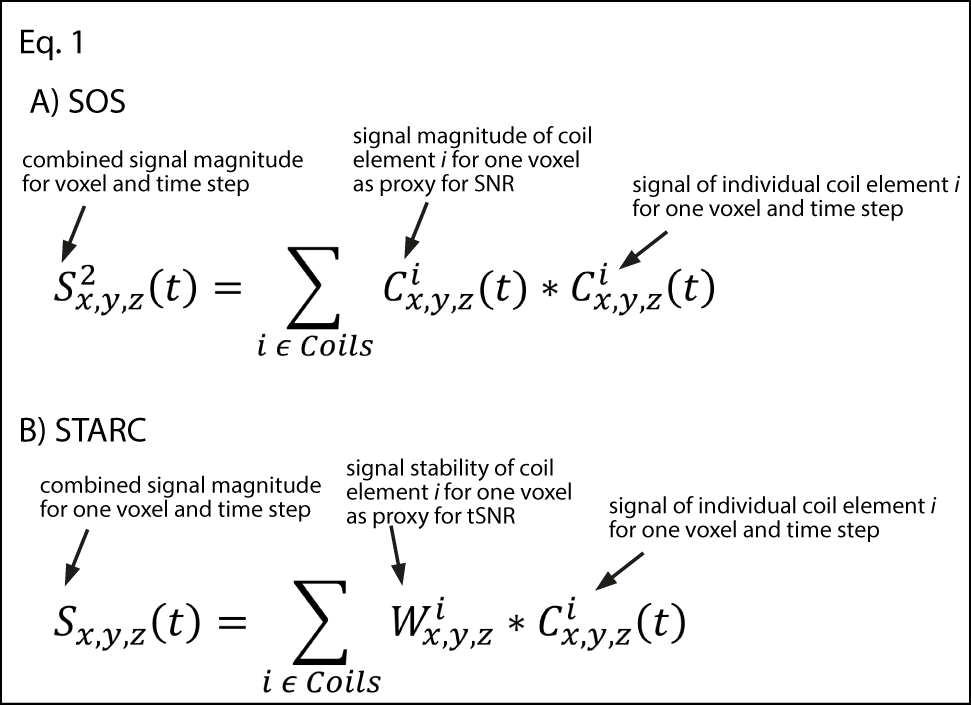
Experiments were performed on a 7T Siemens scanner with a 32-channel NOVA head-coil. Functional EPI data were acquired from N=4 participants with 1.1 mm isotropic voxels, TE=26 ms, TR=1.5 s, GRAPPA=2 based on FLASH ACS data [1]. A 12-min finger-tapping paradigm was used to investigate, whether the quantitative signal changes are conserved across the different coil combination schemes. Data from individual channels were saved uncombined and exported for offline analysis. Signal from individual channels were combined on a voxel-by-voxel basis with two different sets of weighting factors: A) using the signal itself as a weighting factor, which corresponds to the commonly applied SOS as implemented by the vendor, and B) using the relative local stability over time as a weighting factor (STARC). To account for noise coupling between elements, we also use the inverse of the coil cross-correlation matrix [2] as global element-specific FFT-scale factors, as it is routinely done in the vendors’ reconstruction pipeline. Mathematical descriptions of the different combination schemes are depicted in Fig. 1.Results
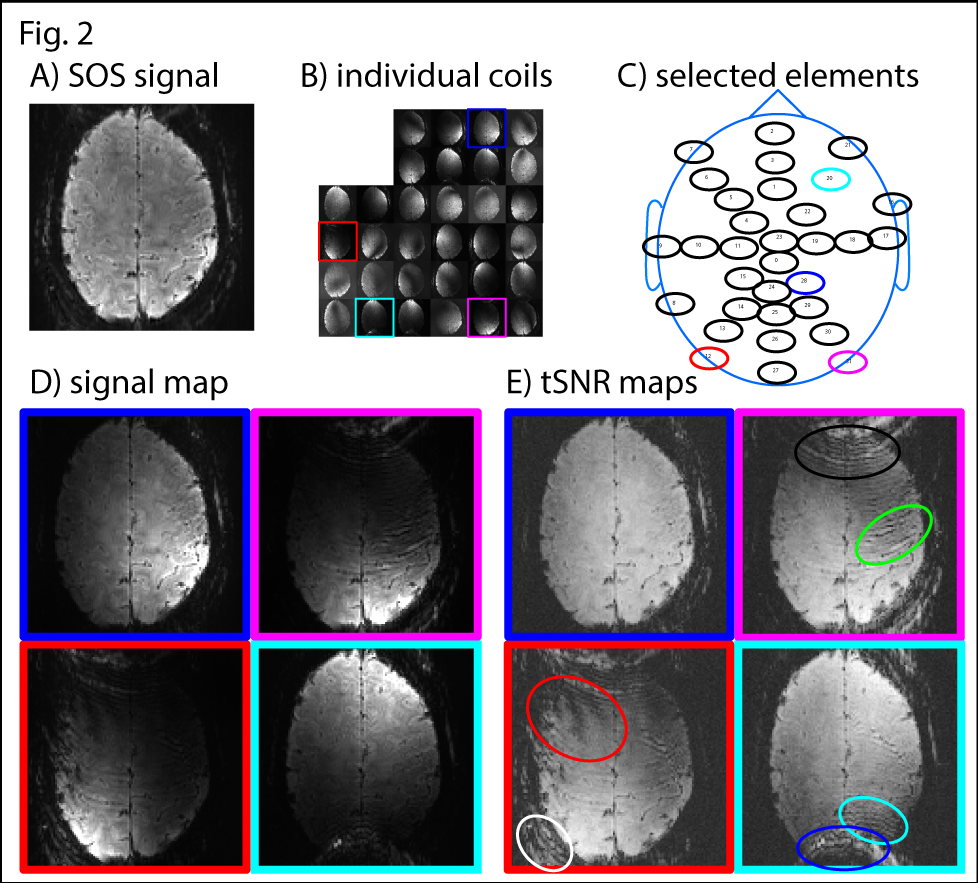
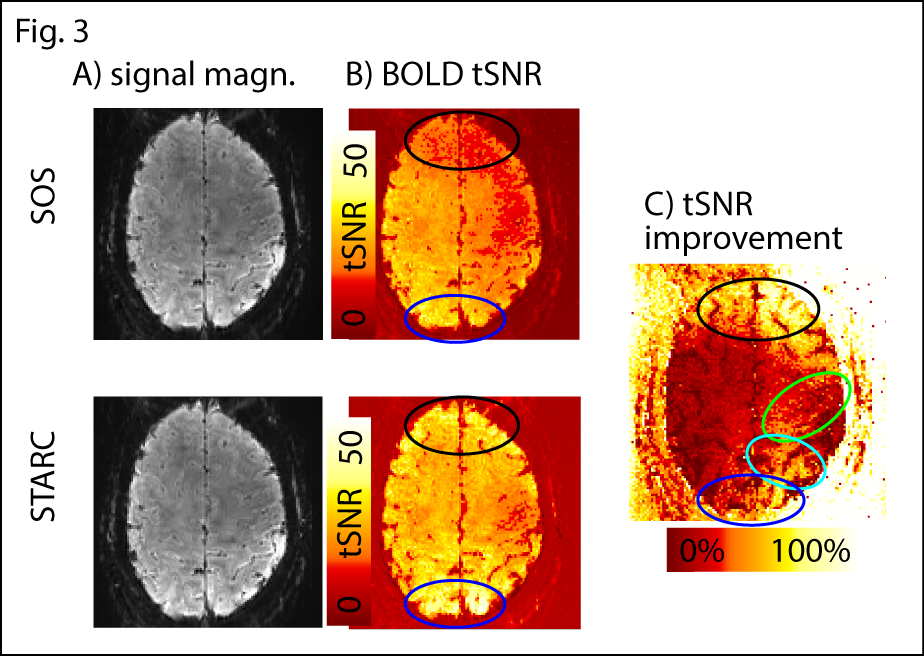
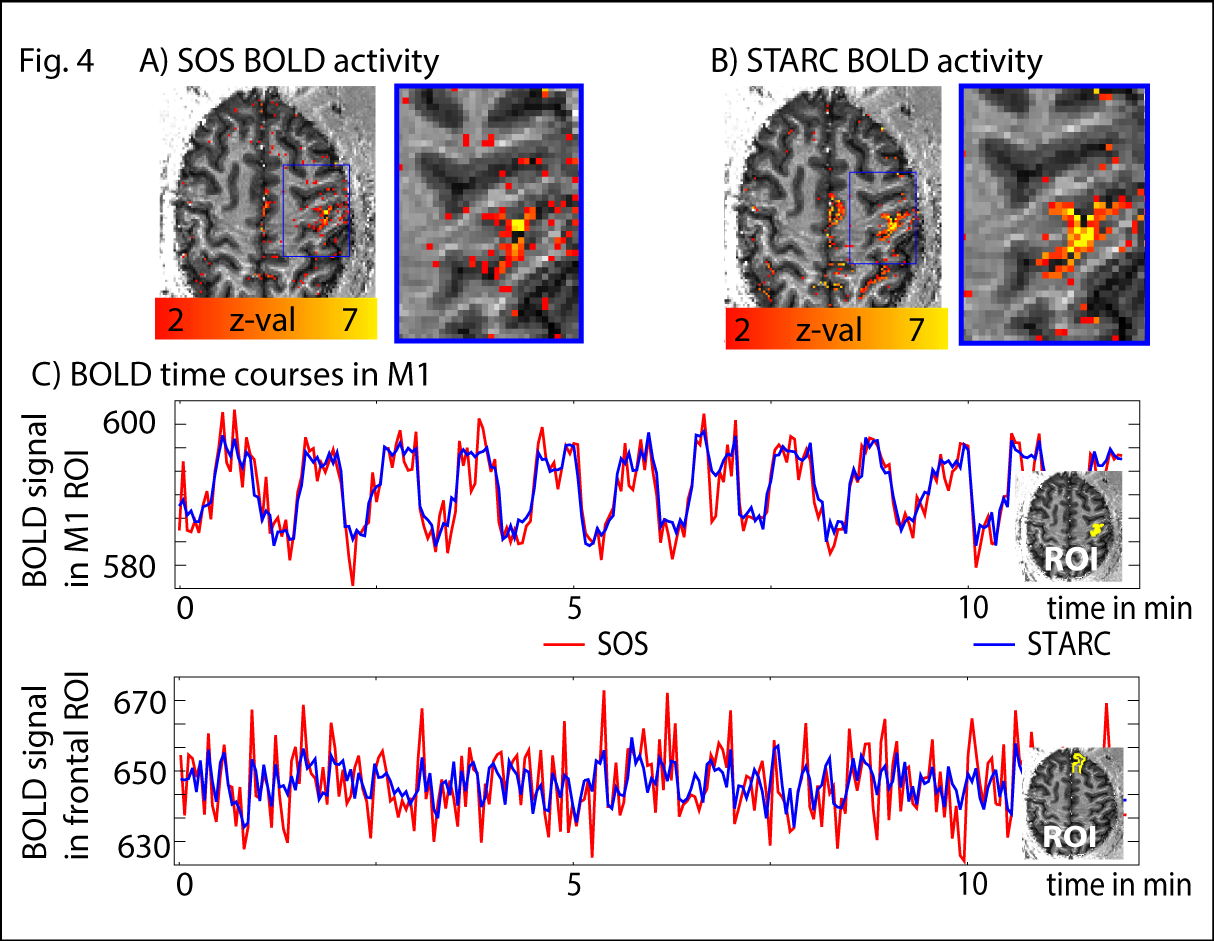
It can be seen in Fig. 2 that conventional EPI images (SOS) appear relatively artifact-free. They are, however, a result of multiple elements (Fig. 2B-C). These individual elements might be relatively noisy, they might be dominated by unwanted fat signal, and they might be limited by GRAPPA and phase interference artifacts (Fig. 2D-E). These interference artifacts are not only problematic because they deviate the signal intensity with the approx. magnitude of 1/32 (3%). It is even more problematic that these patterns are not stable in time. For instance, when small field shifts (from respiration/motion/scanner instability) are present, the artifact signal can result in constructive and destructive signal summation, in such a way that interference pattern variations introduce signal instability in the range of approx. +/- 3%. These instabilities are mostly confined to individual elements and do not expand beyond local areas (Fig. 2E). Hence, their influence on the final combined signal image is not visible with the naked eye. However, they can contribute significantly to the time series instability and should be corrected for. Fig. 3 depicts how STARC can improve the overall temporal stability of the fMRI signal. This results in high tSNR values especially in areas of strong artifacts (blue, turquoise, green, and black ellipses in Figs. 2E and 3C). Consequently, the statistical activity values during a finger tapping experiments are improved form z = 4.6 +/- 2.2 to z = 6.8 +/- 3.4.Discussion
Since the new STARC method is only changing the relative weighting of the coil elements, it does not affect the quantitative signal distribution across space and time. Correspondingly, the quantitative signal distribution across voxels (Fig. 3A) and across time (Fig. 4C) is nearly unaffected by the new combination scheme. The only small visible difference is that the noise contribution is reduced (Fig. 4C). One limiting factor of the STARC method is that the data management of 32 individual signals is more cumbersome and the evaluation requires more computation time.Conclusion
We developed and discussed a new simple coil combination scheme that uses the signal stability of the individual coils as weighting factors when combining them. We believe that the new STARC combination scheme can play an important role to improve functional stability of EPI time series, especially in accelerated (GRAPPA) and high resolution imaging environments, where image artifacts and phase inconsistencies can be a limiting factor.Acknowledgements
The research was supported by the NIMH Intramural Research Program (#ZIA-MH002783).References
[1] Talagala et al., MRM, 2015, 75:2362-2371.
[2] Roemer et al., MRM, 1990, 16:192-225.
Figures