0581
The effect of motion and nuisance regression on resting-state fMRI using highly accelerated SMS- or 3D-EPI1MR Physics, DZNE (Bonn), Bonn, Germany, 2Population Health Sciences, DZNE (Bonn), Bonn, Germany, 3Department of Physics and Astronomy, University of Bonn, Bonn, Germany
Synopsis
We compare the effects of motion and nuisance regression on highly accelerated resting-state fMRI of 10 subjects scanned at 3T using state-of-the-art simultaneous multi-slice EPI and segmented 3D-EPI with controlled aliasing. While both TR-matched protocols are per design fast enough to separate the cardiac frequency peak from BOLD signal, gray matter signal-to-noise ratio with the 3D-EPI protocol improves almost twice as much as compared to the SMS-EPI protocol. Template based rotation functional connectivity analysis on average shows greater statistical loadings for several known networks when using cleaned 3D-EPI data than when using cleaned SMS-EPI data.
Target Audience
Researchers with an interest in highly accelerated, state-of-the-art functional MRI.Purpose
To compare the effect of motion and nuisance regression on resting-state fMRI at 3T using highly accelerated, repetition time-matched simultaneous-multi-slice and segmented 3D-EPI.Introduction
Recent advances in the acceleration of 2D- and 3D-EPI1 allow for whole-brain fMRI at rates fast enough to separate dominant physiological frequencies (~0.2-1.4Hz) from BOLD frequencies (~0-0.2Hz) with higher spatial resolution than 3mm isotropic2. While nuisance regression has been shown to improve non-accelerated 3D-EPI more than 2D-EPI with respect to temporal signal-to-noise ratio (tSNR) and BOLD sensitivity3, little is yet known on the effect on such highly accelerated 3D-EPI versus simultaneous multi-slice (SMS) EPI.Methods
State-of-the-art blipped-CAIPI SMS-EPI4,5 and segmented 3D-EPI with 2D-CAIPIRINHA6 undersampling7,8 have been applied to acquire ten minutes resting-state fMRI data at 3T (Siemens MAGNETOM Prisma, 64-channel head coil). Both sequences were accelerated so as to achieve a TR of only 530ms (Nyquist frequency = 0.94Hz) for whole-brain coverage at 2.4mm isotropic resolution. With otherwise matched parameters SMS-EPI required a multiband-factor of 8 (7 slice stack excitations/TR) while 3D-EPI required only 6-fold k-space undersampling (10 slab excitations/TR) thanks to two speed-up methods only available to 3D-EPI: semi-elliptical sampling (skip late EPI-echoes beyond the k-space ellipse that defines the nominal resolution)9 and time-efficient, low flip-angle binomial-11 water excitation10 combined with initial fat-selective inversion (spectral attenuated inversion recovery).
Ten subjects (5f, 24±3y) have been scanned using both sequences in a counterbalanced order across subjects. Cardiac and respiratory signals have been recorded using an MR compatible pulse oximeter and respiration belt for optional nuisance regression according to RETROICOR11 and RVHRCOR12 (k-space center acquisition times as supporting points for 3D-EPI3). Functional MRI pre-processing consisted of: 1.) removal of initial 10s of data, 2.) motion correction to the first retained volume, 3.) signal detrending using Butterworth high-pass filtering (0.01Hz), 4.) optional motion and nuisance GLM regression, 5.) computation of tSNR and mean whole-brain power spectrum density (PSD), 6.) MNI normalization of pre-processed time-series and tSNR maps. Finally, functional connectivity was estimated utilizing a template based rotation (TBR) method13. The 24 motion regressors used in step 4 were formed by the six motion parameters from step 2, their derivatives, and the square of these twelve regressors14. In addition to the 14 RETROICOR and RVHRCOR regressors three tissue-based regressors were extracted as the mean from eroded WM, CSF and whole brain atlas-based masks back-transformed to individual fMRI space, yielding 17 nuisance regressors in total. As recommended in Ref. 15 the high-pass filter used for detrending was applied to the regressors prior to GLM fitting.
Results
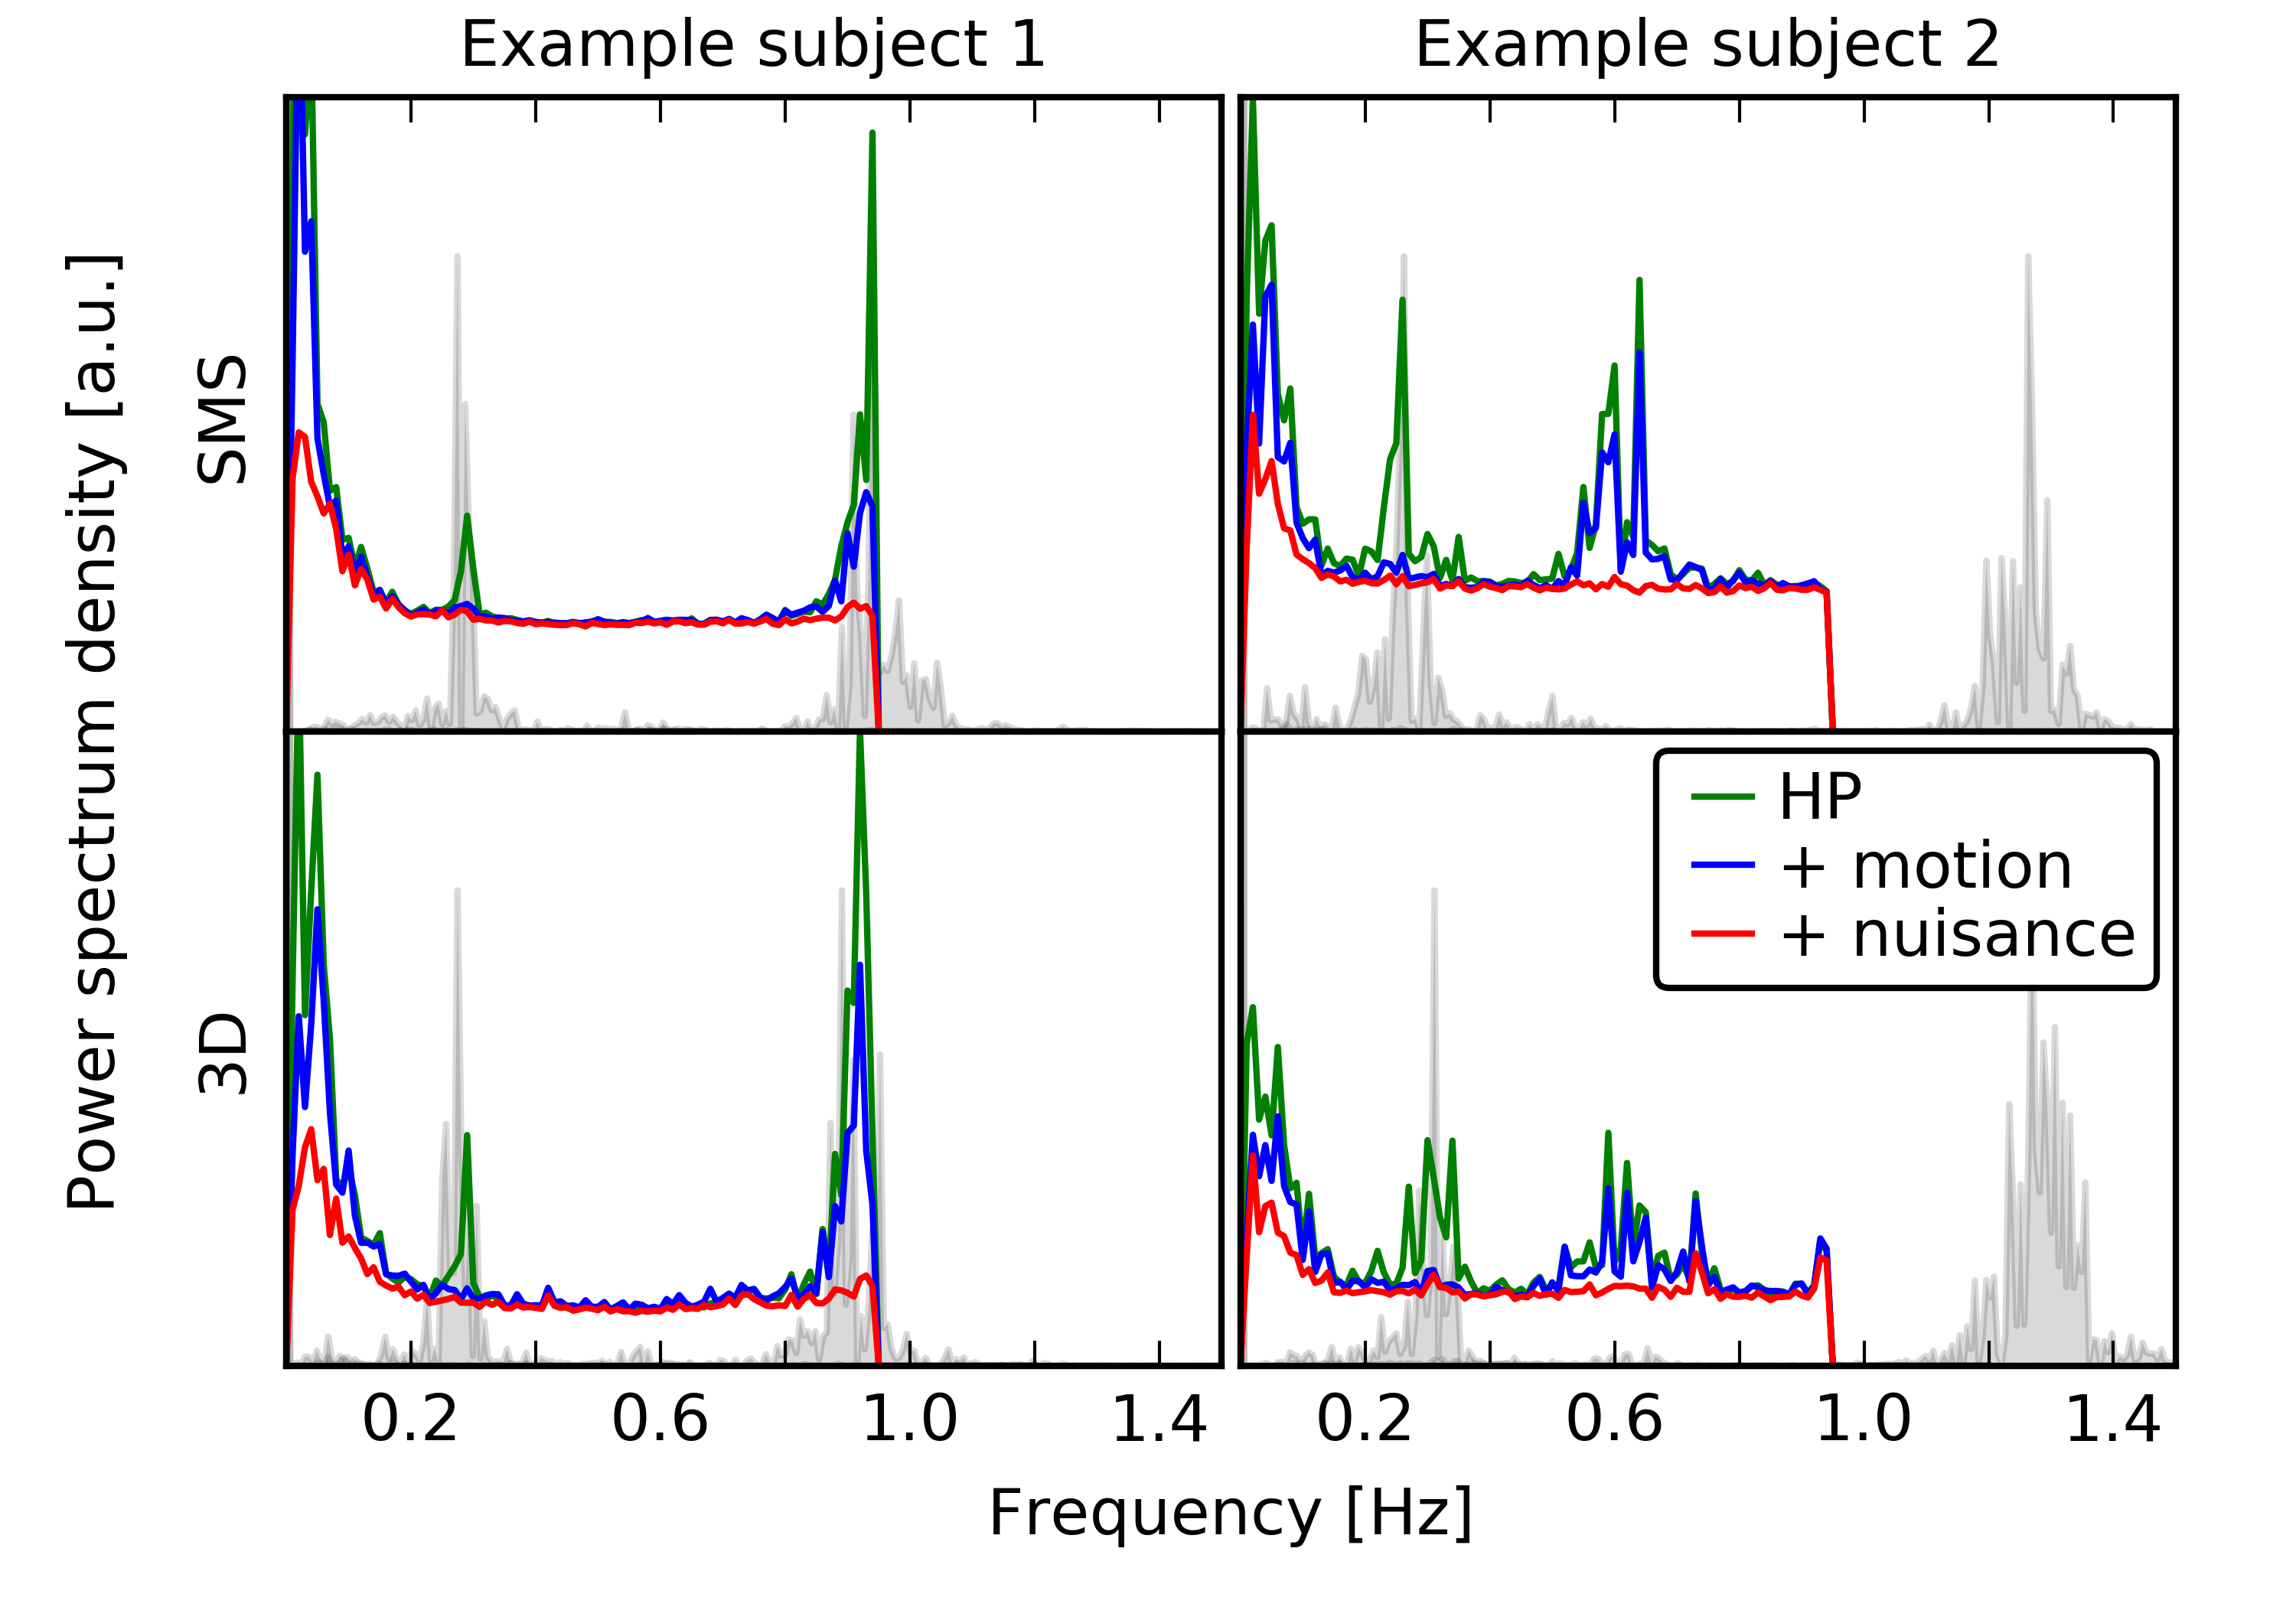
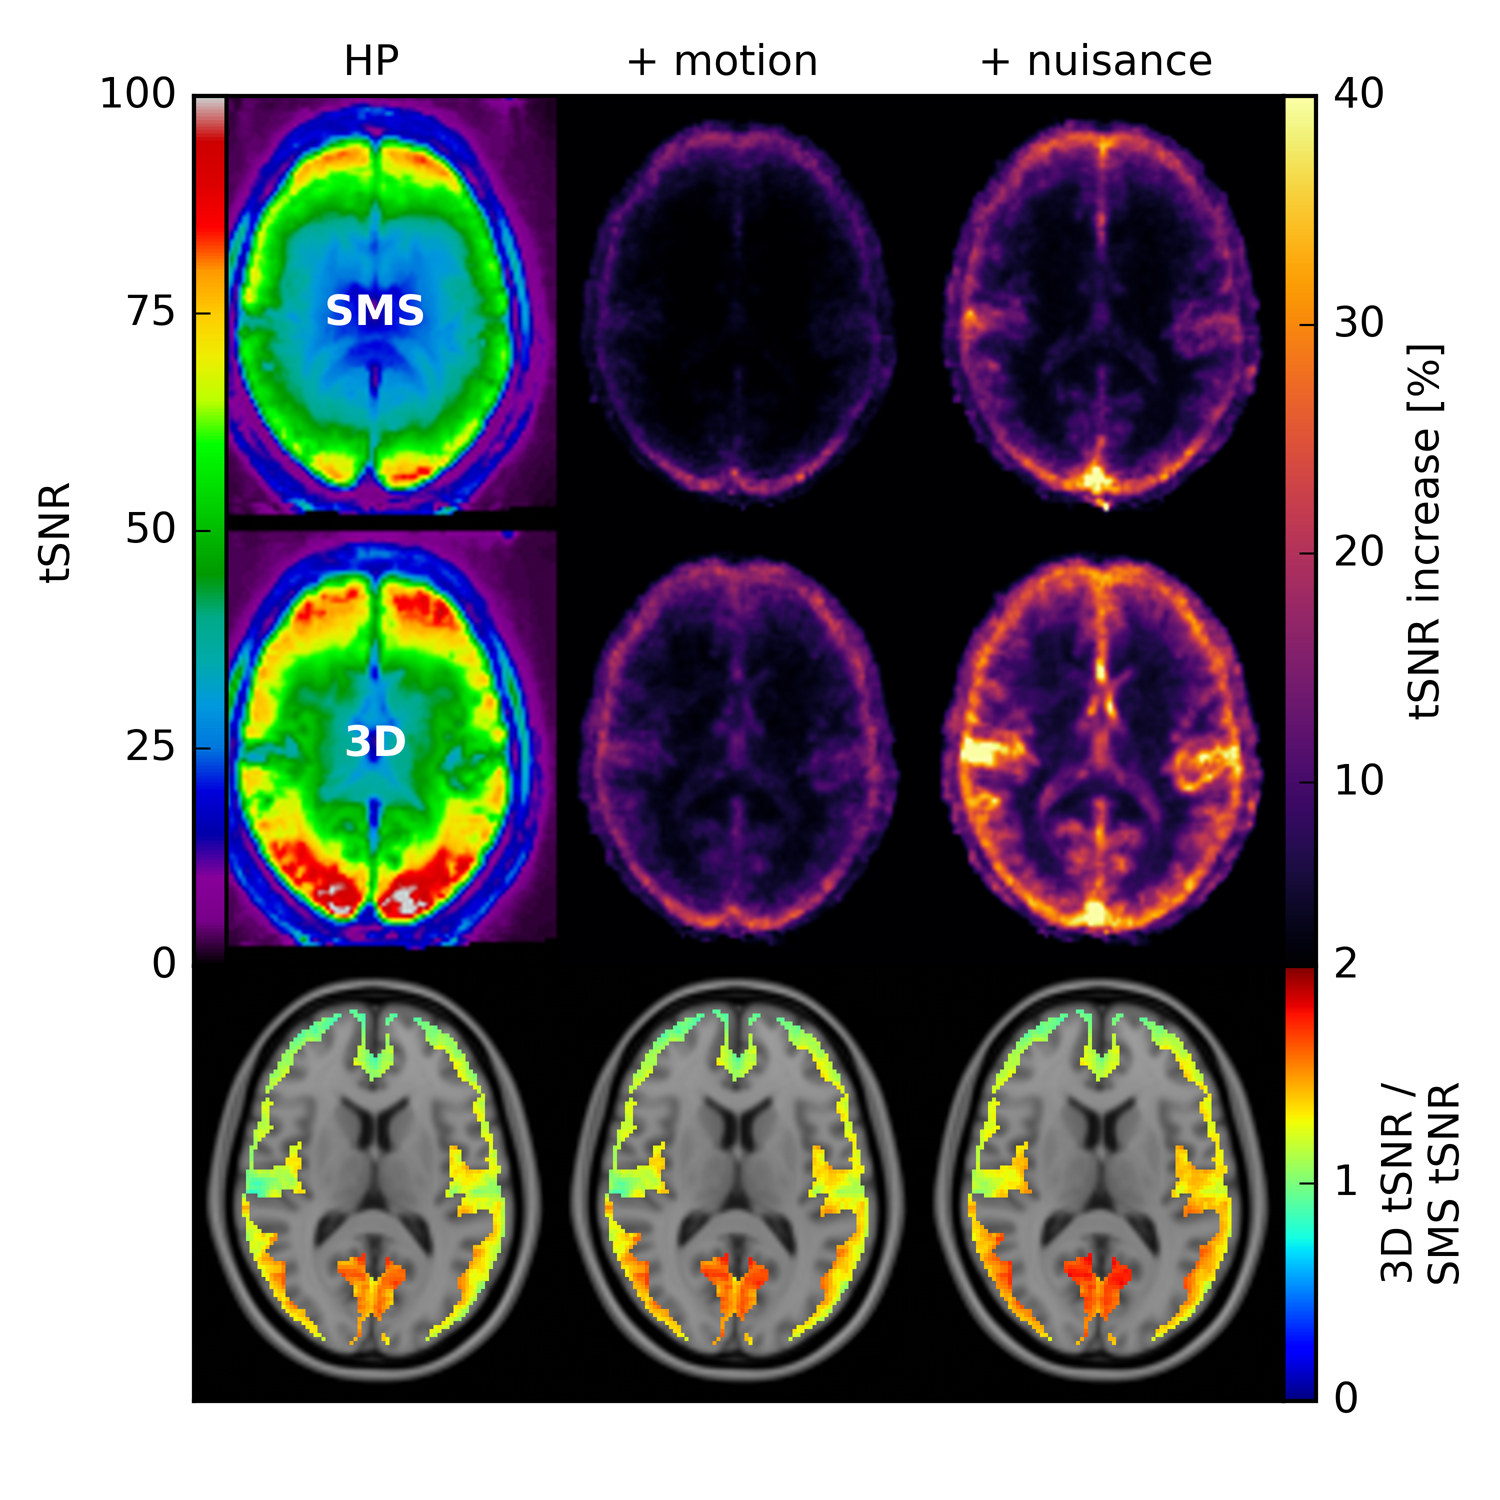
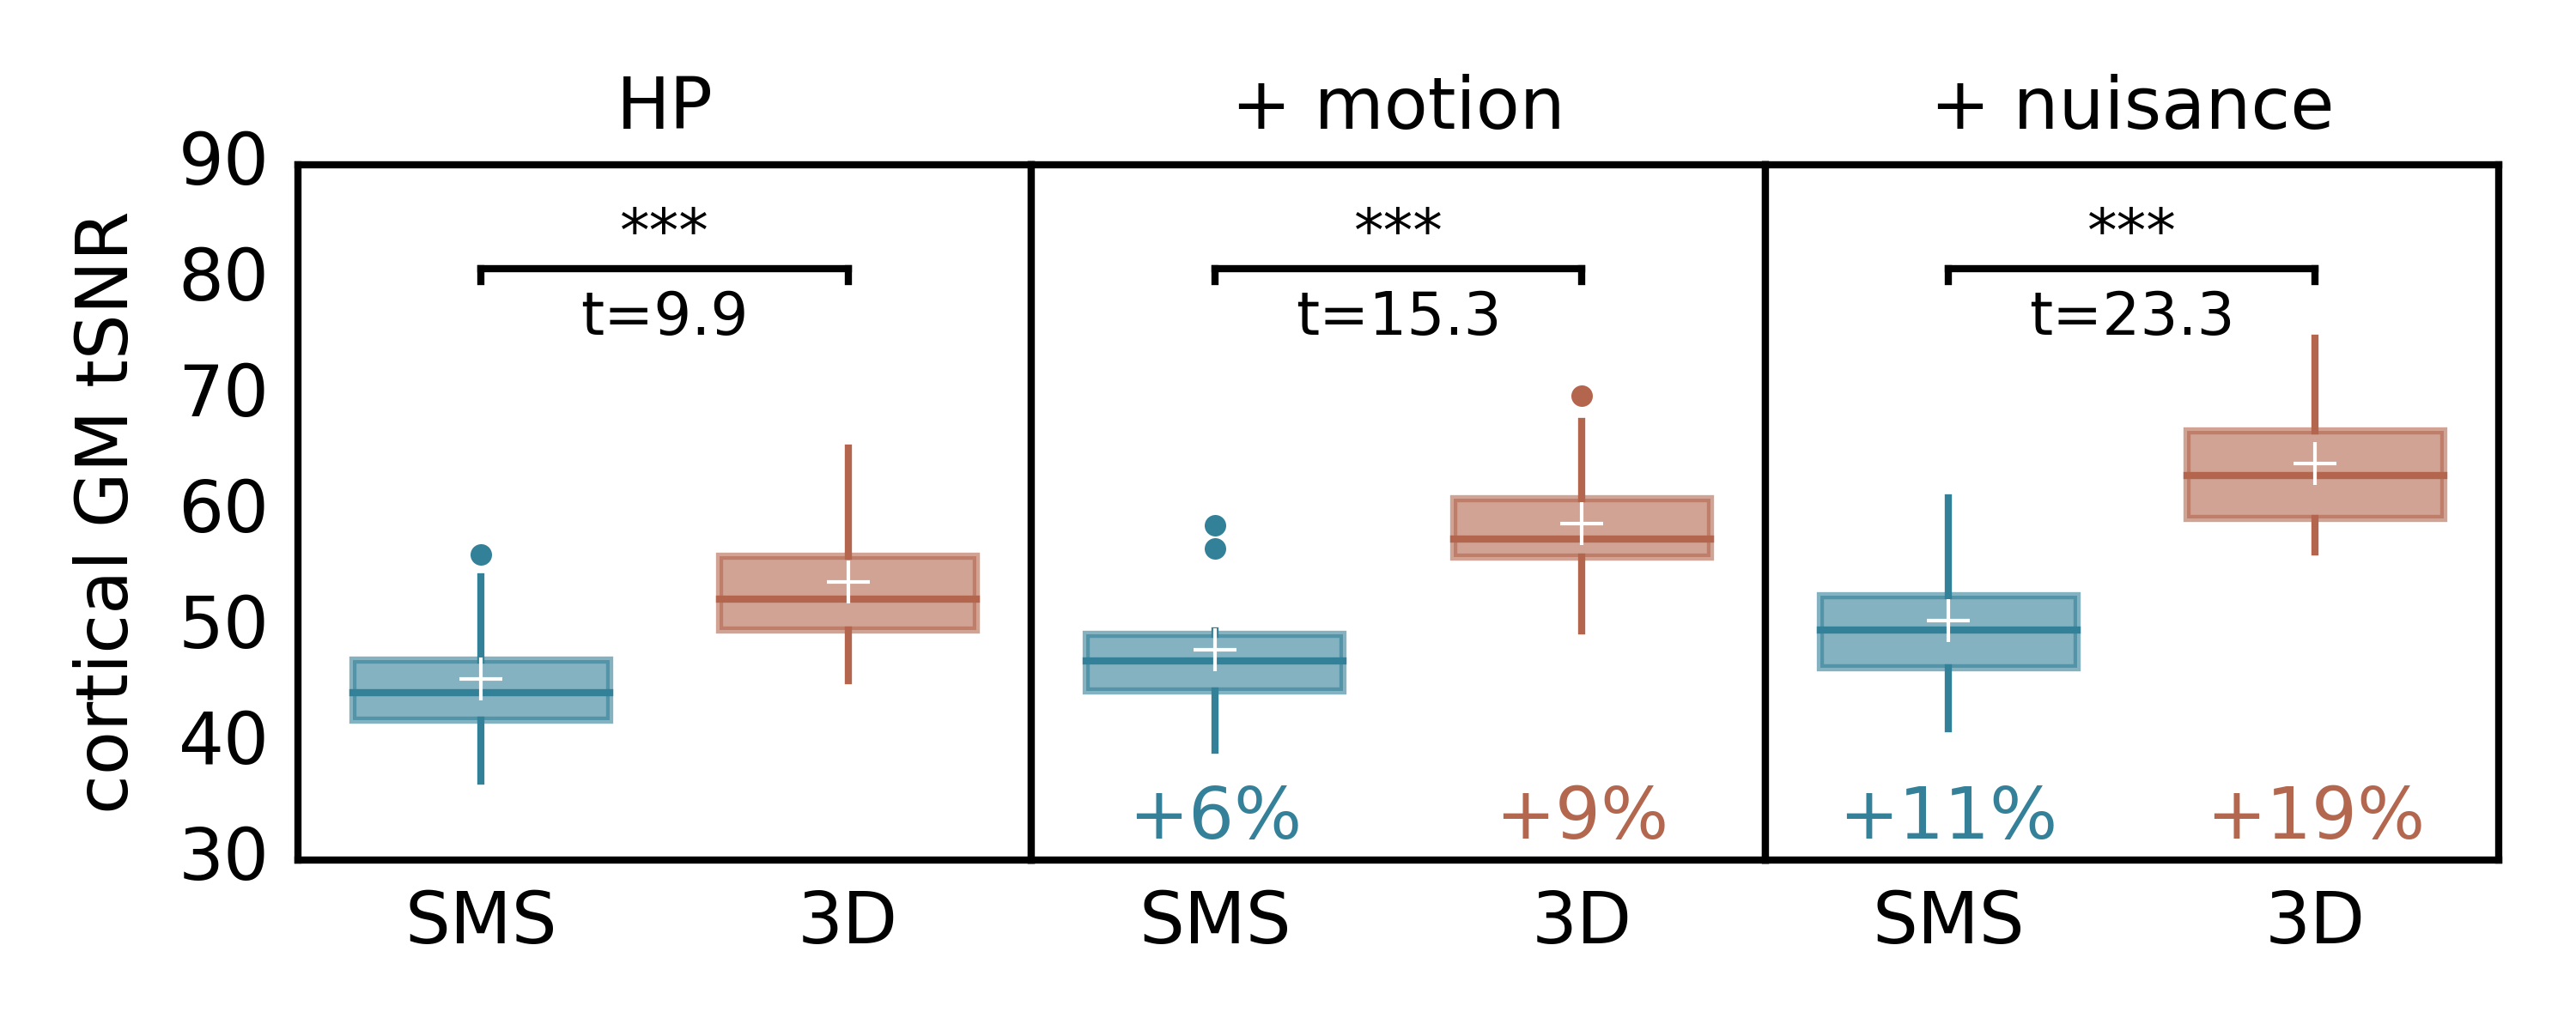
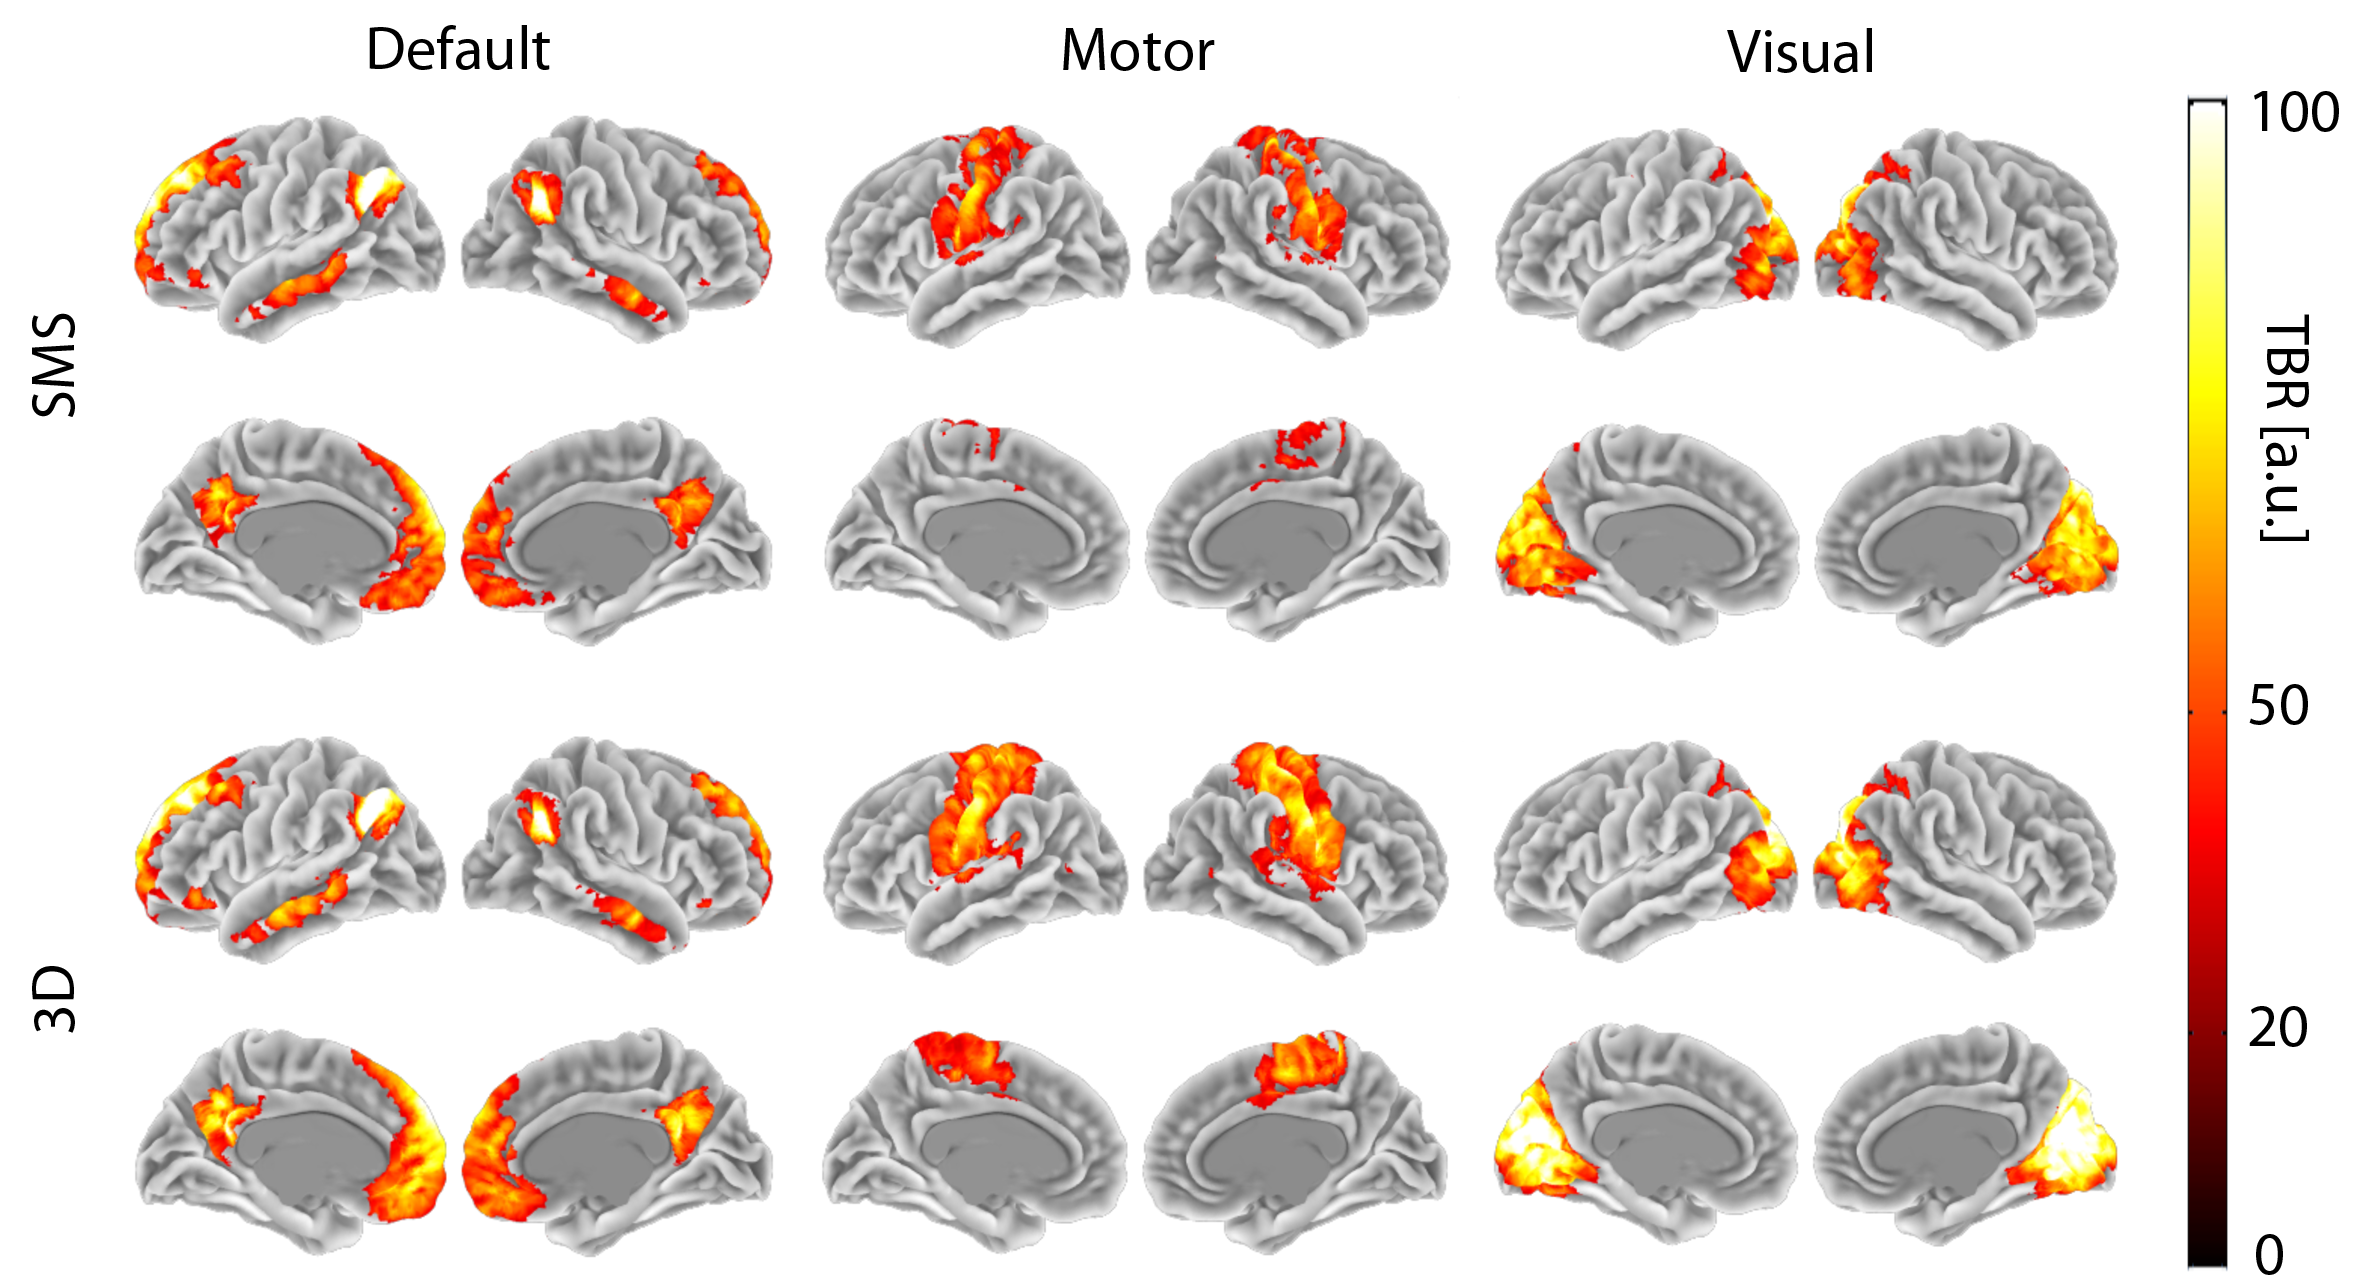
The PSDs plotted in Fig. 1 show that, thanks to a Nyquist frequency of 0.94Hz, even the relatively high heart rate of example subject 2 (~1.3Hz) does not lead to an overlap of the aliased cardiac peak with the BOLD frequency range (a lower Nyquist frequency according to TR~0.7s would shift the alias to ~0.1Hz). Motion and nuisance regression almost completely remove cardiac and respiratory peaks for SMS- and 3D-EPI. Fig. 2 indicates that major tSNR improvements mainly take place in regions of cortical gray matter and that motion and nuisance regression have a greater impact on 3D-EPI. Fig. 3 confirms that 3D-EPI data benefits almost twice as much from motion and nuisance regression as compared to SMS-EPI. Finally, the functional connectivity results in Fig. 4 show that both sequences robustly identify known cortical networks, however with higher statistical loadings using the 3D-EPI protocol.Discussion
Nuisance regression in addition to motion regression has been shown to improve tSNR of rapid SMS- and 3D-EPI substantially, clearly with larger benefits of 3D-EPI. These findings are in-line with the fact that, despite the highly reduced number of excitation per TR (here: 10 instead of 60), 3D-EPI with 2D-CAPIRINHA sampling still corresponds to a segmented volume acquisition, which is more susceptible to motion and physiological noise than single-shot acquisitions16. Consequently, larger improvements of 3D-EPI by motion and nuisance regression were to be expected. Although not shown here, a reduced set of regressors lead to similar conclusions, though with smaller effect size.Conclusion
The present work shows that highly accelerated whole-brain 3D-EPI at 3T benefits significantly more from motion and nuisance regression than SMS-EPI at identical spatial and temporal resolution. The SNR advantage due to more actually acquired readouts per TR with the proposed 3D-EPI sequence compared to SMS-EPI is hence even more pronounced. As a result, 3D-EPI shows improved sensitivity in resting-state fMRI analysis compared to SMS-EPI. This effect is expected to be even larger at higher field strength17.Acknowledgements
No acknowledgement found.References
1. Poser BA, Koopmans PJ, Witzel T, Wald LL, Barth M. Three dimensional echo-planar imaging at 7 Tesla. Neuroimage 2010;51:261–266.
2. Stirnberg R, Huijbers W, Poser BA, Stöcker T. Ultra-fast gradient echo EPI with controlled aliasing at 3T: simultaneous multi-slice vs. 3D-EPI. In: Proc. Intl. Soc. Mag. Reson. Med. 24; 2016.
3. Lutti A, Thomas DL, Hutton C, Weiskopf N. High-resolution functional MRI at 3 T: 3D/2D echo-planar imaging with optimized physiological noise correction. Magn. Reson. Med. 2013;69:1657–64.
4. Setsompop K, Gagoski B a, Polimeni JR, Witzel T, Wedeen VJ, Wald LL. Blipped-controlled aliasing in parallel imaging for simultaneous multislice echo planar imaging with reduced g-factor penalty. Magn. Reson. Med. 2012;67:1210–24.
5. Xu J, Moeller S, Auerbach EJ, Strupp J, Smith SM, Feinberg DA, Yacoub E, Ugurbil K. Evaluation of slice accelerations using multiband echo planar imaging at 3T. Neuroimage 2013;83:991–1001.
6. Breuer FA, Blaimer M, Mueller MF, Seiberlich N, Heidemann RM, Griswold M a, Jakob PM. Controlled aliasing in volumetric parallel imaging (2D CAIPIRINHA). Magn. Reson. Med. 2006;55:549–556.
7. Narsude M, Marques JP, Gallichan D, Gruetter R. Superior GRAPPA reconstruction with reduced g-factor noise using 2D CAIPIRINHA for 3D EPI. In: Proc. Intl. Soc. Mag. Reson. Med. 21. Vol. 21. ; 2013. p. 3705.
8. Zahneisen B, Ernst T, Poser BA. SENSE and simultaneous multislice imaging. Magn. Reson. Med. 2015;74:1356–1362.
9. Stirnberg R, Brenner D, Stöcker T. Variable Flip Angles and Echo Train Lengths in Segmented 3D-EPI at 3 and 7 Tesla. In: Proc. Intl. Soc. Mag. Reson. Med. 22; 2014. p. 609.
10. Hore P. Solvent suppression in fourier transform nuclear magnetic resonance. J. Magn. Reson. 1983;55:283–300.
11. Glover GH, Li TQ, Ress D. Image-based method for retrospective correction of physiological motion effects in fMRI: RETROICOR. Magn. Reson. Med. 2000;44:162–7.
12. Chang C, Cunningham JP, Glover GH. Influence of heart rate on the BOLD signal: the cardiac response function. Neuroimage 2009;44:857–69.
13. Schultz AP, Chhatwal JP, Huijbers W, Hedden T, van Dijk KRA, McLaren DG, Ward AM, Wigman S, Sperling RA. Template based rotation: A method for functional connectivity analysis with a priori templates. Neuroimage 2014;102:620–636.
14. Power JD, Mitra A, Laumann TO, Snyder AZ, Schlaggar BL, Petersen SE. Methods to detect, characterize, and remove motion artifact in resting state fMRI. Neuroimage 2014;84:320–341.
15. Hallquist MN, Hwang K, Luna B. The nuisance of nuisance regression: Spectral misspecification in a common approach to resting-state fMRI preprocessing reintroduces noise and obscures functional connectivity. Neuroimage 2013;82:208–225.
16. Zwaag W van der, Marques JP, Kober T, Glover G, Gruetter R, Krueger G. Temporal SNR characteristics in segmented 3D-EPI at 7T. Magn. Reson. Med. 2012;67:344–52.
17. Hutton C, Josephs O, Stadler J, Featherstone E, Reid a, Speck O, Bernarding J, Weiskopf N. The impact of physiological noise correction on fMRI at 7 T. Neuroimage 2011;57:101–12.
Figures