0575
Geometric Distortion Correction of Diffusion-Weighted MRI and its Effect on quantitative ADC analysis1Department of Circulation and Medical Imaging, NTNU, Norwegian University of Science and Technology, Trondheim, Norway, 2St. Olavs Hospital,Trondheim University Hospital, Trondheim, Norway, 3Department of Radiology, University of California San Diego, CA, United States
Synopsis
Tissue water diffusion (ADC) quantification through diffusion-weighted imaging (DWI) currently plays an integral clinical role in prostate cancer. The echo-planar imaging technique employed in DWI is however prone to geometric distortion due to static magnetic field (B0) inhomogeneity. We investigated the effect of the correction of this distortion on the quantification of ADC values in the prostate. Our study showed that there is a significant association between the amount of distortion (mm) and the difference between ADC values before and after correction, which implies that correction for this could be necessary, especially for voxel-based quantitative analysis.
Introduction
The
apparent diffusion coefficient (ADC) is a quantitative measure of water
diffusion in tissue that has proven useful for prostate cancer diagnosis 1–3 and evaluation of treatment response.4,5 Echo-planar imaging is ideally used for
diffusion-weighted imaging (DWI) because of its speed and robustness against
motion artifacts.6 The sequence is however prone to geometric
distortion due to static magnetic field (B0) inhomogeneity induced by local susceptibility
fluctuations. These distortion artefacts are particularly pronounced in the
phase encoding direction and at the interface between tissues with different
magnetic susceptibilities,7,8 and could potentially affect the quantitative
integrity of the DWI data. 9 The aim of this study was to investigate the effect
of distortion correction on the quantification of ADC values in the prostate,
using a previously published distortion correction method.9,10 Materials and Methods
As part of an overarching PET/MRI study, 3T multi-parametric MR imaging (Biograph mMR; Siemens, Erlangen, Germany) was performed on 28 biopsy-confirmed high-risk prostate cancer patients (Gleason score ≥ 7 and/or PSA > 20 and/or clinical stage ≥ cT3) prior to radical prostatectomy. The DWI was acquired in left-to-right phase encoding direction, but included an extra b=0 s/mm2 image in the reverse (right-to-left) phase encoding direction, solely for distortion correction purposes (acquisition details in Table 1).
The preprocessing algorithm for distortion correction proposed by Holland et al 10 was applied to the DW image data. Briefly, the symmetry of B0 inhomogeniety induced distortions in the forward (Figure 1A) and reverse (Figure 1B) phase encoding directions were used to iteratively calculate a deformation field map, which was subsequently employed to correct for distortion in the complete DWI data set acquired in the forward direction (Figure 1C).
Whole prostate and tumor volumes-of-interest (VOIs) were delineated on the T2W images (Figure 1D) by spatial matching to whole-mount prostatectomy histology slides using anatomical landmarks, and then transformed to the respective DW via registration.11 ADC maps (Figures 1E and 1F) and distortion distance per voxel were computed from the uncorrected and corrected DWI data sets. For each tumor, the effect of distortion on ADC was investigated on the lesion level by calculating the difference in mean ADC as $$$ \it abs\left(mean\left(uncorrected ADC\right)-mean\left(corrected ADC\right)\right)$$$ and on the voxel level by calculating the mean difference in ADC as $$$\it mean\left(abs\left(uncorrected ADC-corrected ADC\right)\right).$$$ Linear-mixed models were used for statistical analysis. Matlab R2016a programming environment (The Mathworks, Natick, MA, USA) was used to perform all data computations and analysis.
Results
A total of 40 clinically significant tumor volumes (mean volume = 5.8 cm3; range = 0.56–31.9 cm3) were annotated. Thirty-four (85%) of the tumors were located in the peripheral zone (PZ). An overview of the induced distortion and the resulting differences in mean ADC are given in Table 2.
On both lesion-wise (Figure 2A) and voxel-wise (Figure 2B) analysis, the amount of distortion had significant effect on the difference in ADC (p = 0.0002 and p < 0.0001, respectively), but the effect was more pronounced on the voxel level. In the 6/40 tumors (from 3/28 patients) with mean distortion distance greater than 1 pixel (~2.5 mm), the median (range) difference in ADC was 58 mm2/s (4–330 mm2/s) [or 5% (0–23%)] and 144 mm2/s (126–337 mm2/s) [or 15% (11–24%)] on the lesion and voxel level, respectively.
Discussion
ADC is an important quantitative parameter for diagnosis and treatment evaluation in prostate cancer.1–5 Quantification errors due to field inhomogeneity-induced distortion at data acquisition could therefore affect clinical decision making. This study shows that the difference between ADC values before and after correction are significantly associated with the extent of distortion, which implies that correction for this effect is necessary, especially if a quantitative analysis on the voxel level is pursued. Although routine clinical DWI with EPI lacks correction measures for distortion, the acquisition of an extra b0 image in reverse phase encoding direction (~60 s) could enable correction of this effect.Conclusion
Correction for geometric distortion of diffusion-weighted imaging could be necessary for quantitative ADC analysis of the prostate, and has the potential to further enhance its role in clinical practice.Acknowledgements
No acknowledgement found.References
1. Boesen L, Chabanova E, Løgager V, Balslev I, Thomsen HS. Apparent diffusion coefficient ratio correlates significantly with prostate cancer gleason score at final pathology. J Magn Reson Imaging. 2014:1-8. doi:10.1002/jmri.24801.
2. Verma S, Rajesh A, Morales H, et al. Assessment of aggressiveness of prostate cancer: Correlation of apparent diffusion coefficient with histologic grade after radical prostatectomy. Am J Roentgenol. 2011;196(2):374-381. doi:10.2214/AJR.10.4441.
3. deSouza NM, Reinsberg SA, Scurr ED, Brewster JM, Payne GS. Magnetic resonance imaging in prostate cancer: The value of apparent diffusion coefficients for identifying malignant nodules. Br J Radiol. 2007;80(950):90-95. doi:10.1259/bjr/24232319.
4. Morgan V, Riches S, Thomas K, et al. Diffusion-weighted magnetic resonance imaging for monitoring prostate cancer progression in patients managed by active surveillance. Br J Radiol. 2011;84(997):31-37. doi:10.1259/bjr/14556365.
5. Morgan V a., Riches SF, Giles S, Dearnaley D, deSouza NM. Diffusion-Weighted MRI for Locally Recurrent Prostate Cancer After External Beam Radiotherapy. Am J Roentgenol. 2012;198(3):596-602. doi:10.2214/AJR.11.7162.
6. Poustchi-Amin M, Mirowitz S a, Brown JJ, McKinstry RC, Li T, Technology T. Principles and Applica- tions of Echo-planar Imaging?: A Review for the General Radiologist. Radiographics. 2001;21:767-779. doi:10.1148/radiographics.21.3.g01ma23767.
7. Donato F, Costa DN, Yuan Q, Rofsky NM, Lenkinski RE, Pedrosa I. Geometric Distortion in Diffusion-weighted MR Imaging of the Prostate-Contributing Factors and Strategies for Improvement. Acad Radiol. 2014;21(6):817-823. doi:10.1016/j.acra.2014.02.001.
8. Le Bihan D, Poupon C, Amadon A, Lethimonnier F. Artifacts and pitfalls in diffusion MRI. J Magn Reson Imaging. 2006;24(3):478-488. doi:10.1002/jmri.20683.
9. Rakow-Penner RA, White NS, Margolis DJA, et al. Prostate diffusion imaging with distortion correction. Magn Reson Imaging. 2015;33(9):1178-1181. doi:10.1016/j.mri.2015.07.006.
10. Holland D, Kuperman JM, Dale AM. Efficient correction of inhomogeneous static magnetic field-induced distortion in Echo Planar Imaging. Neuroimage. 2010;50(1):175-183. doi:10.1016/j.neuroimage.2009.11.044.
11. Klein S, Staring M, Murphy K, Viergever MA, Pluim JPW. elastix: a toolbox for intensity-based medical image registration. IEEE Trans Med Imaging. 2010;29(1):196-205. doi:10.1109/TMI.2009.2035616.
Figures
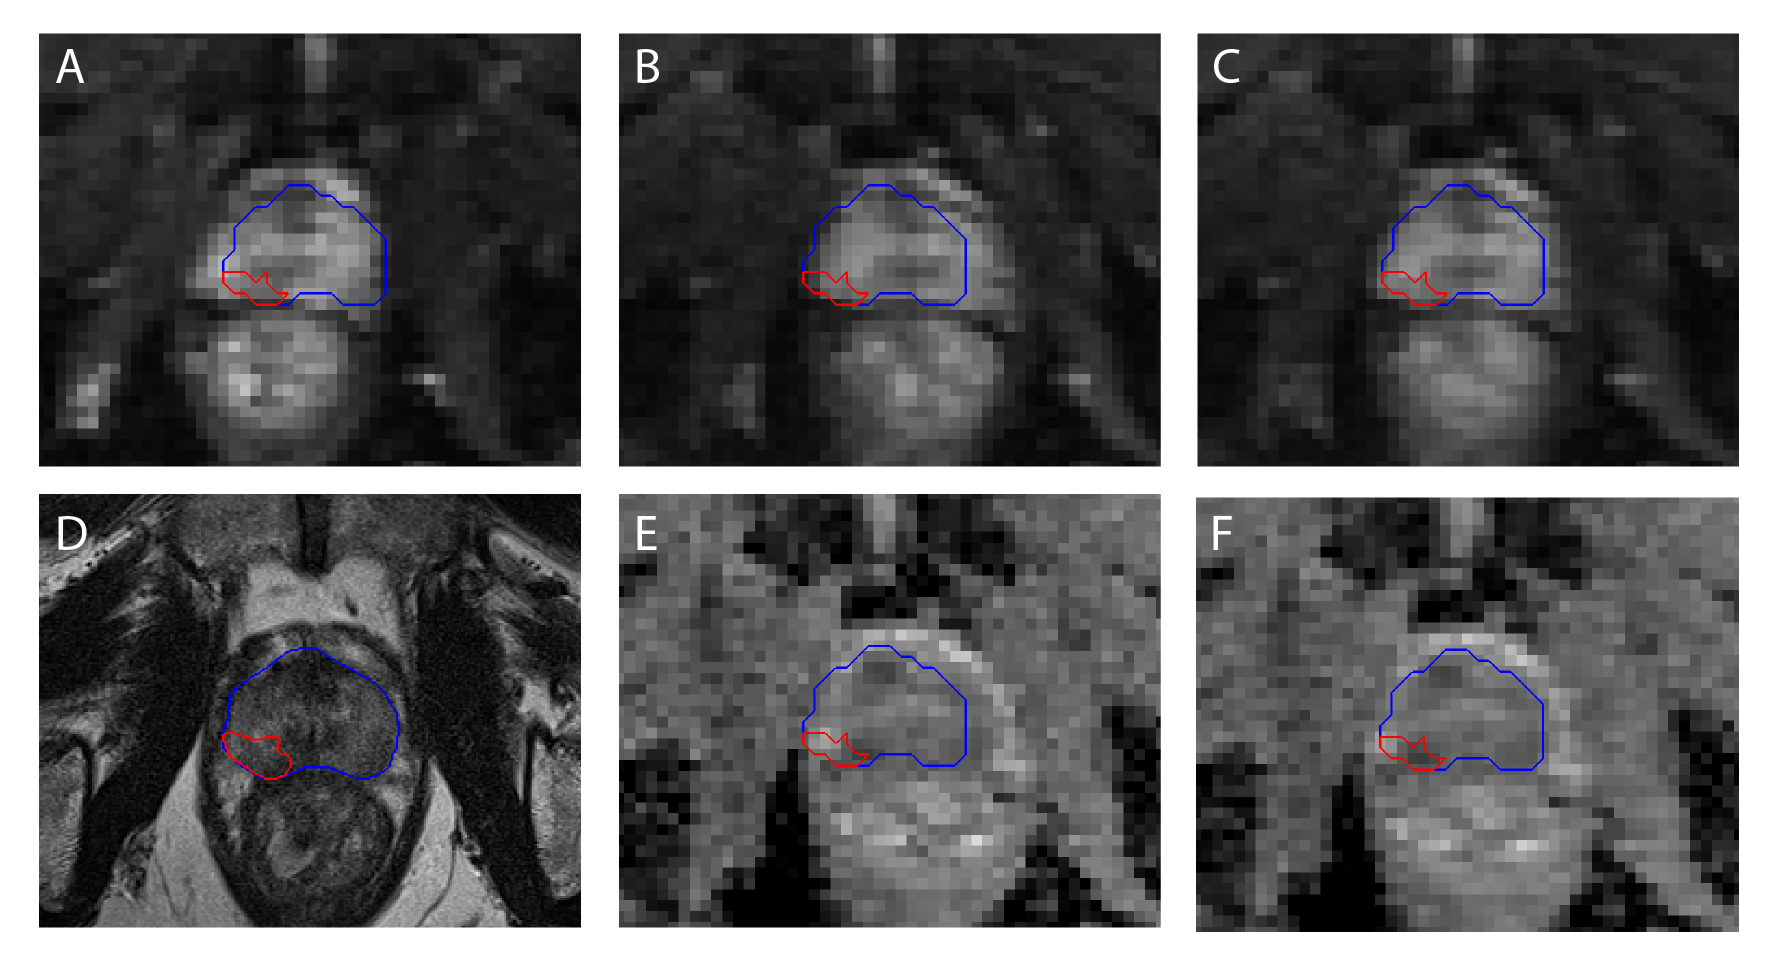
Figure 1: Illustration of magnetic field inhomogeneity induced geometric distortion in diffusion-weighted imaging with EPI trajectory. Induced distortions in forward (A) and reverse (B) b=0 image phase encoding directions. (C) Distortion corrected b=0 s/mm2 image. (D) Prostate anatomy on T2-weighted image. Computed ADC maps before (E) and after (F) distortion correction. The overlaid contours of the whole prostate (blue) and a peripheral zone tumor (red) were delineated on the T2-weighted image and then transformed via registration to the diffusion-weighted images.