0569
Region-Specific Effects of AMP-Activated Protein Kinase on the Neurochemical Profiles of the Hippocampus and Midbrain in MiceIvan Tkac1, Biplab Dasgupta2, and Raghavendra Rao3
1Center for Magnetic Resonance Research, University of Minnesota, Minneapolis, MN, United States, 2Division of Oncology, Cincinnatio Children’s Hospital Medical Center, Cincinnati, OH, United States, 3Department of Pediatrics, Division of Neonatology, University of Minnesota, Minneapolis, MN, United States
Synopsis
Adenosine monophosphate-activated protein kinase (AMPK) is an evolutionarily conserved signaling molecule essential for cellular energy balance. AMPK senses metabolic stress and integrates diverse physiological signals to restore energy balance. Its role in the normal brain development is not well understood. The purpose of this study was to assess whether neurochemical profiles of developing mouse brain are affected by knocking out of AMPK enzyme in a region-specific manner. Observed changes in metabolite levels (Lac, Glu) indicate reduced energy metabolism in AMPK knockout mice relative to WT controls. In addition, changes in myo-Ins suggest osmotic stress.
PURPOSE
Adenosine monophosphate-activated protein kinase (AMPK) is an evolutionarily conserved signaling molecule essential for cellular energy balance 1. AMPK senses metabolic stress and integrates diverse physiological signals to restore energy balance 2. It augments glycolysis and modulates the redox state in a cell 3. Although AMPK is highly expressed in the mammalian brain, its role in normal brain development is not well understood. Neural progenitor cells from different regions of the brain exhibit distinct energy requirements and those in the forebrain appears to be more sensitive to low energy states than those in the midbrain 4. AMPK is a heterotrimeric protein complex consisting of α, β and γ subunits. The α subunit confers catalytic kinase activity, while the β and γ subunits function in a regulatory capacity 3. The purpose of this study was to assess whether altered energy balance due to loss of AMPK β1 subunit alters the neurochemical profile of developing mouse brain in a region-specific manner.METHODS
AMPK β-/- knockout (AMPK KO, N = 6) mice and wild type controls (WT, N = 6) were studied on postnatal day 28 using a 9.4T Agilent/Varian MR scanner. Multi-slice FSE images in axial and sagittal orientation (slice thickness = 0.8 mm) were used for a precise positioning of the VOI in the hippocampus (VOI = 2.0 x 1.2 x 1.5 mm3) and in the midbrain (VOI = 3.0 x 2.5 x 1.5 mm3) region (Figs. 1 and 3). The B0 field homogeneity was adjusted by FASTMAP shimming 5. In vivo 1H MRS data were acquired using an ultra-short TE STEAM (TE = 2 ms) localization sequence combined with VAPOR water suppression 6. Metabolites were quantified using LCModel with the spectrum of fast relaxing macromolecules included in the basis set. Unsuppressed water signal was used as an internal reference for the quantification. Spontaneously breathing animals were anesthetized with 1.0 – 1.5% isoflurane and the animal body temperature and respiration were constantly monitored. Inter-regional and inter-group differences were compared using unpaired t-tests.RESULTS
The mouse body weight of the AMPK KO group at P28 (10.3 ± 0.5 g) was 22% lower than the WT control group (13.3 ± 1.7 g, p < 0.01). The spectral quality consistently accomplished in this study (Figs. 1 and 3) enabled reliable quantification of 16 - 18 brain metabolites in the hippocampus and midbrain regions (Figs. 2 and 4). Neurochemical profiles of these two brain regions were substantially different. In the WT control group of mice, significant differences between the hippocampus and midbrain regions were observed nearly for all metabolites (p < 0.001 for 11 metabolites). Significant differences (p < 0.05) between AMPK KO and WT group were observed in both brain regions. In the hippocampus, decreased creatine (-13%), glutamate (-10%), myo-inositol (-10%), lactate (-40%) and total creatine (-7%) and increased taurine (+11%) levels were observed in AMPK KO group relative to WT control (Fig. 2). In the midbrain region, decreased myo-inositol (-10%), and lactate (-40%) and increased taurine (+27%) levels were observed in AMPK KO group relative to WT controls.DISCUSSION
The results support regional metabolic diversity and function of AMPK during brain development. Decreased concentrations of lactate and glutamate in AMPK KO mice indicate reduced glycolytic and TCA cycle flux, respectively 7. Reduction in energy production metabolism is in agreement with current understanding of AMPK brain function 1,2. Observed changes were more prominent in the hippocampus (a forebrain structure) than in the midbrain region, which well corresponds with the regional differences to AMPK energy regulation activity 1-3. Lower myo-inositol levels in both brain regions suggest osmotic stress and brain osmotic regulation response. Changes in taurine concentration in opposite direction than myo-inositol probably reflect postpone brain development and protective role of taurine on brain maturation 8.CONCLUSIONS
Region-specific function of AMPK β subunit influences development and metabolic health of the brain regions and may explain their vulnerability to injury.Acknowledgements
Supported by: NIH grants P41 EB015894, P30 NS076408, R01 NS075291 and WM KECK FoundationReferences
1. Manwani B, McCullough LD. Function of the master energy regulator adenosine monophosphate-activated protein kinase in stroke. J Neurosci Res 2013;91(8):1018-1029. 2. Ronnett GV, Ramamurthy S, Kleman AM, Landree LE, Aja S. AMPK in the brain: its roles in energy balance and neuroprotection. J Neurochem 2009;109 Suppl 1:17-23. 3. Amato S, Man HY. Bioenergy sensing in the brain: the role of AMP-activated protein kinase in neuronal metabolism, development and neurological diseases. Cell Cycle 2011;10(20):3452-3460. 4. Potter WB, O'Riordan KJ, Barnett D, Osting SM, Wagoner M, Burger C, Roopra A. Metabolic regulation of neuronal plasticity by the energy sensor AMPK. PLoS One 2010;5(2):e8996. 5. Gruetter R, Tkac I. Field mapping without reference scan using asymmetric echo-planar techniques. Magn Reson Med 2000;43(2):319-323. 6. Tkac I, Starcuk Z, Choi IY, Gruetter R. In vivo 1H NMR spectroscopy of rat brain at 1 ms echo time. Magn Reson Med 1999;41(4):649-656. 7. Bednarik P, Tkac I, Giove F, DiNuzzo M, Deelchand DK, Emir UE, Eberly LE, Mangia S. Neurochemical and BOLD responses during neuronal activation measured in the human visual cortex at 7 Tesla. J Cereb Blood Flow Metab 2015;35(4):601-610. 8. Wu JY, Prentice H. Role of taurine in the central nervous system. J Biomed Sci 2010;17 Suppl 1:S1.Figures
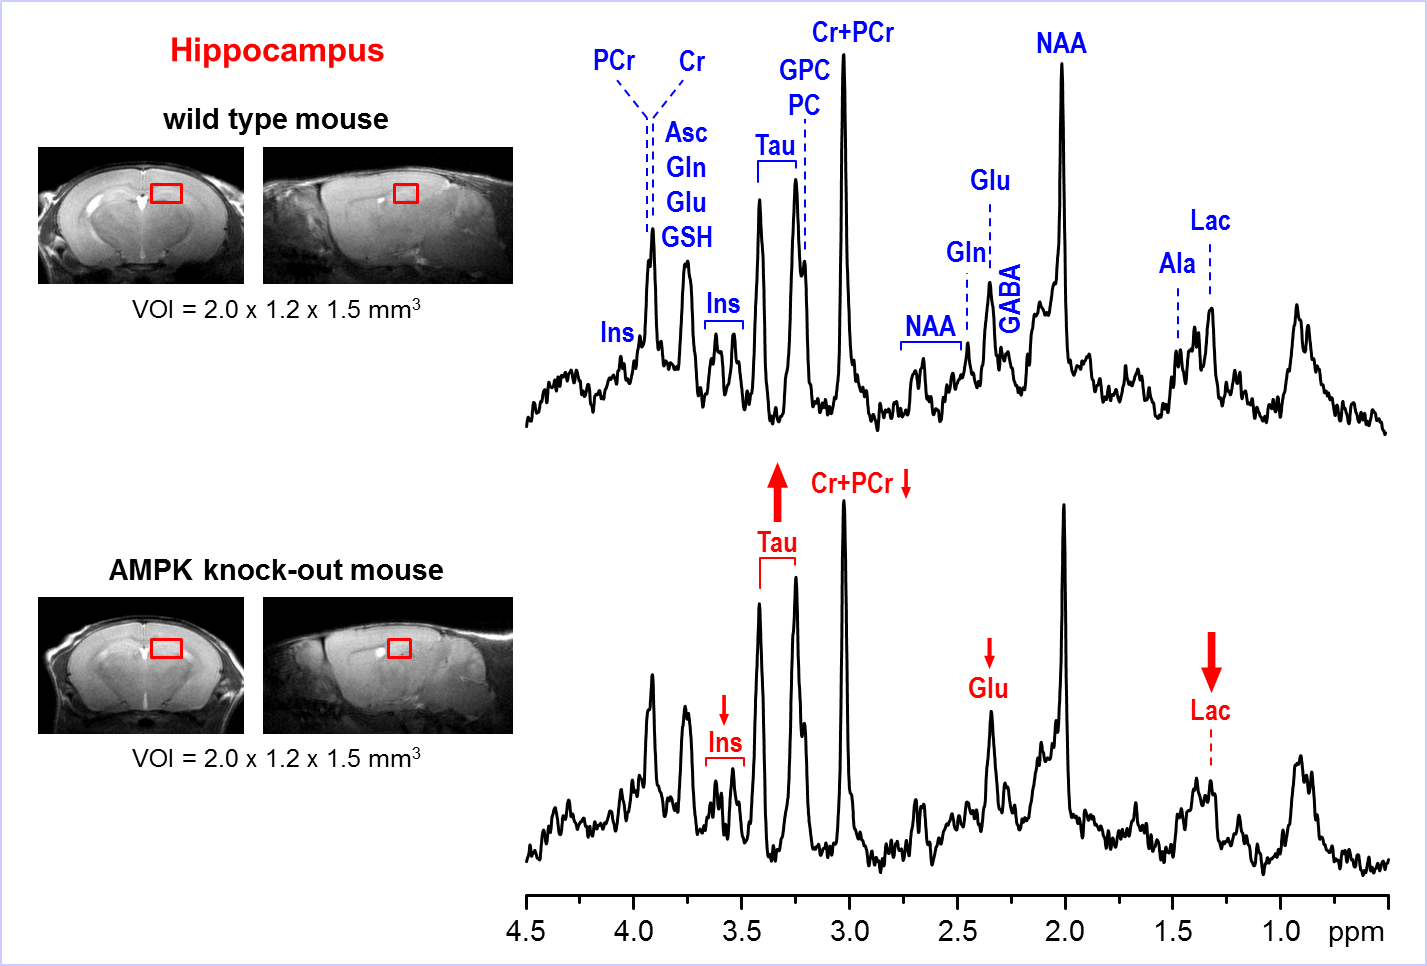
Representative
in vivo 1H MR spectra
acquired from the hippocampus of AMPK knockout mouse and wild-type control at
postnatal day 28. Axial and sagittal MR images (multi-slice FSE, slice
thickness = 0.8 mm) illustrate the typical VOI size and position in the mouse
brain. 1H MRS data were acquired using 9.4T Agilent/Varian MR
scanner using FASTMAP shimming and STEAM localization sequence (TE = 2 ms, TR =
5 s, number of transients = 320). Post-processing water signal removal or
baseline correction has not been applied.
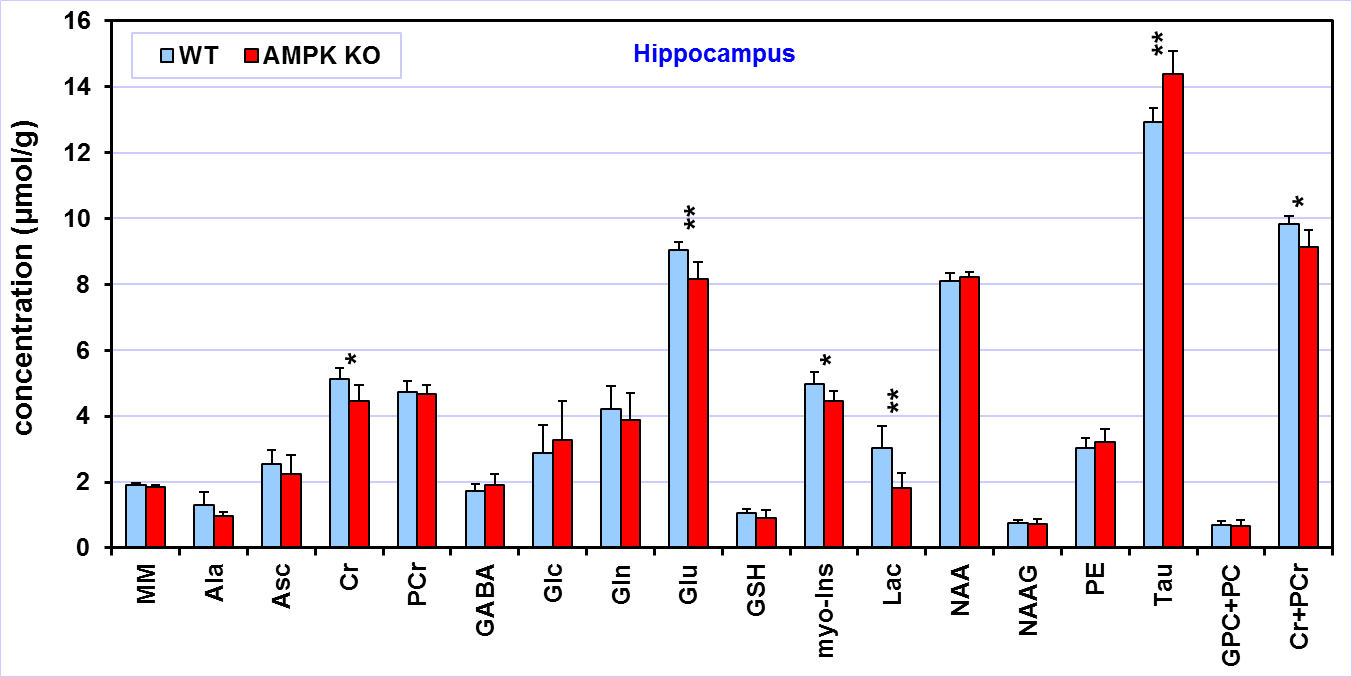
Comparison
of the neurochemical profiles quantified from the hippocampus of AMPK knockout
mice (N = 6) and wild-type controls (N = 6). MRS data were acquired at postnatal
day 28. Bar diagram error bars indicate SDs. Statistical significance: * p <
0.05, ** p < 0.005.
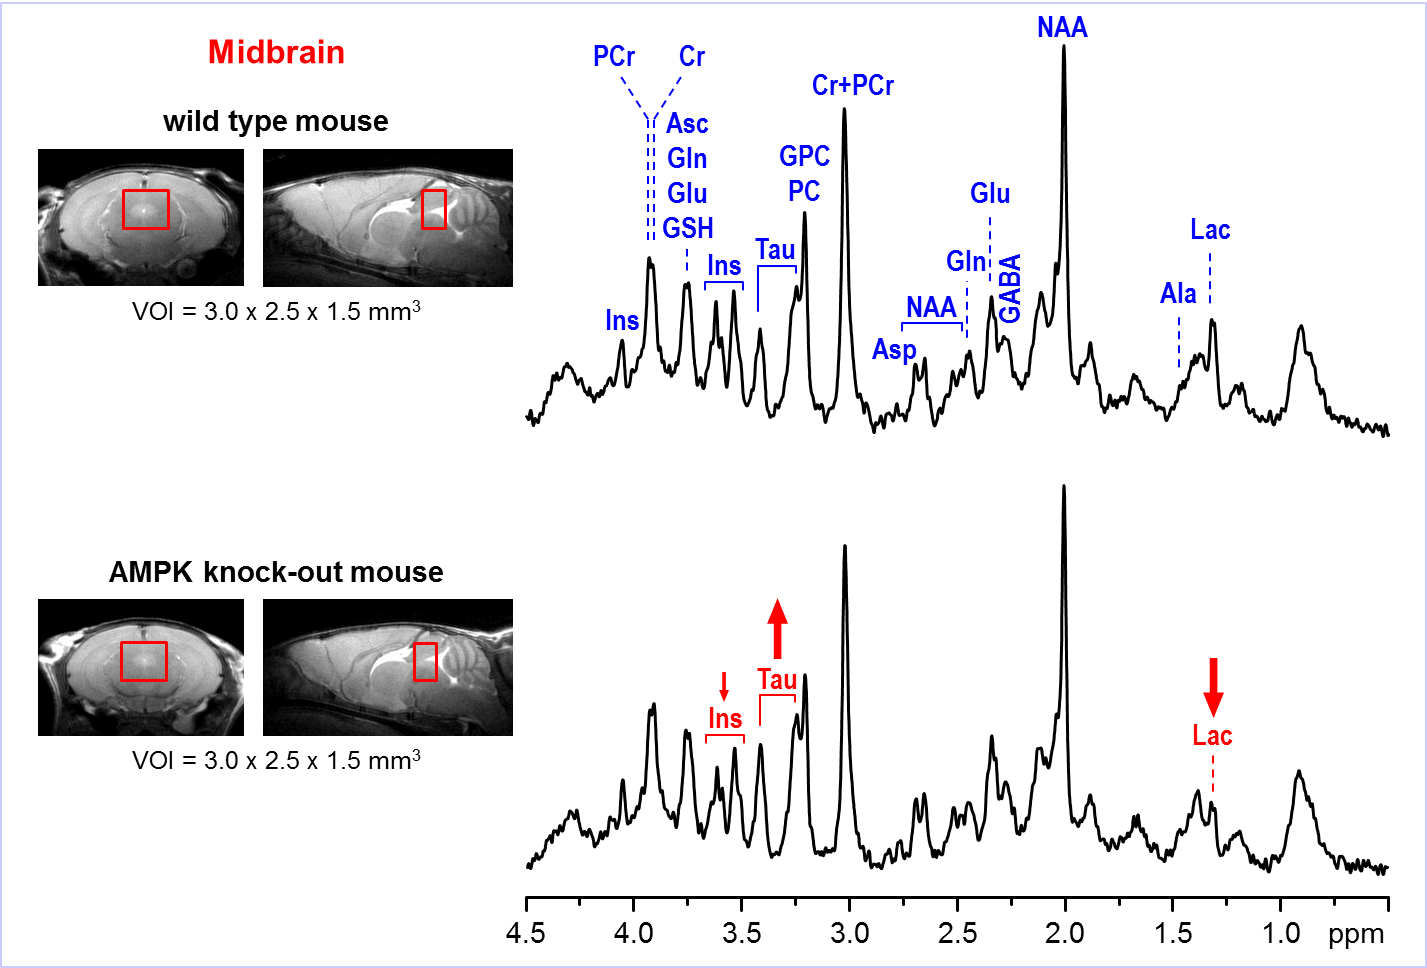
Representative
in vivo 1H MR spectra
acquired from the midbrain region of AMPK knockout mouse and wild-type control
at postnatal day 28. Axial and sagittal MR images (multi-slice FSE, slice
thickness = 0.8 mm) illustrate the typical VOI size and position in the mouse
brain. 1H MRS data were acquired using 9.4T Agilent/Varian MR
scanner using FASTMAP shimming and STEAM localization sequence (TE = 2 ms, TR =
5 s, number of transients = 160). Post-processing water signal removal or
baseline correction has not been applied.
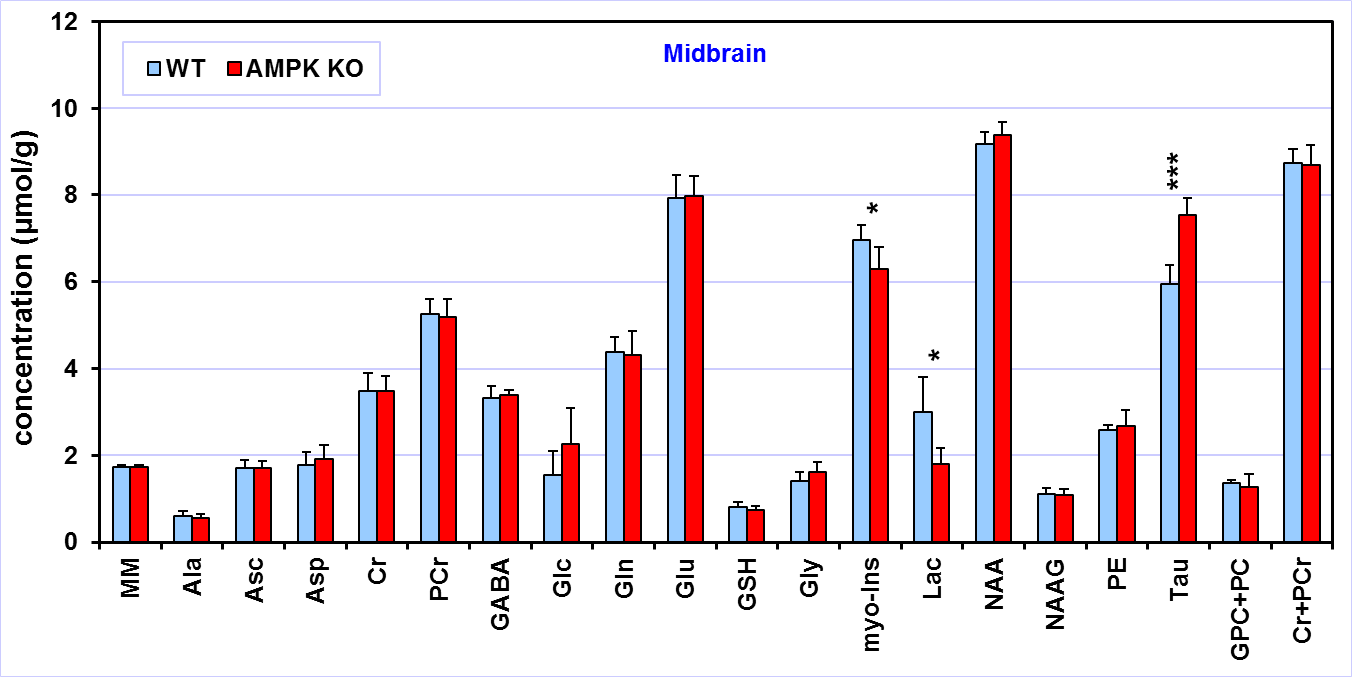
Comparison
of the neurochemical profiles quantified from the midbrain region of AMPK
knockout mice (N = 6) and wild-type controls (N = 6). MRS data were acquired at
postnatal day 28. Bar diagram error bars indicate SDs. Statistical
significance: * p < 0.05, ** p < 0.005.