0568
CMRO2 Quantification in Human Brain with Direct 17O-MRI: Profile Likelihood Analysis for Optimization of Temporal Resolution1Dept. of Radiology, Medical Physics, Medical Center – University of Freiburg, Freiburg, Germany, 2German Cancer Consortium (DKTK), Heidelberg, Germany, 3German Cancer Research Center (DKFZ), Heidelberg, Germany
Synopsis
In this study the temporal resolution of 17O-MRI protocols for quantification of the cerebral metabolic rate of oxygen consumption (CMRO2) in human brain were optimized using the profile likelihood (PL) method. For this, retrospective analysis of the influence of temporal resolution on the CMRO2 values and their PL-based confidence intervals (CI) was performed. Dynamic 17O-MRI was implemented with a 3D golden-angle radial acquisition during and after inhalation of 17O gas. The results showed that 17O-MRI data acquired at a temporal resolution 120≤Δt≤165 seconds gave identifiable CMRO2 values of 0.82‑1.18/0.92‑1.42 µmol/gtissue/min in WM/GM brain regions.
Introduction
The cerebral metabolic rate of oxygen consumption (CMRO2) is a useful biomarker of oxygen metabolism, which can be changed in diseased tissues such as brain tumors. CMRO2 can be measured with nuclear medicine (15O‑PET)[1], or by direct 17O-MRI with administration of 17O-enriched gas [2–6]. Recently, we have applied the method of profile likelihood (PL) analysis to demonstrate that reliable measurements of CMRO2 are possible with 17O‑MRI at 3T and proposed a flexible pharmacokinetic model for CMRO2 quantification [6].
The purpose of this study was to optimize the temporal resolution of 17O-MRI protocols for CMRO2 quantification to make it applicable in clinical trials. Therefore, a 3D golden-angle radial acquisition [7] was utilized for optimization of temporal resolution, and PL analysis was performed to find the optimal temporal resolution.
Material and Methods
A dynamic 4D 17O-MR data set of a male volunteer (50 years) was acquired in 17O‑MRI experiment [6] at a clinical 3T MR system (Siemens Magnetom TIM Trio) with a custom-built Tx/Rx 17O quadrature head coil. For imaging, a 3D ultrashort-TE density-adapted radial sequence [9] with a spiral phyllotaxis pattern [7] was used (TRF=0.8ms; TR=7.57ms; TE=0.52ms; BW=175Hz/pixel; TR=5.7ms; nominal resolution Δx=8mm; total number of unique projections covering the whole k-space was 15844 with 466 interleaves, 34 projections per interleave and 128 sampling points per projection).
The imaging experiment was divided into a baseline phase (11.85min), wherein the natural abundance 17O‑MR signal was acquired, followed by two phases with a closed rebreathing (RB) system: the 17O‑phase (4.12min), during which 1.5L of 70%-enriched 17O gas was delivered, and a subsequent 16O‑phase phase (5min), during which the volunteer was breathing the gas stored in the RB system (which contains the exhaled 17O2 gas that is then reused to increase the 17O‑MR signal) and 1.35L of fresh 16O gas was delivered. In the final washout phase (10.06min), the breathing system was opened and the volunteer was breathing room air.
Dynamic series of 3D 17O‑MR images were reconstructed with Kaiser-Bessel gridding at 15 different temporal resolutions Δt=[30,45,…,240]s. Segmented 1H MPRAGE image was coregistered to 3D 17O‑MR images to extract signal dynamics in gray (GM) and white matter (WM) whole brain regions and in a small GM region (V=20 ml). In this small GM region a pharmacokinetic model [6] was modified to account for switching between 17O and 16O gas and was used to perform PL analysis. In particular, the identifiability of CMRO2 and the confidence intervals calculation at various were assessed with the PL method: CMRO2 is identifiable if PL‑based CIs are finite, but can be practically non-identifiable if CIs are infinite in one dimension [6,8]. The temporal resolution, which provided identifiable CMRO2 values with the smallest CIs was used to calculate CMRO2 values in whole GM and WM regions. 67% CIs were used to present calculated CMRO2 values.
Results and Discussion
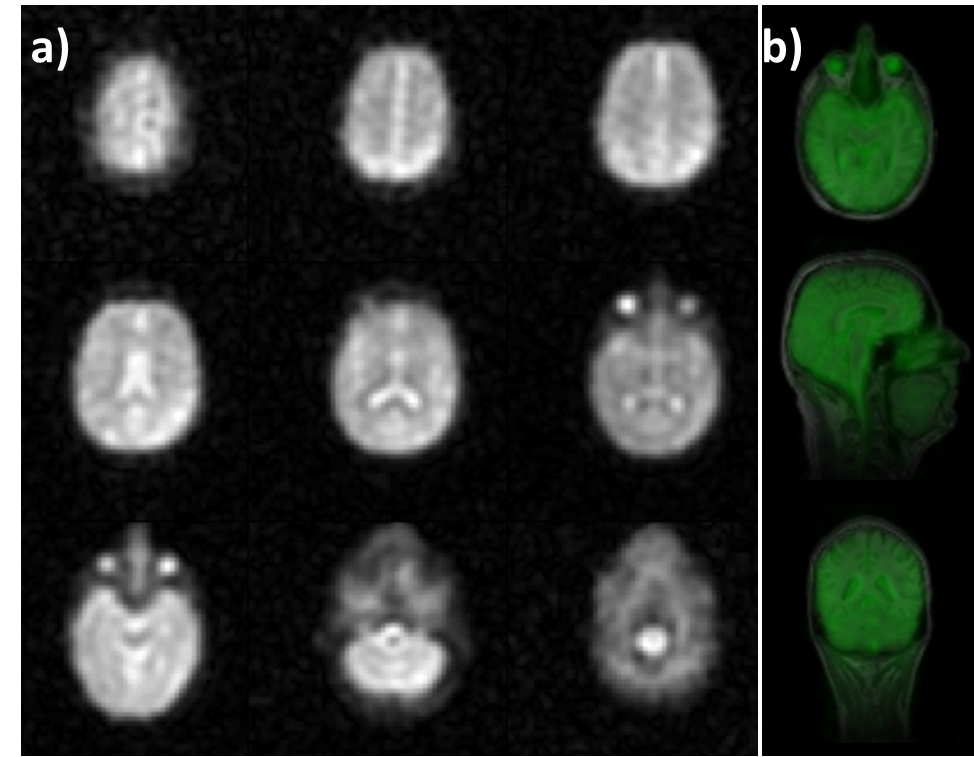
In 17O-MR images averaged over the total measurement time regions with high water content (e.g., eyes and ventricles) can be clearly identified (Fig.1). In the analysis of the dynamic 17O-MR data, the pharmacokinetic model for CMRO2 quantification [6] was modified to incorporate both 16O and 17O gas administration, which allows to design more efficient 17O gas handling, which reduces the amount of inhaled rare and costly 17O gas and improves patient comfort.
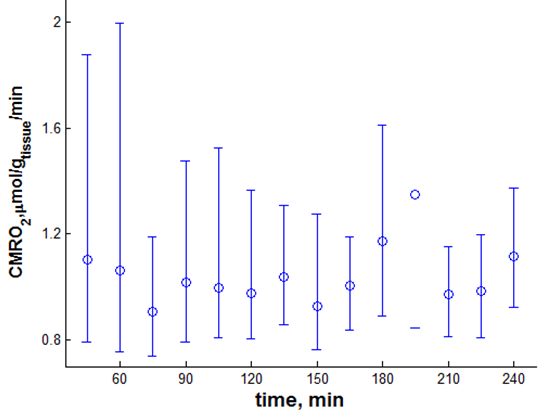
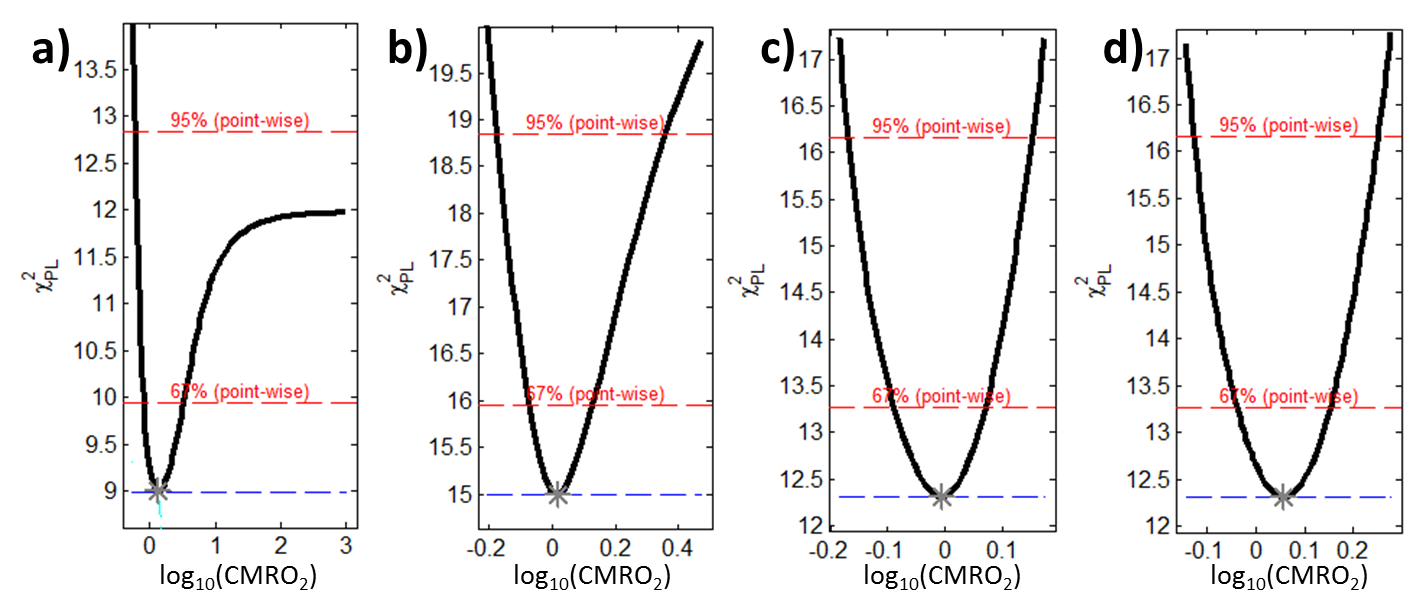
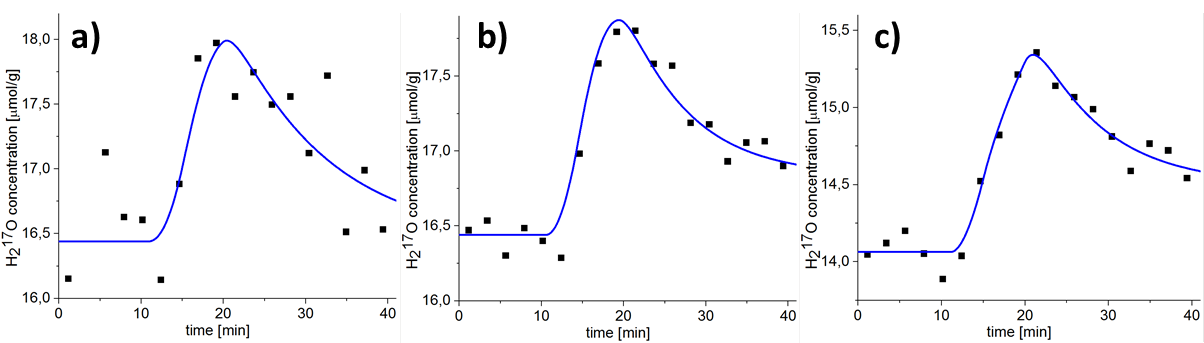
Figure 2 shows the dependence of CMRO2 and its asymmetric PL‑based CIs in a small GM region on the temporal resolution of the reconstructed 17O-MR images. Reliable CMRO2 quantification with CIs less than 0.56 µmol/gtissue/min is possible at 120≤Δt≤165 s. Exploiting the PL of the CMRO2 for Δt=135s and Δt=195s are shown in Fig. 3. Finite CI for Δt=135s means that CMRO2 is identifiable, whereas an infinite upper boundary of CI at Δt=195s represents practical non-identifiability caused by high noise and small amount of measurement points. Fitting results to the pharmacokinetic model at a temporal resolution of 135s are shown in Fig. 4. CMRO2 values of 0.82-1.18/0.92-1.42 µmol/gtissue/min found in whole brain WM/GM regions are in a good correspondence with the results of 15O‑PET [1] and 17O-MRI [2–6] studies.
Conclusions and Outlook
Profile likelihood analysis of the influence of the temporal resolution on the CMRO2 values and their PL-based CIs showed that for the given measurement parameters 120≤Δt≤165 seconds is favorable. CMRO2 values in GM and WM brain regions obtained in a dynamic 17O‑MR experiment at 3T using only 1.5L of 70%-enriched 17O gas are in good agreement with literature data. In general, the profile likelihood approach can be applied to investigate identifiability of model parameters in other fields of MRI, such as dynamic MRI examinations with contrast agent injections.Acknowledgements
Support from NUKEM Isotopes Imaging is gratefully acknowledgedReferences
[1] Leenders KL, Perani D, Lammertsma AA, Heather JD, Buckingham P, Healy MJ, Gibbs JM, Wise RJ, et al. Cerebral blood flow, blood volume and oxygen utilization. Normal values and effect of age. Brain 1990;113:27–47.
[2] Atkinson IC, Thulborn KR. Feasibility of mapping the tissue mass corrected bioscale of cerebral metabolic rate of oxygen consumption using 17-oxygen and 23-sodium MR imaging in a human brain at 9.4 T. Neuroimage 2010;51:723–733.
[3] Hoffmann SH, Begovatz P, Nagel AM, Umathum R, Schommer K, Bachert P, Bock M. A measurement setup for direct 17O MRI at 7 T. Magn. Reson. Med. 2011;66:1109–1115.
[4] Hoffmann SH, Radbruch A, Bock M, Semmler W, Nagel AM. Direct 17O MRI with partial volume correction: first experiences in a glioblastoma patient. MAGMA 2014;27:579–87.
[5] Borowiak R, Kurzhunov D, Wagner P, Reisert M, Bock M. Dynamic 17O-MRI at 3 Tesla for in vivo CMRO2 Quantification. In: In proceedings of 23rd Annual Meeting of ISMRM; Toronto, Canada. ; 2015. p. 4633.
[6] Kurzhunov D, Borowiak R, Hass H, Wagner P, Krafft AJ, Timmer J, Bock M. Quantification of oxygen metabolic rates in Human brain with dynamic 17O MRI: Profile likelihood analysis. Magn. Reson. Med. 2016;00:1–11.
[7] Piccini D, Littmann A, Nielles-Vallespin S, Zenge MO. Spiral phyllotaxis: The natural way to construct a 3D radial trajectory in MRI. Magn. Reson. Med. 2011;66:1049–1056.
[8] Nagel AM, Laun FB, Weber M-A, Matthies C, Semmler W, Schad LR. Sodium MRI using a density-adapted 3D radial acquisition technique. Magn. Reson. Med. 2009;62:1565–1573.
[9] Raue A, Kreutz C, Maiwald T, Bachmann J, Schilling M, Klingmüller U, Timmer J. Structural and practical identifiability analysis of partially observed dynamical models by exploiting the profile likelihood. Bioinformatics 2009;25:1923–1929.
Figures