0565
In vivo quantification of IONP-labeled PAR T-cells using positive contrast MRIJinjin Zhang1, Sidath C Kumarapperuma2, Qi Shao3, Lakmal Kotelawala2, John C Bischof3, Carston R Wagner2, and Michael Garwood1
1Center for Magnetic Resonance Research, Department of Radiology, University of Minnesota, Minneapolis, MN, United States, 2Department of Medicinal Chemistry, University of Minnesota, Minneapolis, MN, United States, 3Department of Mechanical Engineering, University of Minnesota, Minneapolis, MN, United States
Synopsis
Immunotherapies have received increasing attention as novel therapeutics for the treatment of cancer and autoimmune disease. In this study, IONP labeled PAR T-cells were tracked and quantified in vivo using the SWIFT sequence for positive contrast imaging and T1 mapping. The longitudinal relaxation rate constant (R1) showed a linear dependence on the cell density in vitro and thus was used to quantify T cell density in vivo in liver. These preliminary results demonstrate how positive contrast from an ultra-short T2 sensitive sequence can provide a tool to quantify the bio-distribution of T cells.
Introduction
Immunotherapies, e.g. re-engineered T cells with chimeric antigen receptors (CAR-Ts), T cell receptor engineered cells and tumor-infiltrating lymphocytes, have shown great promise in clinical trials and received increasing attention as novel therapeutics for the treatment of cancer and autoimmune disease [1-3]. Noninvasive imaging will be needed to allow accurate evaluation of cell biodistribution in clinical translation, especially for monitoring the uncontrolled proliferation and off-target tissue accumulation. Comparing to other imaging methodologies, MRI has advantages of no ionizing radiation and ability to image deep tissues at high resolution and high sensitivity. However, the ability of conventional T2*-weighted MRI to quantify cell distributions is limited due to low SNR from negative contrast and “blooming effect”. Previously, we have shown SWIFT, an ultra-short TE sequence, produces positive contrast with IONPs which can be quantified [5,6,7]. In this study, IONP labeled anti-PSMA PAR T-cells (a novel non-genetic method to re-engineer the human T cells with Prosthetic Antigen Receptors (PARs)) were tracked and quantified using the SWIFT T1 mapping method in-vivo [8].Method
Primary T-cells were from donor derived peripheral blood mononuclear cells and incubated in RPMI media. IONP labeling was achieved by incubating in IONPs (Ferrotec, NH, USA) solutions at 0.5 mg Fe/ml [9]. The cells were then labeled with anti-PSMA PARs (treated group) prior to IV administration. In-vivo studies were performed in 6 mice with bilateral flank prostate tumor. 40 million treated PAR T-cells were injected intravenously in three mice. Control group (n=3) were injected with PBS only. The treated group (n=3) were imaged before, 24h-post and 48h-post injection. SWIFT images and T1 maps were acquired on a 9.4 T animal MRI scanner (Agilent Technologies, USA) using a volume coil, with BW=384 kHz, TR=1.2 ms. The T1 map was acquired using variable flip angle method. GRE images were acquired for comparison using BW=150 kHz, TR=4.2 ms, TE=2.1 ms. After imaging, major organs and tumors were harvested for total Fe analysis by ICP-MS and immunohistochemical staining.Results and discussions
Negative contrast from a GRE image and positive contrast from a SWIFT image are shown in Figs. 2a&b. In our previous studies, we have observed a linear relationship between the measured R1 versus the concentration of IONPs both in-vitro and in-vivo [5-7]. Here, in the phantom study, a constant concentration of IONPs was used for all cell incubations, and this resulted in a linear trend between the measured R1 versus number of cells (Fig. 2 d). As such, the calibration data can be applied to quantify the biodistribution of T cells. Tracking and quantification of T-cells in treated mice are shown in Fig. 3. Representative images and maps of one mouse before, 24h-post and 48h-post i.v. injection of the IONP-labeled and anti-PSMA CSANs treated PAR-T cells are shown. The majority of IONP labeled PAR T-cells was deposited in liver and spleen, which induced strong negative contrast in GRE images (yellow dashed line) and caused apparent T1 & R1 changes in SWIFT maps (black dashed line). Only small amount of IONP labeled anti-PSMA PAR T-cells were observed in tumor (red dashed line). The average R1 in the liver and spleen of three treated mice at three different time points are shown in Fig. 4. The R1 of liver at 24h-post and 48h-post is significantly different from before injection (p = 0.0002 and 0.001). Using the calibration data, average PAR T-cells density in liver is 9400 cells/μL 24 hour-post injection and decreased to 7400 cells/μL 48 hour-post injection. From ICP-MS data, the IONP-labeled T cells have about 0.05 mg Fe/(M cells). The calculated iron concentration in liver (0.37 mg/g) is close to the ICP-MS data of liver at around 0.3 mg/g. The change in spleen is not as apparent as in liver, but is still statistically significant (p = 0.02 and 0.028). Immunohistochemical staining in Fig. 3d showed iron (blue, left) and human anti-CD3 (brown, right) in tumor section (48 h-post) and indicated T cell extravasation.Conclusions
IONP-labeled anti-PSMA PAR T-cells delivered through i.v. injection were tracked and quantified by using positive contrast with an ultra-short T2-sensitive sequence. The T-cell density in liver was quantified. The amount of T-cells accumulated in tumor is not apparent. These preliminary results demonstrate the utility of T1 mapping based on an ultra-short T2-sensitive sequence for quantifying the bio-distribution of IONP-labeled T-cells.Acknowledgements
This work was funded by: NIH P41 EB015894, WM KECK Foundation, UMN AHC Faculty development grant.References
[1] Kalos M. et al. Sci. Trans. Med. 2011, 3. [2] Grupp S. A. et al. N. Engl. J. Med. 2013, 368, 1509. [3] Tey S-K. Clin. Trans. Immunol. 2014, 3:e17 [4] Idiyatullin D et al. J Magn Reson 2006;181(2):342. [5] Zhang J. et al. Magn Reson Med 2014;71(6):1982. [6] Zhang J. et al. Magn Reson Med 2016, DOI: 10.1002/mrm.26394 [7] Zhang J. et al., ISMRM, 2015, No.225. [8] Shen J. et al., Prosthetic Antigen Receptors. J Am Chem Soc 137, 10108-10111 [9] Bhatnagar P et al. Scientific reports 2014;4:4502.Figures
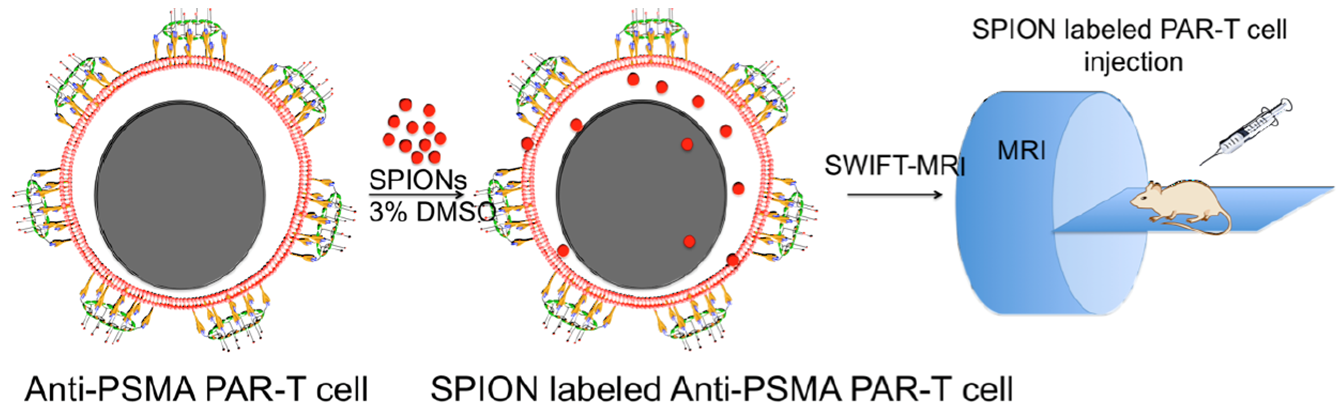
Fig. 1 Illustration of the
anti-PSMA PAR-T cells used in this study.
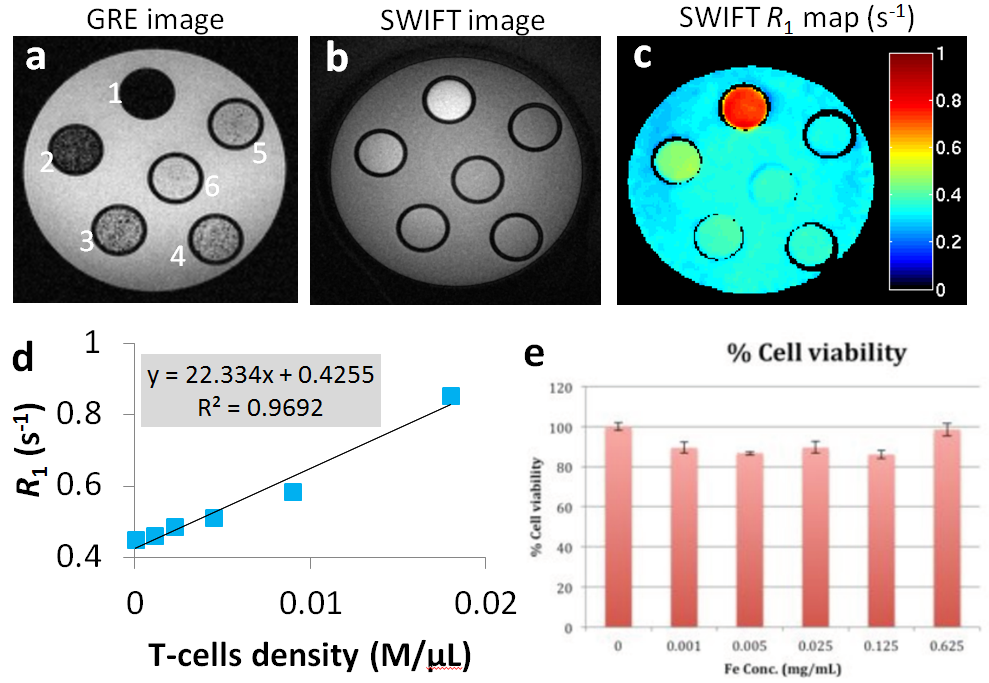
Fig. 2 (a-c) Phantom with different numbers of
IONP labeled T-cells well dispersed in 200 uL agar. The numbers of cells for
tube 1-6 are: 3.6M, 1.8M, 0.9M, 0.45M, 0.22M, 0M respectively. The T cells were
incubated in IONP solution at 0.5 mg Fe/ml as described in the method section. (d) Plot and linear fitting of averaged
R1 versus number of cells acquired from the phantom study. The fitted slope is
22.3 (s-1M/μl). (e)
Viability of cells incubated in IONP solution at different concentrations.
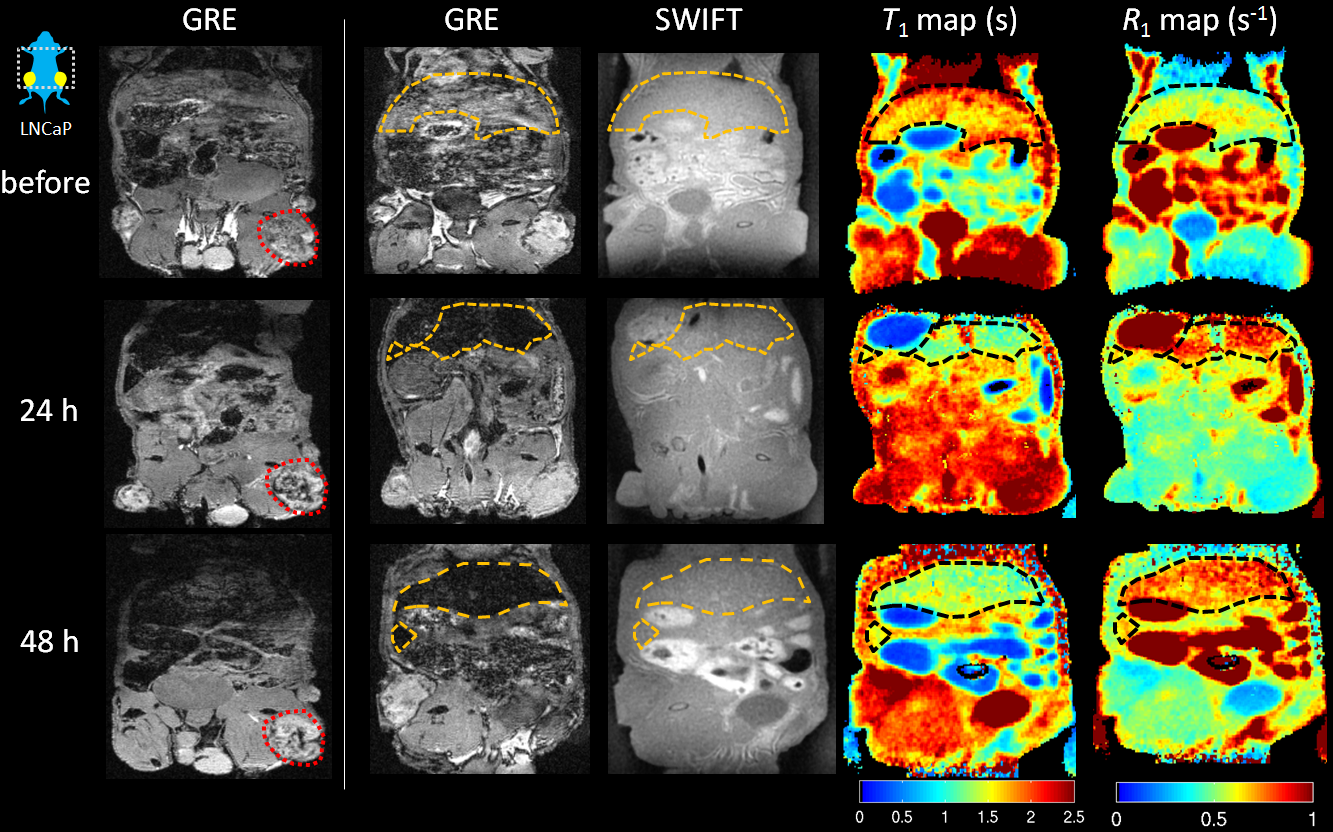
Fig.
3 GRE, SWIFT images and SWIFT T1 & R1 maps of one representative mouse abdomen
before, 24h-post and 48h-post IV injection of the anti-PSMA CSANs treated IONP
labeled PAR-T cells. Within the tumor (red dashed line), a small increase in negative
contrast was observed after injection in GRE images. Liver and spleen showed
changes in R1 after IONP injection as expected (yellow or black dashed lines)
in SWIFT maps.
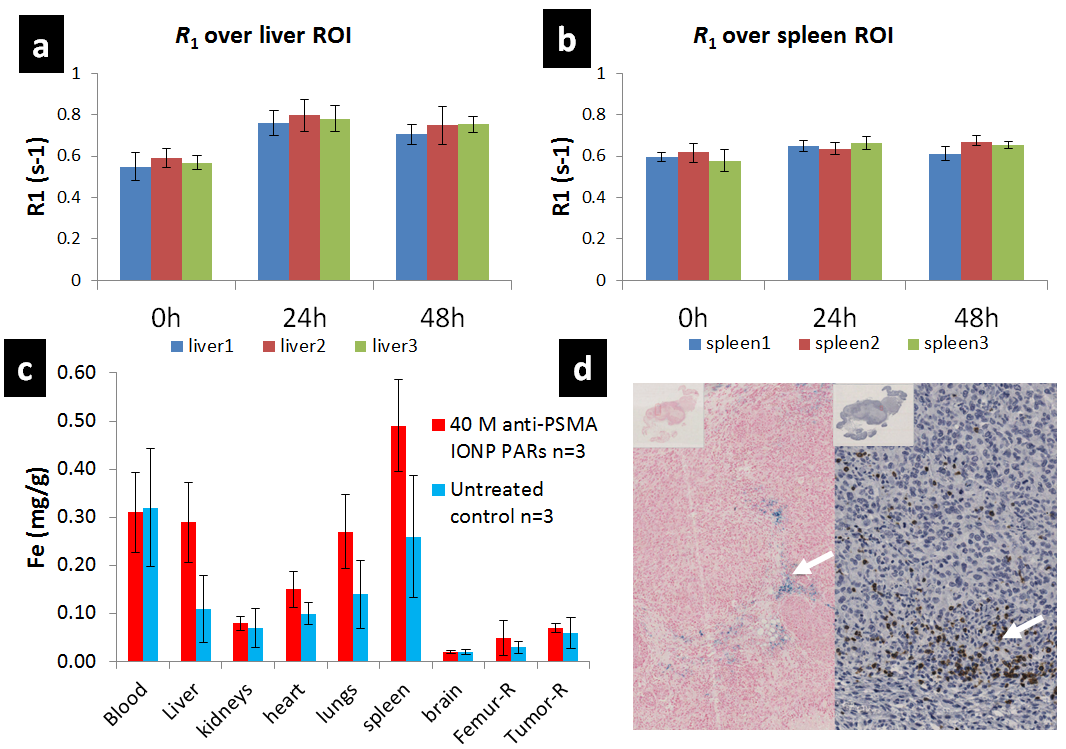
Fig.
4 (a-b) Average R1 over liver and spleen of three treated mice over three
different timing points. R1 of liver at 24h-post and 48h-post is significantly
different from before injection. The
average PAR T-cells density in liver is 9400 cells/μL 24h-post and decreased to
7400 cells/μL 48h-post. Change in spleen is not as apparent as in liver, but still
statistically significant. (c) ICP-MS data of both the treated (n=3) and
untreated (n=3) groups. (d) Immunohistochemical staining for iron (left) and
human CD3 T cells (right) in tumor section (48h-post) indicating T cell
extravasation.