0564
A High Throughput, MEMRI-Based Imaging Pipeline to Study Mouse Models of Sporadic Human Cancer1Kimmel Center for Biology and Medicine at the Skirball Institute of Biomolecular Medicine, New York University School of Medicine, New York, NY, United States, 2Biomedical Imaging Graduate Program and Department of Radiology, New York University School of Medicine, New York, NY, United States, 3Developmental Biology, Sloan Kettering Institute, New York, NY, United States
Synopsis
A high-throughput imaging pipeline is presented to quantify the heterogeneity in longitudinal disease progression in mouse models of human brain cancer and to test the efficacy of novel anti-cancer therapeutics in accurate mouse models of sporadic human cancer.
Purpose
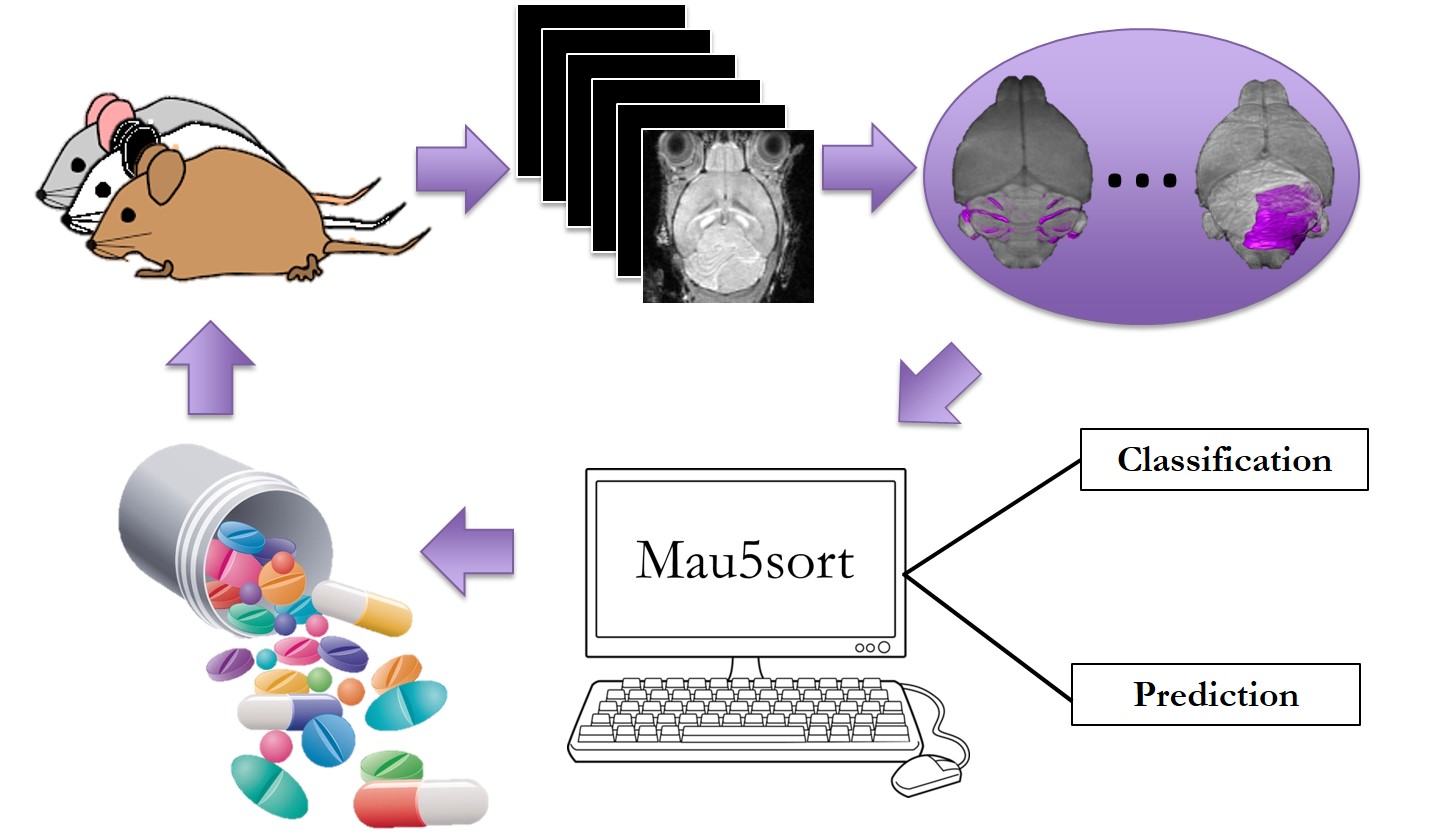
Current methods used to test novel therapeutics in a preclinical setting are generally not capable of noninvasive and longitudinal assessment of disease. Such strategies do not produce quantitative results, but rather give a relative assessment of the disease status in a treatment group compared to that of naïve or control groups. Importantly, these methods do not account for the natural variability between individual tumor progressions apparent in mouse models of the sporadic nature of human cancer. The heterogeneity confounds controlled studies as each tumor can exhibit a distinct response to therapy. For these reasons, we have developed a high-throughput, Manganese-enhanced MRI (MEMRI) driven pipeline – schematically shown in Fig 1 – for testing novel therapeutics in mouse models of sporadic human brain cancers.Methods
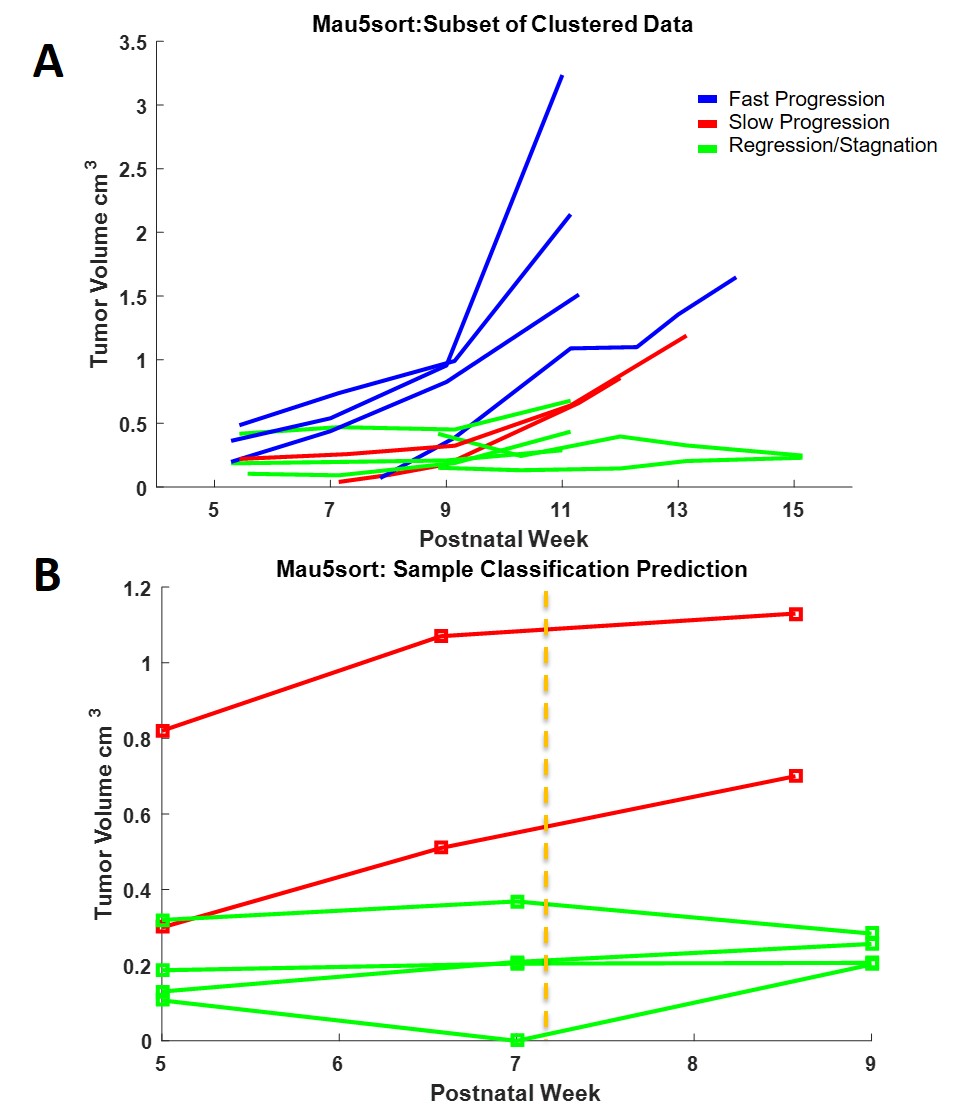
Mice expressing an activating mutation of Smoothened (SmoM2) in rare cerebellar granule precursors were generated by crossing Atoh1-CreER 1 mice with R26floxedSTOP-SmoM2 mice2 as a model for human SHH medulloblastoma. Expression of the SmoM2 mutation was induced by subcutaneous injection of low (1µg/g) or medium (5µg/g) dose Tamoxifen (TMX) at postnatal day (P)2. Biweekly MEMRI sessions using 7-Tesla MRI (Bruker) began at postnatal week 5 (W)5 and continued until W13. MnCl2 (50-60 mg/kg) was injected intraperitoneally 24 hours before imaging. Scan protocol: 1 min low-resolution pilot, 21min 150µm resolution T1-weighted GE sequence (TE/TR = 4/30 ms; FA = 20°; FOV = 19.2 mm × 19.2 mm × 12 mm; Matrix = 128 × 128 × 80). Tumor volumes were obtained after each imaging time point by semi-automated segmentation in Amira. Mau5sort (“mouse sort”) - a customized machine-learning based3 program was developed in MATLAB and applied to classify the individual tumor progression observed in each animal (n=57) and predict outcome using early progression data (defined as <W7). Animals were sacrificed post-imaging at W13 for either FACS or histopathology.Results
Our modified semi-automated segmentation technique is approximately 9 times more efficient than fully manual approaches used previously4,5. Using Mau5sort, we are able to classify the heterogeneous tumor progression of all animals entered into the pipeline into three groups – fast progressing, slow progressing/stagnating, and regressing (Fig 2A) (n=17, average silhouette= 0.6455). As a result of this classification, group-specific models for disease progression have been produced. Additionally, early time point data passed to Mau5sort can predict outcome at subsequent stages from W9 to W13 accurately (n=6) (Fig 2B).
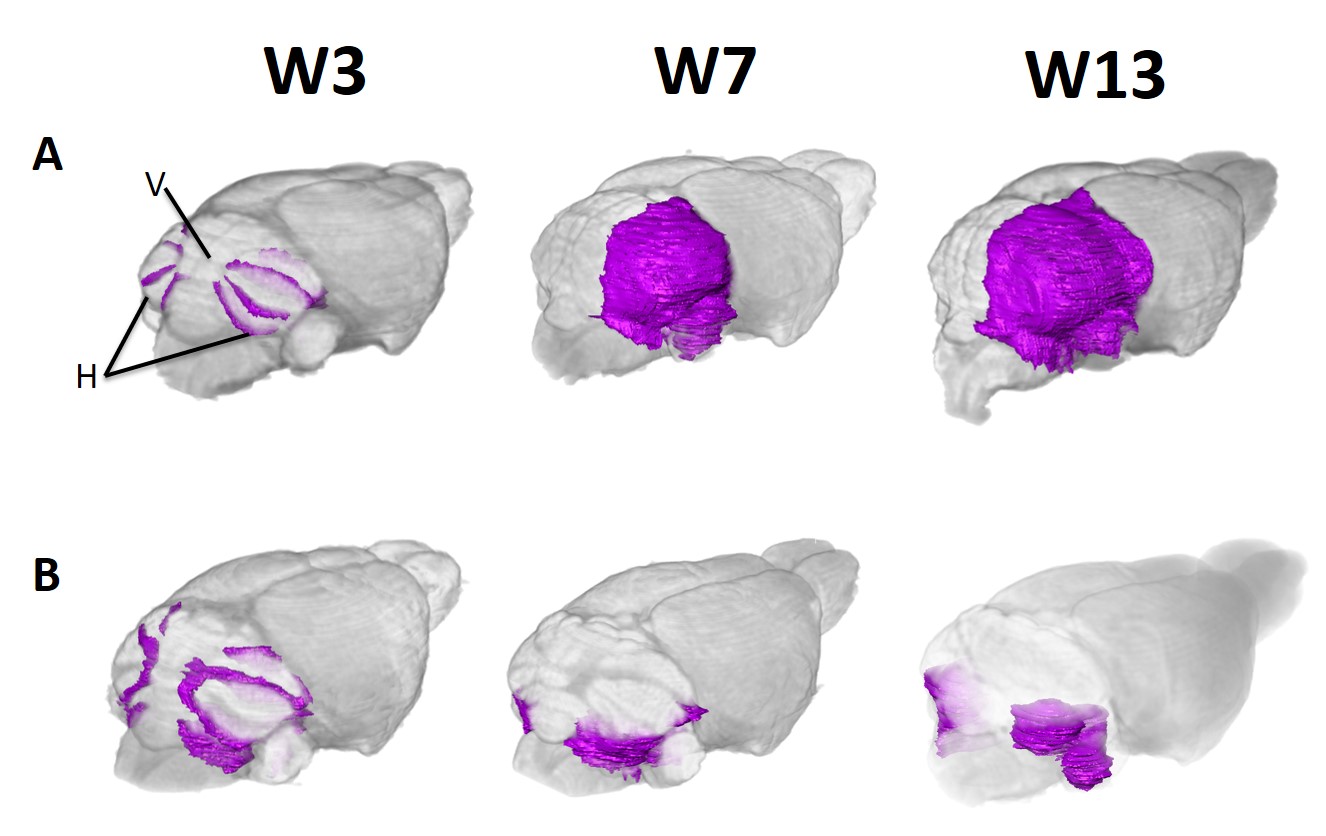
We have shown that SmoM2 tumors originate (at W5) exclusively in the hemispheres of the cerebellum (Fig 3). The majority of low dose TMX –injected animals were classified into the slow progressing/regressing group (n=9), followed by fast progressing group (n=4) and slow progressing group (n=4). On average, initial tumor volumes were larger in medium dose TMX-injected mice (n=20) than low dose TMX-injected mice (n=37). However, the rates of tumor progression and grouping solution determined by Mau5sort did not differ significantly between the two groups.
Discussion and Future Directions
Our high-throughput, MEMRI-based pipeline provides high-density quantitative information that can characterize heterogeneous longitudinal progression of mouse models of human brain cancers. Optimized image segmentation significantly decreases our time-to-result. Mau5sort potentiates unbiased candidate characterization and selection for entry into preclinical trials.Acknowledgements
This work was made possible by NIH grants RO1 CA192176 and RO1 NS038461. Special thanks to Helena Kim for her efforts in validating the semiautomated segmentation technique.References
1. Machold, R. & Fishell, G. Math1 Is Expressed in Temporally Discrete Pools of Cerebellar Rhombic-Lip Neural Progenitors. Neuron 48, (2005).
2. Mao, J. et al. A novel somatic mouse model to survey tumorigenic potential applied to the Hedgehog pathway. Cancer Res. 66, 10171–8 (2006).
3. MacQueen, J. Some methods for classification and analysis of multivariate observations. (1967).
4. Suero-Abreu, G. A. et al. In vivo Mn-enhanced MRI for early tumor detection and growth rate analysis in a mouse medulloblastoma model. Neoplasia 16, 993–1006 (2014).
5. Rallapalli, H. et al. Longitudinal MEMRI Characterization of a Novel Mouse Medulloblastoma Model. in Proc. ISMRM, 10171 (2016).
Figures