0563
CM101: an optimized MR probe targeting type I collagen for detection of liver fibrosis1Athinoula A. Martinos Center for Biomedical Imaging, Department of Radiology, Massachusetts General Hospital and Harvard Medical School, Charlestown, MA, United States, 2Merck Research Laboratories, Kenilworth, NJ, United States, 3Collagen Medical, Belmont, MA, United States, 4Pathology, Massachusetts General Hospital, Boston, MA, 5Surgical Oncology, Massachusetts General Hospital, Boston, MA, United States
Synopsis
Recent molecular MR approaches targeting collagen demonstrated the promise of noninvasive detection and staging of liver fibrosis and monitoring treatment response, but the molecular probe used was not suitable for clinical translation due to the low stability of the Gd chelator chosen. CM-101 is a new peptide based probe using the highly stable Gd-DOTA chelate that is rapidly eliminated from plasma intact into the urine and shows no sign of Gd accumulation. CM-101 robustly detected liver fibrosis in a bile duct ligation model in rats and in a CCl4 mouse model.
Introduction
Previous studies with a type I collagen targeted molecular MR probe EP-3533 have demonstrated its ability to stage liver fibrosis and assess response to anti-fibrotic therapies with high sensitivity and specificity in rodent models [1-4]. However, EP-3533 employed the linear Gd-DTPA chelate which results in some retention of Gd in bone and other tissue, making this compound unsuitable for clinical translation due to the risk of free gadolinium-associated nephrogenic systemic fibrosis [5]. We report a novel probe CM-101 that uses the same collagen-targeting mechanism but employs the much more stable Gd-DOTA chelate. We evaluated its biodistribution, metabolism, and pharmacokinetics in rats and its ability to detect liver fibrosis in two rodent models.Methods
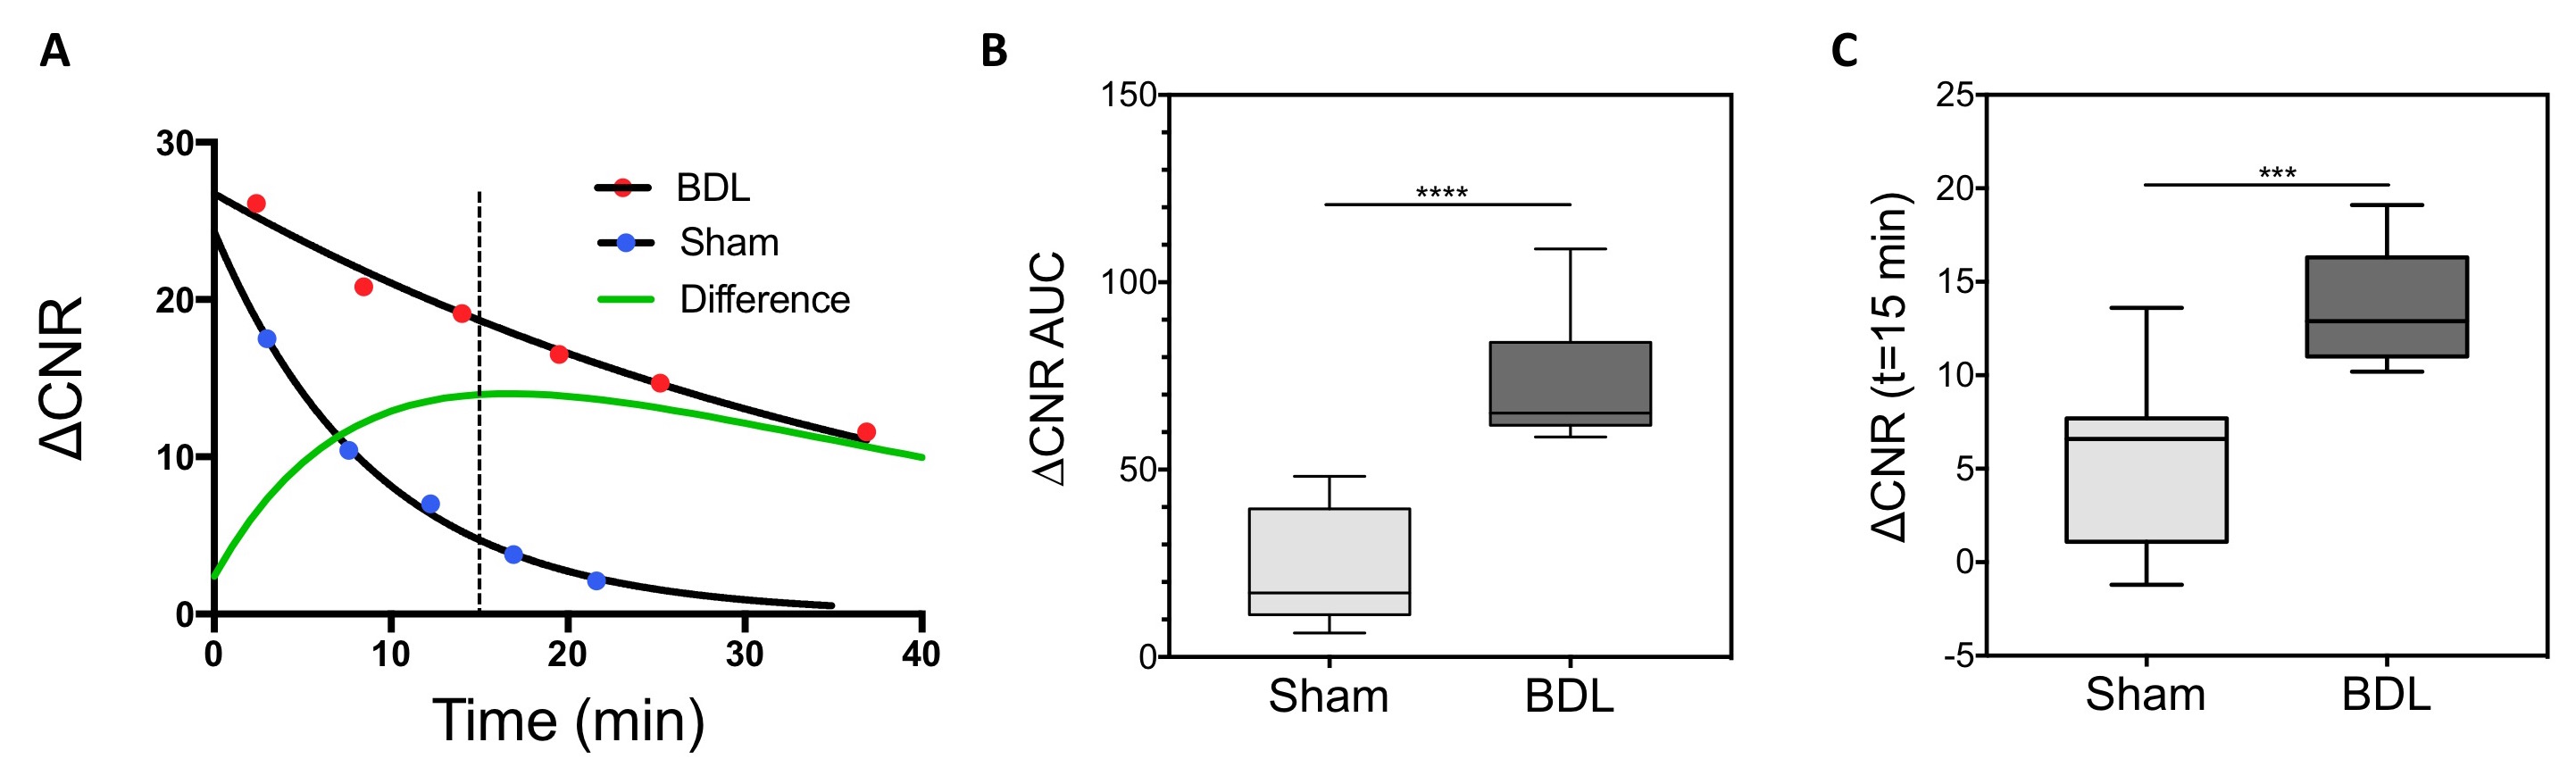
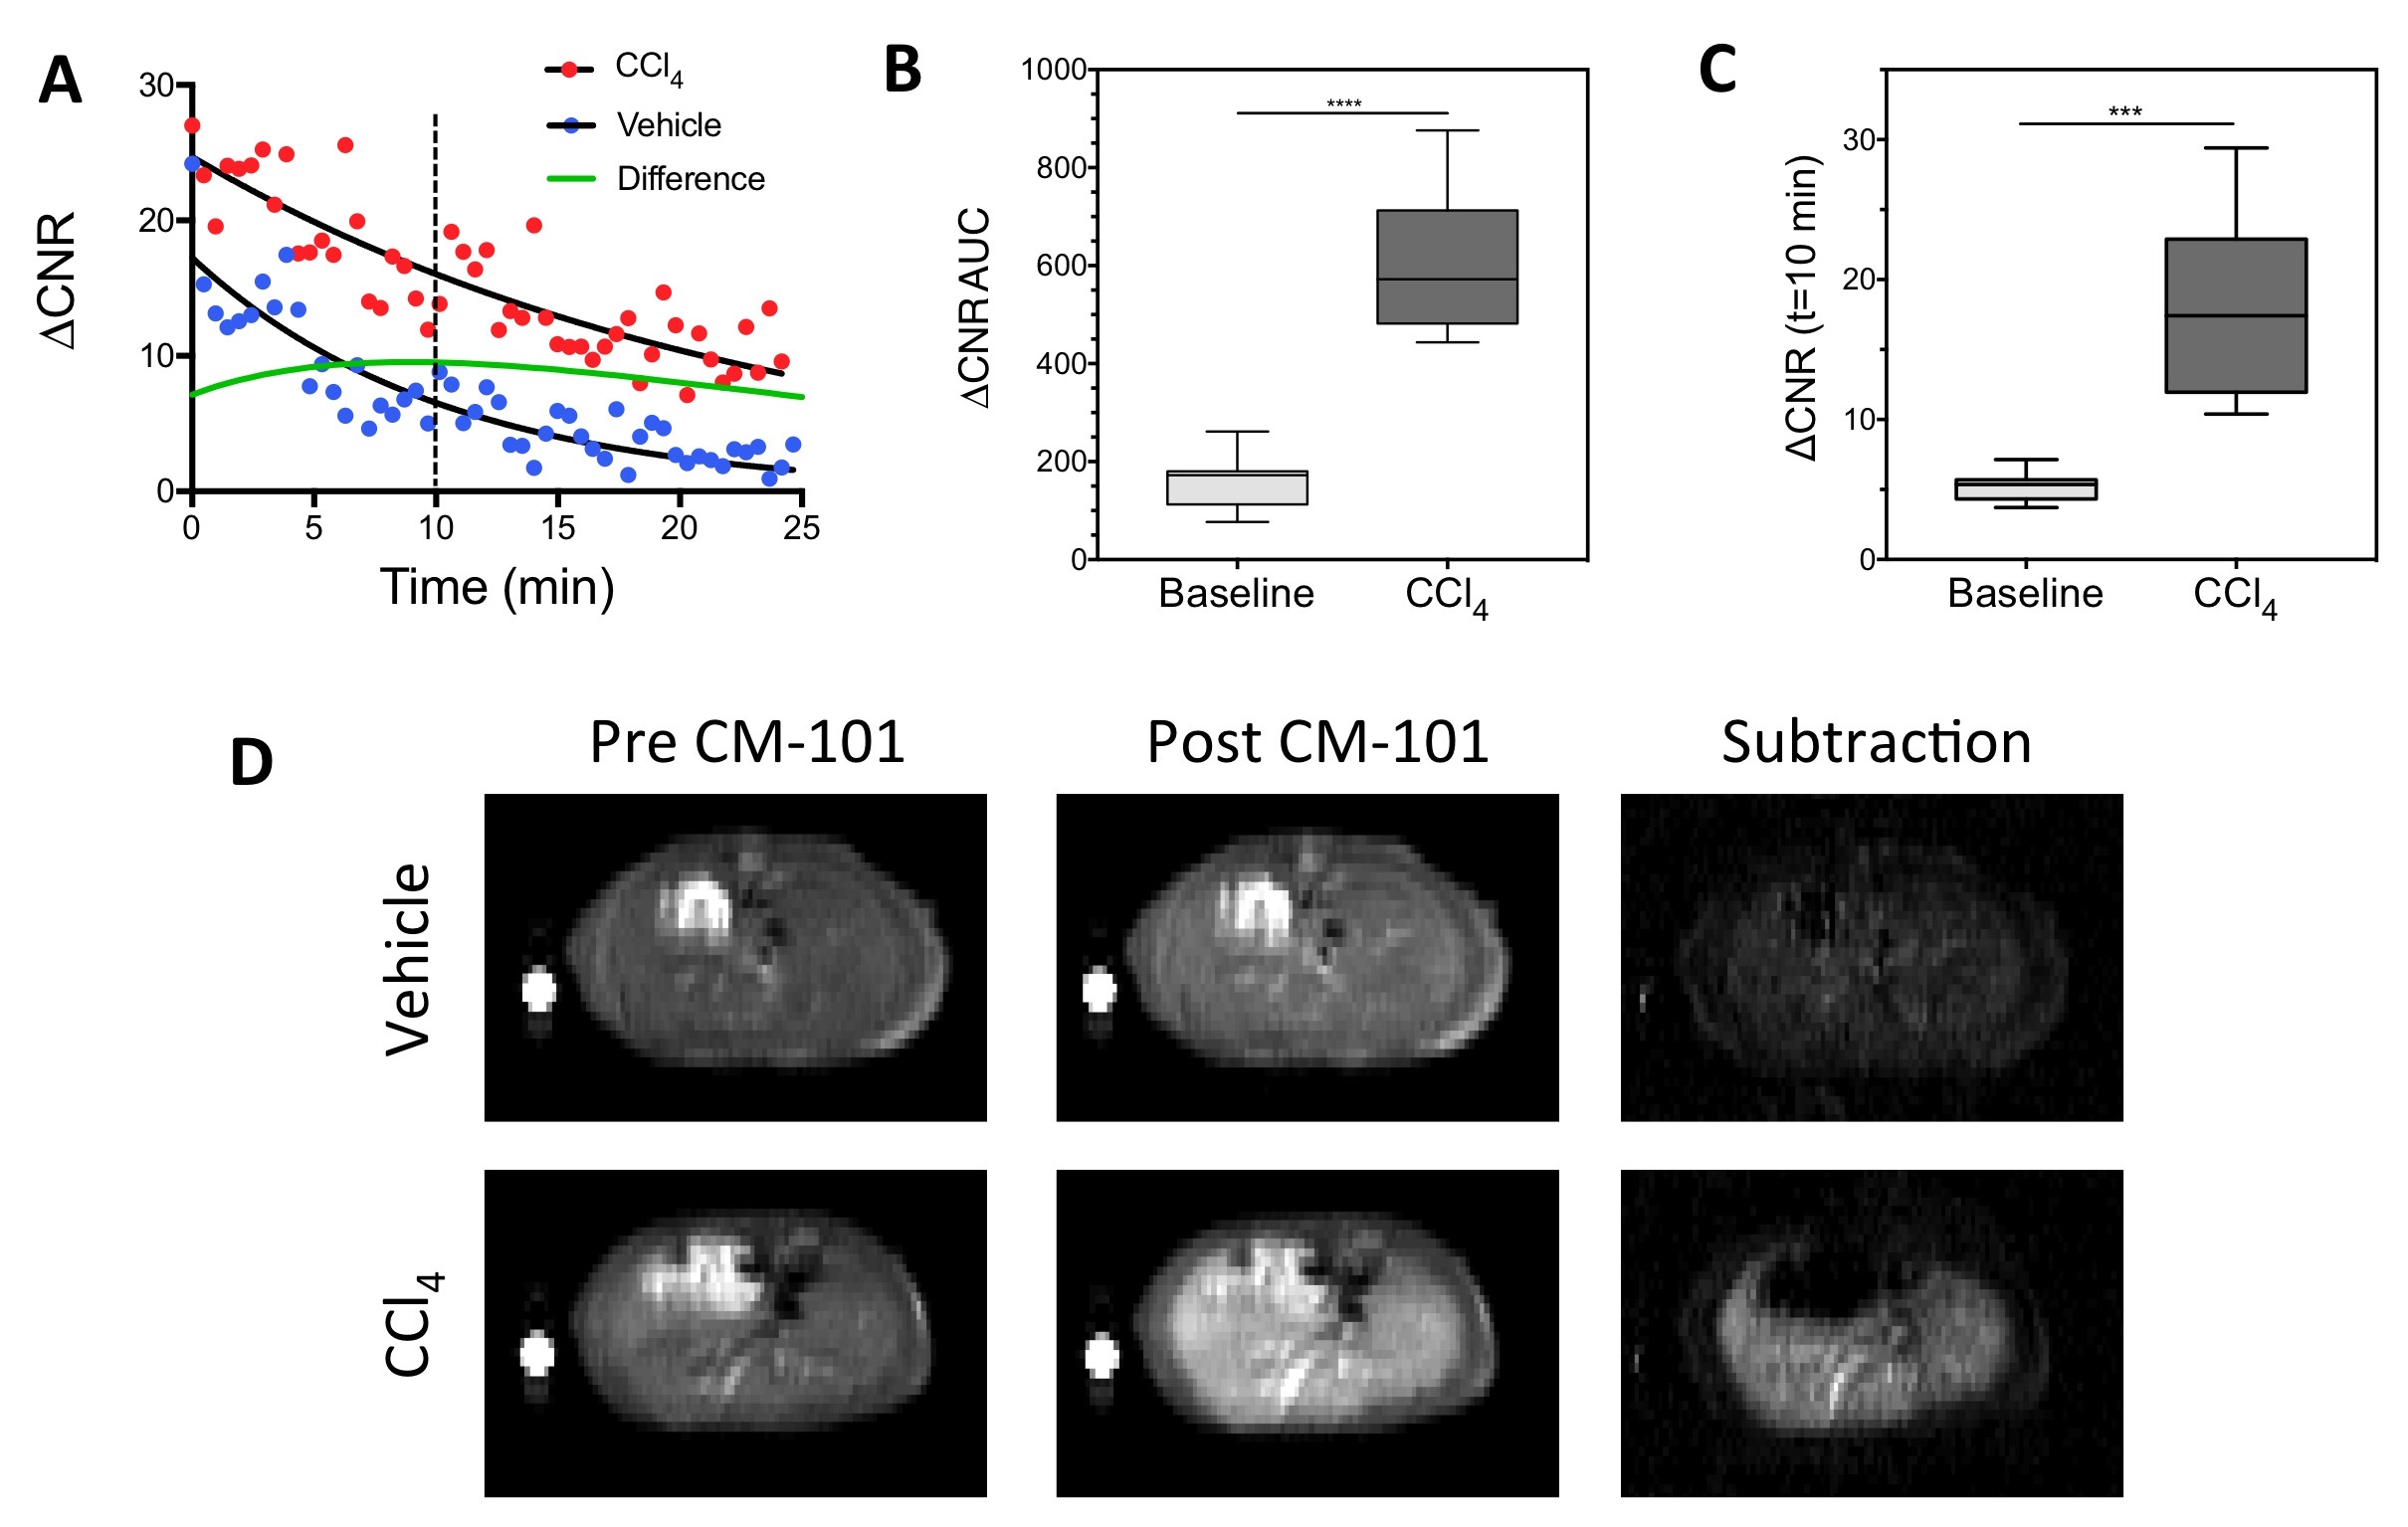
The Gd biodistribution of CM-101 was measured by inductively coupled plasma (ICP) mass spectrometry (MS) in ex vivo rat tissue at 1 and 14 days post CM-101 injection. Blood plasma was sampled over a 2-hour time period following CM-101 injection and the samples were analyzed by HPLC-ICP-MS to quantify CM-101 and any metabolites. Rats underwent bile duct ligation (BDL) or a sham procedure and were imaged using a 1.5 Tesla clinical scanner on day 19 following the procedure. Mice were treated with carbon tetrachloride (CCl4) or vehicle 3 times/week for 10 weeks and were imaged using a 7.0 Tesla small-bore scanner at baseline and at 1 week following the last CCl4 treatment. Animals were imaged before and after injection of 10 µmol/kg CM-101. The dynamic changes in contrast-to-noise ratio (ΔCNR) between liver and muscle tissue following CM-101 injection were used to quantify liver fibrosis. Liver tissue was subjected to pathologic scoring of fibrosis and analyzed for Sirius Red staining and hydroxyproline content.Results and Discussion
CM-101 demonstrated rapid blood clearance (t1/2=6.1 min) and exclusive renal elimination in rats with little evidence of probe metabolism in blood plasma. Biodistribution showed low levels of Gd remaining at 24-hours and 10-fold lower levels at 14 days after CM-101 injection with no accumulation in bone. Liver-to-muscle ΔCNR and the area under the dynamic ΔCNR curve (AUC) were both significantly higher in BDL rats compared to sham rats (Fig 1) and also in the CCl4 treated mice compared to baseline values (Fig 2). The AUC correlated significantly with ex vivo quantification of both liver collagen staining and liver hydroxyproline content.Conclusions
CM-101 accurately discriminated liver fibrosis in two animal models at two different imaging field strengths. The high chemical stability, fast blood clearance, and whole body elimination of CM-101 coupled with robust fibrosis imaging suggest CM-101 is a suitable candidate for clinical translation.Acknowledgements
This work was supported by the National Institutes of Health (R44-DK095617 and R01-DK104956).References
1. Caravan P, Das B, Dumas S, Epstein FH, Helm PA, Jacques V, Koerner S, Kolodziej A, Shen L, Sun WC, Zhang Z. Collagen-targeted MRI contrast agent for molecular imaging of fibrosis. Angewandte Chemie 2007;46(43):8171-8173.
2. Polasek M, Fuchs BC, Uppal R, Schuhle DT, Alford JK, Loving GS, Yamada S, Wei L, Lauwers GY, Guimaraes AR, Tanabe KK, Caravan P. Molecular MR imaging of liver fibrosis: a feasibility study using rat and mouse models. Journal of hepatology 2012;57(3):549-555.
3. Fuchs BC, Wang H, Yang Y, Wei L, Polasek M, Schuhle DT, Lauwers GY, Parkar A, Sinskey AJ, Tanabe KK, Caravan P. Molecular MRI of collagen to diagnose and stage liver fibrosis. Journal of hepatology 2013;59(5):992-998.
4. Farrar CT, DePeralta DK, Day H, Rietz TA, Wei L, Lauwers GY, Keil B, Subramaniam A, Sinskey AJ, Tanabe KK, Fuchs BC, Caravan P. 3D molecular MR imaging of liver fibrosis and response to rapamycin therapy in a bile duct ligation rat model. Journal of hepatology 2015;63(3):689-696.
5. Marckmann P, Skov L, Rossen K, Dupont A, Damholt MB, Heaf JG, Thomsen HS. Nephrogenic systemic fibrosis: suspected causative role of gadodiamide used for contrast-enhanced magnetic resonance imaging. J Am Soc Nephrol 2006;17(9):2359-2362.
Figures