0562
Occupational Manganese Exposure: Reversibility of Increased GABA Levels and Brain Mn Accumulation1School of Health Sciences, Purdue University, West Lafayette, IN, United States, 2Department of Neurology, Indiana University School of Medicine, Indianapolis, IN, United States
Synopsis
While manganese (Mn) is known in the pre-clinical community as a T1 contrast agent, it is also notorious as a neurotoxin that can cause irreversible parkinsonian symptoms at high enough exposure levels. In an occupational setting, workers are exposed to Mn through processes such as welding, smelting, and other metalwork. As the workload changes over time, so does the level of exposure. Using MRI and MRS, effects of exposure such as elevated thalamic GABA levels and brain Mn deposition can be detected and show evidence of reversibility. This may help identifying meaningful no-observed-adverse-effect levels (NOAEL) as used in occupational settings.
Purpose
We have shown previously in cross-sectional studies that increases of gamma-aminobutyric acid (GABA) in the thalamus were not only associated with motor function scores, but also with Mn exposure over the past 3 months as well as Mn concentration in the substantia nigra (SN), as measured by the R1 relaxation rate in MRI1. Yet, it is unknown whether exposure directly affects these measurements. If exposure decreases, will these also drop? As part of a longitudinal cohort study, MRI is being used to study whether changes occur with variations in Mn exposure levels.Methods
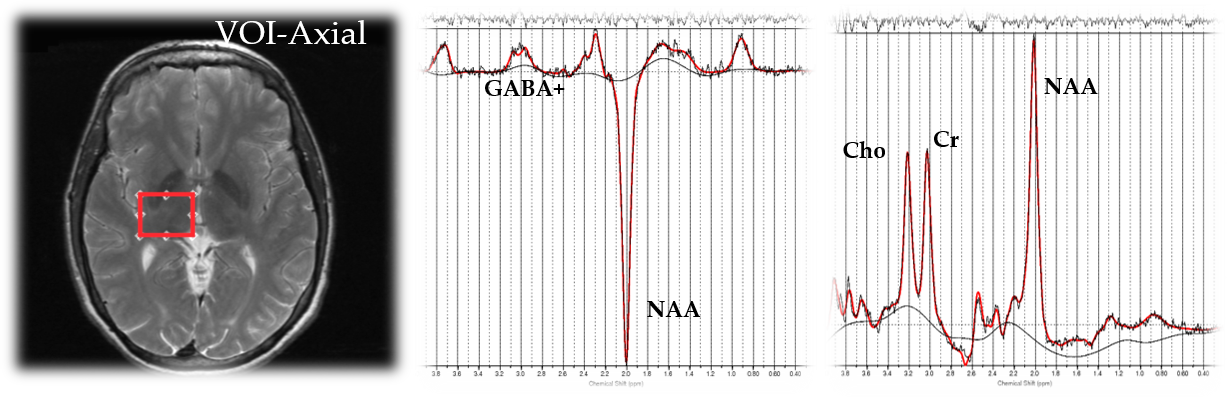
Of our longitudinal cohort, 15 welders and 5 controls have participated in both time points (2013 and 2015). The sub-section of subjects allows us to analyze the dose-response and time-dependence of effects from low rates of exposure to Mn. Individual exposure levels were calculated using an exposure model developed in our group to assess respirable (<4µm) Mn exposure from welding, both at and outside of work. The model uses personal air samples acquired during a typical shift and the work history, weighted by modifying factors from a detailed work history questionnaire to give a better estimate of an individual’s cumulative exposure over the past 3 months before the imaging session2. A 3T GE Signa MRI scanner (GE Healthcare) with an 8-channel head coil was used to obtain 3D high resolution T1-weighted images (resolution: 1x1x1.7mm) and two spoiled gradient echo images3 used to calculate R1. GABA-edited spectra were obtained using MEGA-PRESS localization (TE=68ms, TR=2000ms, 256 averages)4. A volume of interest (VOI, 25x30x25mm) was centered on the right thalamus (Figure 1). Spectra were analyzed using LCModel V6.3-1B5. GABA was corrected for cerebrospinal fluid using 3D T1-weighted images. Statistics were performed using the R environment. To assess relatedness between two variables, Pearson’s product-moment correlation test was used, while to test differences between two groups, Welch's two-sample t-tests were used.Results
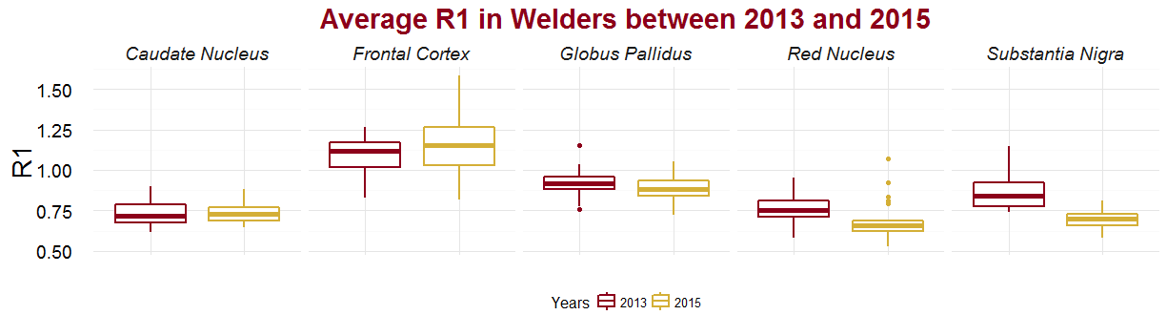
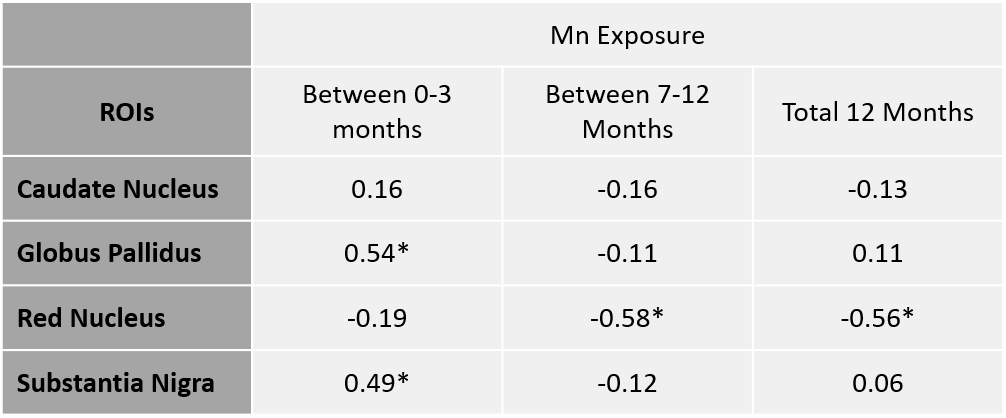
Manganese exposure dropped from an average of 0.036 mg/m3*yr to 0.017 mg/m3*yr (p = 0.02) between 2013 and 2015. We monitored and measured Mn exposure at different job sites to ensure our model remains reliable. Of the 15 welders that have participated in Round 2, 3 have had increased Mn exposure since Round 1, while the rest have seen their exposure subside. The mean longitudinal relaxation rate (R1), indicative of brain Mn accumulation, decreased from 2013 to 2015 in SN (p<0.0001) (Figure 2). The globus pallidus (GP) & red nucleus (RN) also had negative trends, while R1 in the caudate nucleus and frontal cortex held steady. When controlling for age of the subjects, associations were found between the change in Mn exposure and the change in R1 (R1) in regions of the brain (Table 1), confirming that the amount of Mn exposure determines the amount of Mn accumulation in particular regions of the brain. While R1 in the GP and SN were positively correlated with Mn exposure, the RN was negatively correlated with Mn exposure over longer time frames (past year).
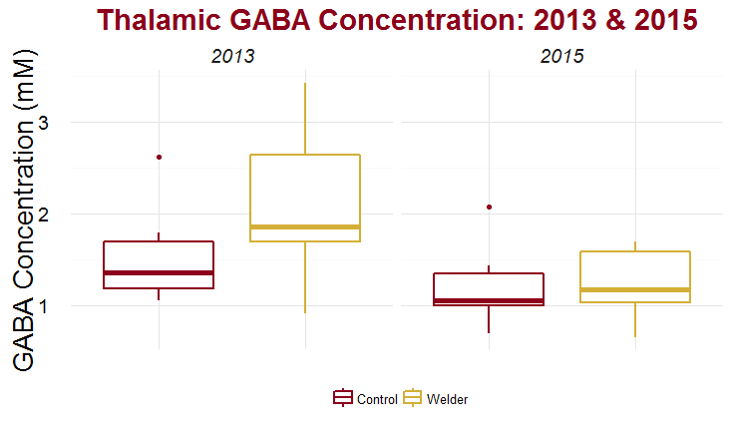
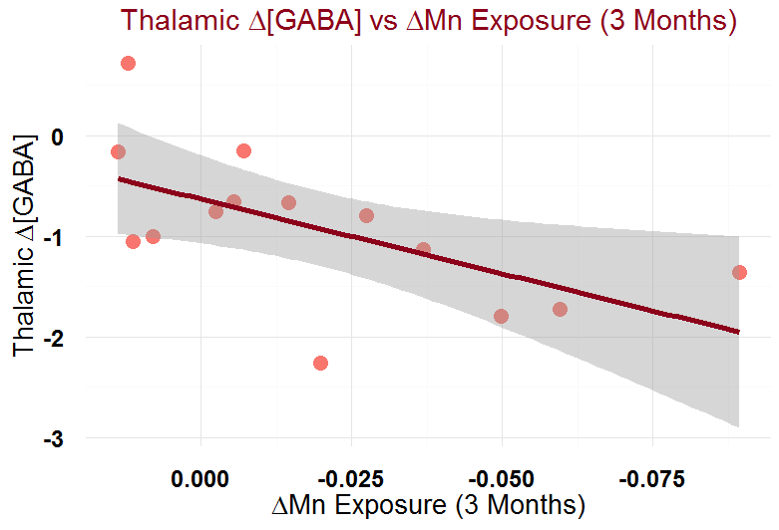
GABA levels represent a change in the overall inhibition capacity of the region. In the thalamus, GABA levels of welders were distinguishable from controls (p = 0.08) in 2013, but are no longer distinguishable from controls in 2015 (p = 0.96) (Figure 3). The GABA (2015 minus 2013 levels) were significantly different between welders and controls (p=0.02). GABA, though, is significantly correlated with Mn exposure (r = 0.59, p = 0.02) (Figure 4).
Discussion & Conclusions
Our results show that Magnetic Resonance has great promise in monitoring pre-symptomatic effects on the brain from low levels of Mn exposure. Previously, we have shown that GABA was significantly higher in highly exposed welders compared to controls6. Now, after some welders have begun to perform work with less breathable Mn, their GABA levels have subsided. Along with this, unsurprisingly, we find R1 values to also follow the same trend by decreasing with lower Mn exposure. Coincidentally, we triggered a “Heisenberg effect” after observing some of our subjects with MRI in the first session in 2013: many welders admitted to us that they decided to be safer and wear respiratory protection after participating in the first study session, contributing to our overall lower exposure levels in 2015. In conclusion, these results show that Mn accumulation and its effects on brain GABA levels reverses over time and is proportional to the amount of excess Mn being taken in through occupational means.Acknowledgements
The study was supported by NIEHS grant R01 ES020529.References
1. Long Z, Li X-R, Xu J, et al. Thalamic GABA Predicts Fine Motor Performance in Manganese-Exposed Smelter Workers. Missirlis F, ed. PLoS One. 2014;9(2):e88220. doi:10.1371/journal.pone.0088220.
2. Hobson A, Seixas N, Sterling D, Racette BA. Estimation of particulate mass and manganese exposure levels among welders. Ann Occup Hyg. 2011;55(1):113-125. doi:10.1093/annhyg/meq069.
3. Deoni SCL. High-resolution T1 mapping of the brain at 3T with driven equilibrium single pulse observation of T1 with high-speed incorporation of RF field inhomogeneities (DESPOT1-HIFI). J Magn Reson Imaging. 2007;26(4):1106-1111. doi:10.1002/jmri.21130.
4. Zhu H, Edden R a E, Ouwerkerk R, Barker PB. High resolution spectroscopic imaging of GABA at 3 Tesla. Magn Reson Med. 2011;65(3):603-609. doi:10.1002/mrm.22671.
5. Provencher SW. Estimation of metabolite concentrations from localized in vivo proton NMR spectra. Magn Reson Med. 1993;30(6):672-679. doi:10.1002/mrm.1910300604.
6. Dydak U, Jiang Y, Long L, et al. In vivo measurement of brain GABA concentrations by magnetic resonance spectroscopy in smelters occupationally exposed to manganese. Environ Health Perspect. 2011;119(2):219-224.
Figures