0561
A new method for measuring T$$$_{1\rho}$$$ of hyperpolarized radioactive isotopes using gamma rays1Department of Physics, University of Virginia, Charlottesville, VA, United States, 2UIH America, Houston, TX, United States, 3Radiology and Medical Imaging, University of Virginia, Charlottesville, VA, United States
Synopsis
We have developed a novel technique that combines MR and gamma detection for measuring T1ρ of radioactive isotopes. Gamma-ray emission is anisotropic with respect to the polarization direction of hyperpolarized radioactive nuclei (spin>1/2). When the spins are flipped into the transverse plane and subjected to a spin-locking field, the emission anisotropy also precesses and gamma detectors in the transverse plane will observe an oscillating count rate. Decay of the oscillation amplitude during SL can be used to fit T1ρ. This technique also vastly reduces the number of spins needed for a meaningful measurement since gamma-ray detection is highly efficient.
Introduction
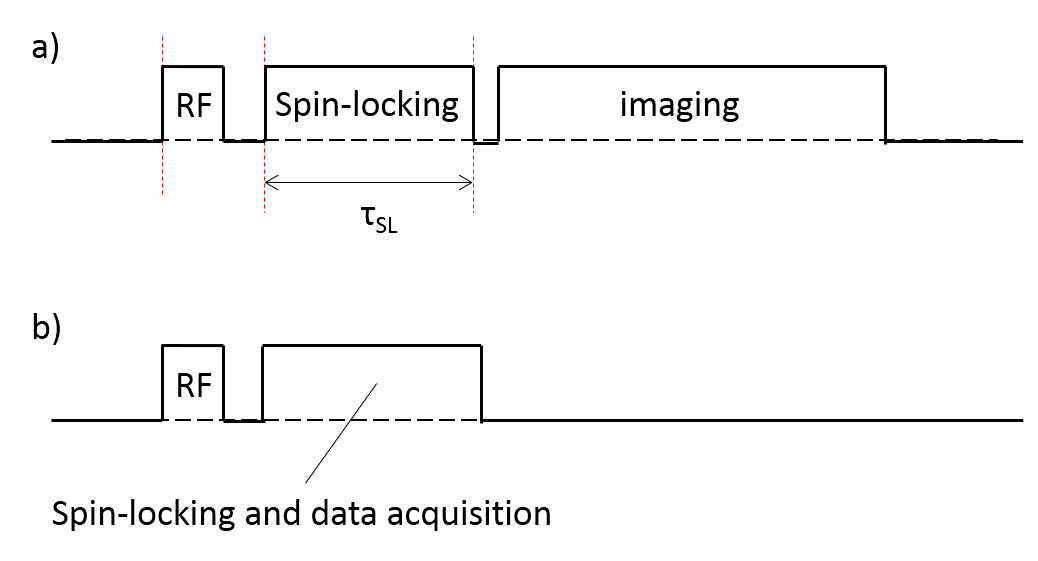
T1ρ is the time constant that characterizes the spin-lattice relaxation in the rotating frame under a spin-locking (SL) RF field. It has been shown to provide useful contrast for detecting cartilage degeneration1, Alzheimer’s disease2, as well as evaluating high intensity focused ultrasound tumor treatment3. The typical way of measuring T1ρ includes a magnetization-preparation step4. The spin magnetization is first flipped into the transverse plane, and then subjected to a long SL-RF pulse parallel to the magnetization in the rotating frame, during which the magnetization undergoes T1ρ relaxation. After the SL-RF pulse, the magnetization is flipped back to the longitudinal direction, and an image is acquired. In order to measure T1ρ, this procedure needs to be repeated with different durations of the SL-RF pulse, and T1ρ can be determined by fitting the signal intensities to an exponential decay. Recently, our group has reported a novel method for spectroscopy and imaging that combines gamma-ray detection and magnetic resonance5, which makes it possible to measure MR signals from vastly fewer number of spins by using high efficiency gamma-ray detection. Here we extend this idea and demonstrate a technique that can measure T1ρ of trace amounts of radioactive isotopes using a simple pulse sequence.Theory
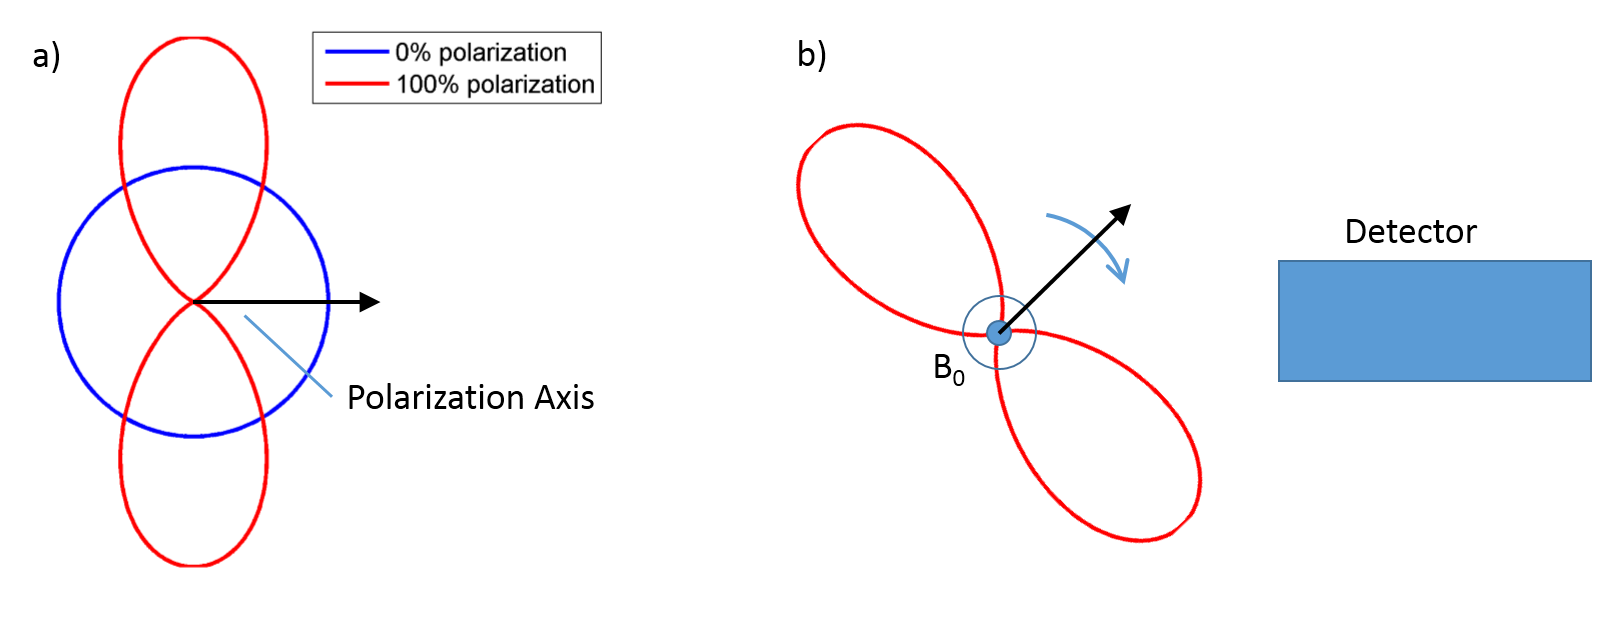
Gamma emission of oriented radioactive nuclei (with spin > 1/2) is anisotropic and in many cases can be described by: $$$W(\theta_r)=a_0+a_2\cos{2\theta_r}$$$ (Eq. 1), where W(θr) is the relative probability that a gamma ray will be emitted at an angle θr with respect to the spin polarization direction. The coefficients an depend on the specific gamma transition being observed, as well as the degree of nuclear polarization. Fig. 1a shows the angular distribution of 164 keV gamma rays emitted from the metastable isotope 131mXe. If the spin orientation is flipped into the transverse plane and then subjected to a SL-RF pulse, the asymmetric gamma emission distribution will rotate together with the spin orientation, causing an oscillating count rate in a gamma-ray detector oriented in the transverse plane. Since the applied RF field does not interfere with the detection of gamma rays, these oscillations can be observed in real time, obviating the need for repeated magnetization preparation. During T1ρ decay, the gamma emission anisotropy decreases with the nuclear spin polarization (|a0| increases, |a2| decreases), so the amplitude of the count-rate oscillation decays, which can be used to characterize T1ρ (Fig. 2).Methods
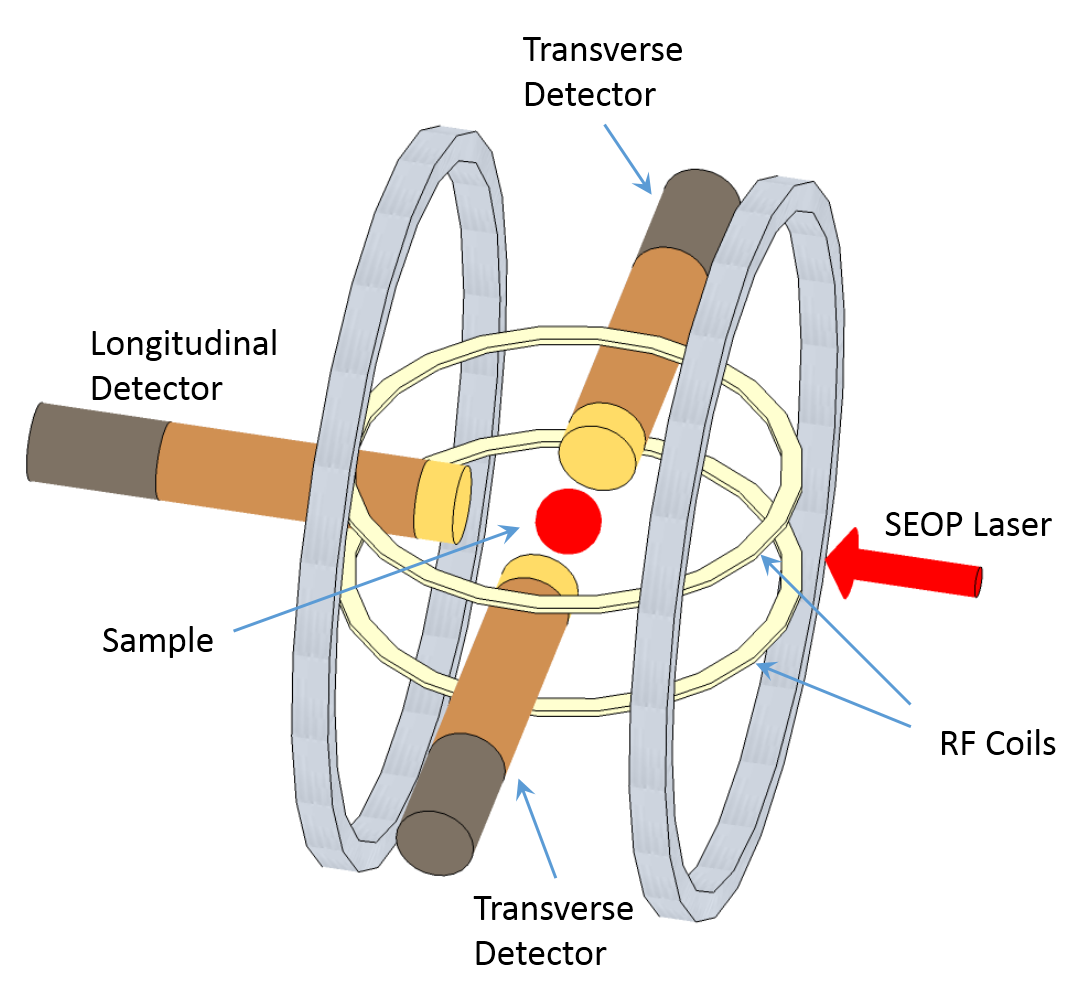
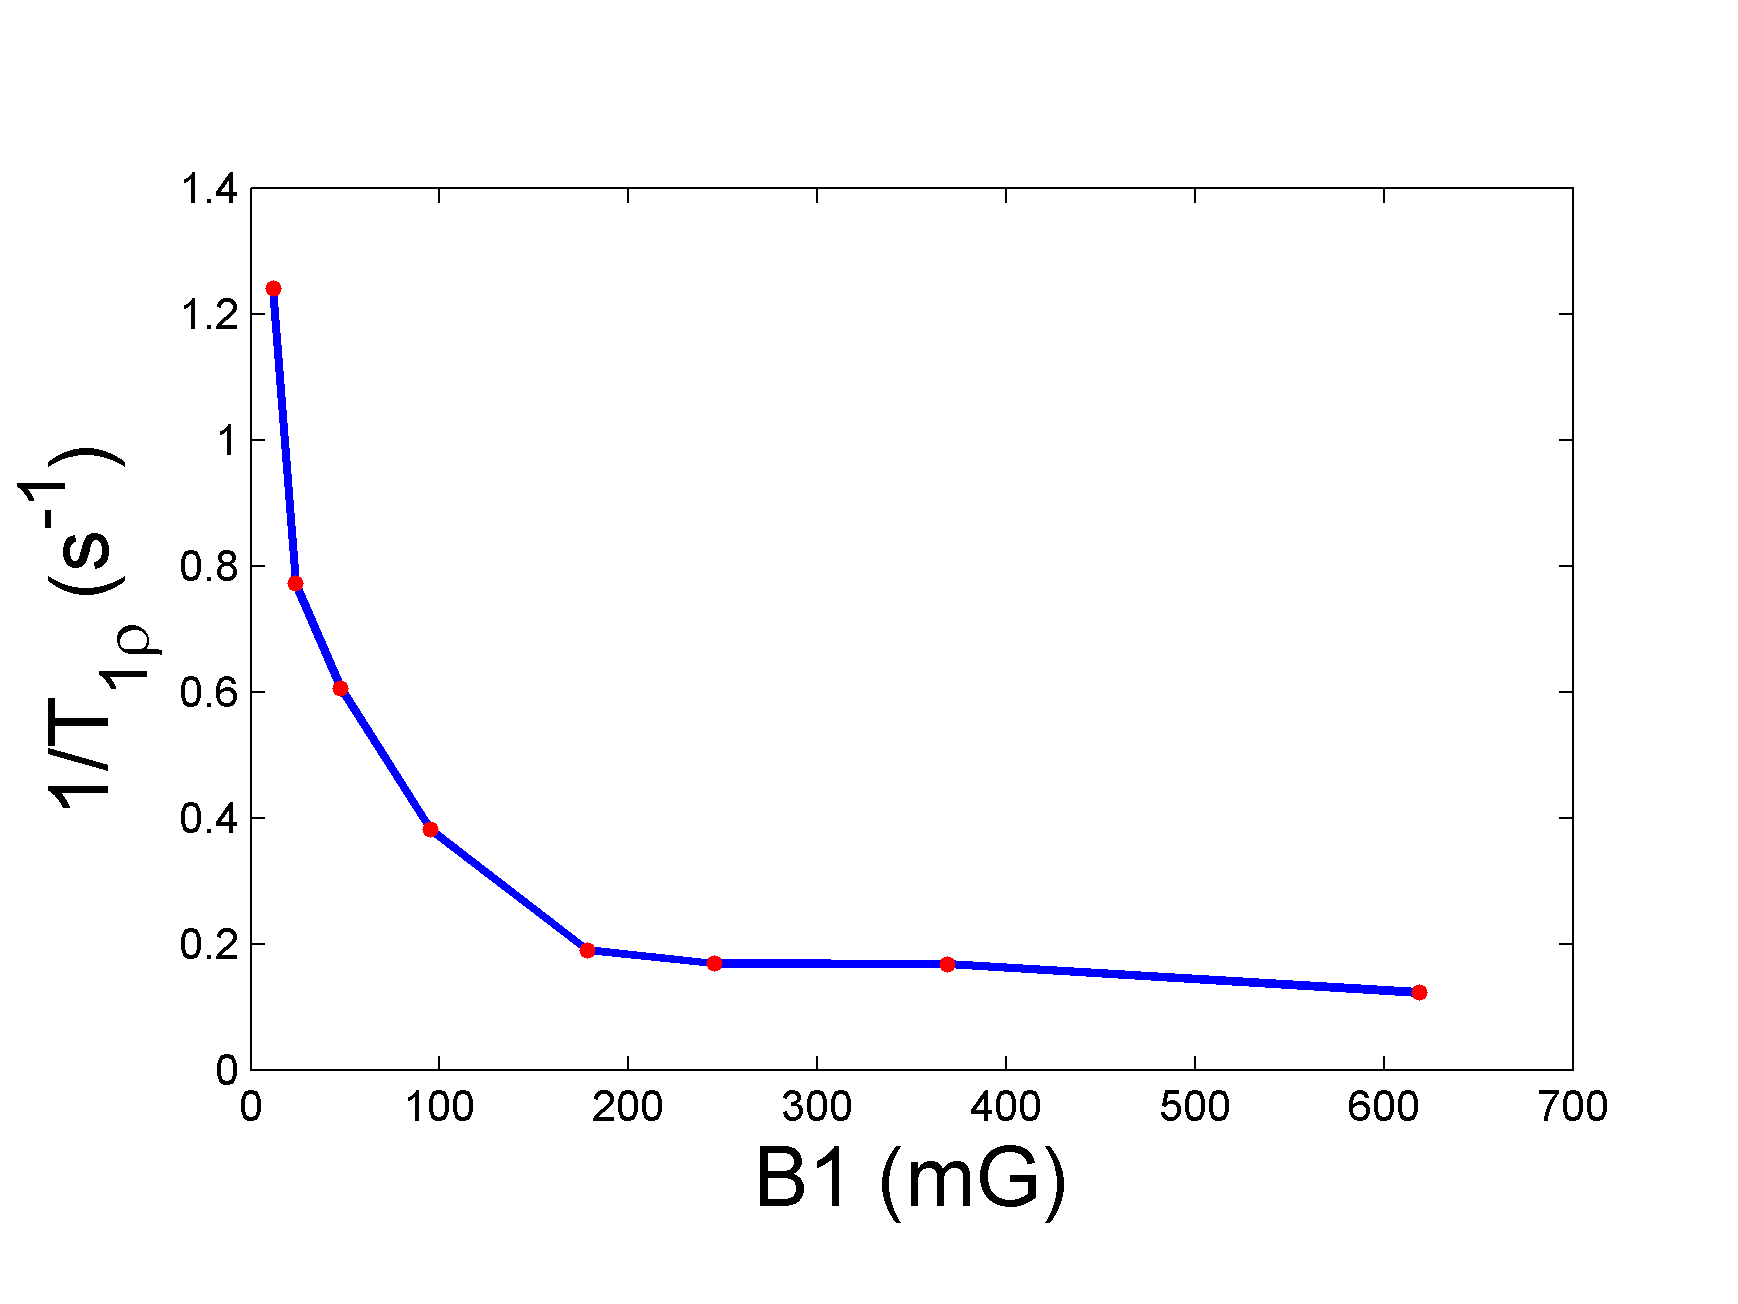
A 2.5-cm diameter glass sphere containing ~0.07 mCi 131mXe (spin 11/2, gyromagnetic ratio = 137 Hz/Gauss) was used for this study. The experiment was performed using a homemade system which combined a low-field (~7 Gauss) MRI scanner6 with a gamma detection setup (Fig. 3). The 131mXe Larmor frequency was ~970 Hz. Nuclear spin of 131mXe was first polarized to ~55% using spin-exchange optical pumping. A non-selective 90° RF pulse was applied, and a low-amplitude, in-phase SL-RF field was then broadcast continuously for 15 s, during which the gamma-ray count rates in the transverse detectors were recorded (166 kHz sampling rate). Due to the very small amount of activity in our sample, the polarization/data acquisition cycle was repeated 177 times to improve the counting statistics. The gamma count rates from all averages and both transverse detectors were summed, rebinned to 0.1 s blocks, and then mixed down to a low frequency. T1ρ was determined by fitting the data to an exponential decay model. We measured T1ρ with different SL-RF field strengths (12, 24, 47, 95, 178, 245, 369, and 619 mG) to generate a dispersion curve.Results
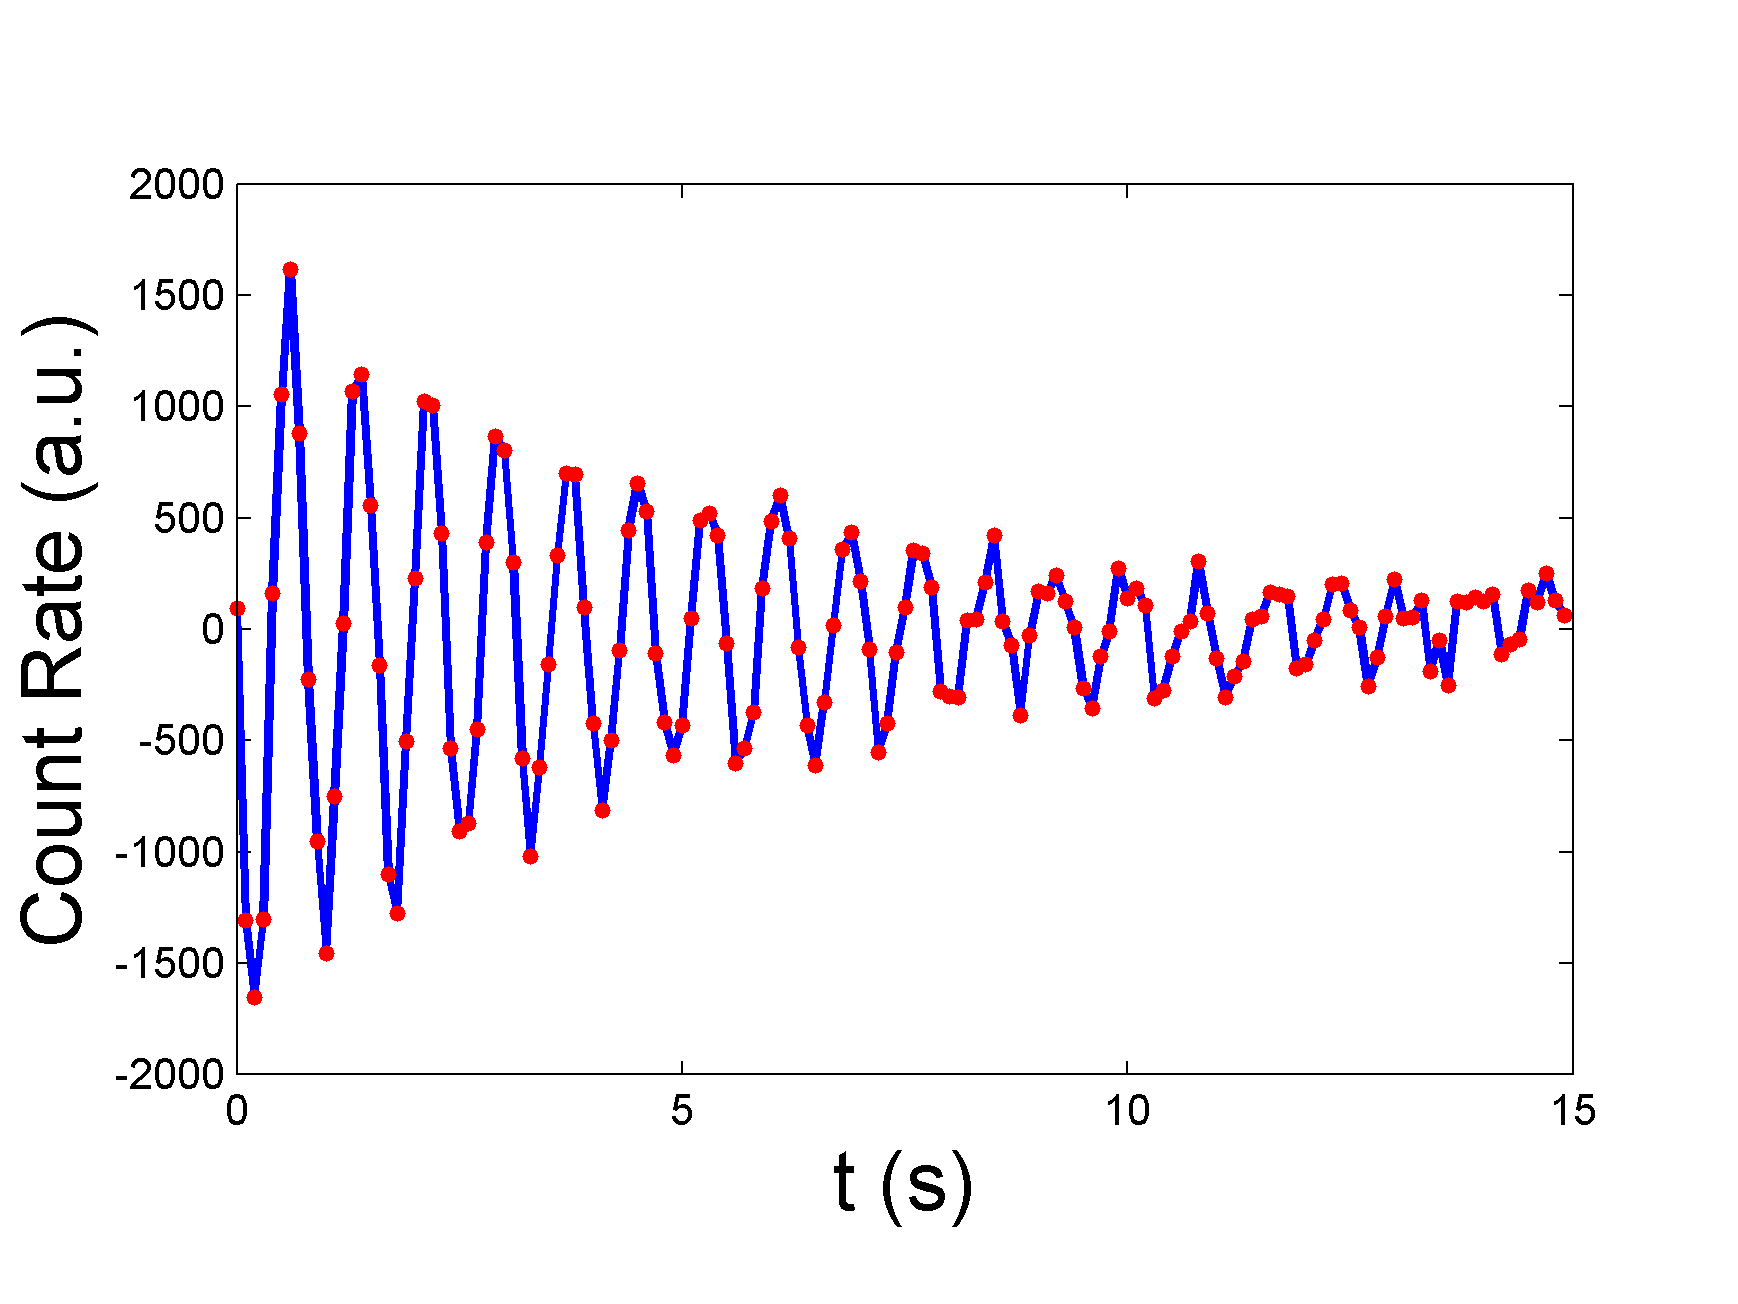
Fig. 4 shows the count rate decay during SL (178 mG), and the fit value of T1ρ was 5.2 s. In comparison, T1 was measured to be ~84 s in a separate measurement. The T1ρ dispersion curve is shown in Fig. 5. As expected, the relaxation rate (1/ T1ρ) decreases as the locking field becomes stronger. This entire measurement was performed using less than 3×10¹² atoms of 131mXe. In comparison, at least 1015 protons are needed to produce a barely measurable electromagnetic signal7.Conclusion
We have developed a novel technique for measuring T1ρ of radioactive isotopes using the gamma emission anisotropy of hyperpolarized nuclei, which directly measures the decay of gamma-ray count rate oscillation amplitude while the SL-RF is on. Since gamma-ray detection is much more sensitive than conventional electromagnetic signal detection, this technique also vastly reduces the number of nuclear spins needed for a meaningful measurement, and might lead to a high-sensitivity medical diagnostic technique.Acknowledgements
The authors would like to thank The Ivy Biomedical Innovation Fund at the University of Virginia for its support of this project.
References
1. Regatte RR, Akella SV, Lonner JH, Kneeland JB, Reddy R. T1ρ relaxation mapping in human osteoarthritis (OA) cartilage: comparison of T1ρ with T2. J Magn Reson Imaging. 2006 Apr;23(4):547-53.
2. Haris M, Yadav SK, Rizwan A, Singh A, Cai K, Kaura D, Wang E, Davatzikos C, Trojanowski JQ, Melhem ER, Marincola FM, Borthakur A. T1ρ MRI and CSF biomarkers in diagnosis of Alzheimer's disease. Neuroimage Clin. 2015 Feb 26;7:598-604.
3. Hectors SJ1, Moonen RP, Strijkers GJ, Nicolay K. T1ρ mapping for the evaluation of high intensity focused ultrasound tumor treatment. Magn Reson Med. 2015 Apr;73(4):1593-601.
4. Ravinder Reddy. T1ρ imaging: Techniques and Basis for Image Contrast. ISMRM, 2010.
5. Yuan Zheng, G. Wilson Miller, William A. Tobias and Gordon D. Cates. A method for imaging and spectroscopy using γ-rays and magnetic resonance. Nature. 2016 Sep;537:652–655.
6. Zheng Y, Cates GD, Tobias WA, Mugler JP, Miller GW. Very-low-field MRI of laser polarized xenon-129. J Magn Reson. 2014 Oct 17;249C:108-117.
7. Callaghan
P. Principles of Nuclear Magnetic Resonance Microscopy. Oxford University
Press, 1991.
Figures