0560
In vivo pH imaging using hyperpolarized 13C-labelled zymonic acid1Department of Nuclear Medicine, Technical University of Munich, Munich, Germany, 2Department of Chemistry, Technical University of Munich, Garching, Germany, 3Institute of Medical Engineering, Technical University of Munich, Garching, Germany, 4Medical Research Council Laboratory of Molecular Biology, Cambridge, United Kingdom
Synopsis
Pathologies which overrule natural pH regulatory mechanisms such as ischemia, inflammation or tumors can trigger local pH changes in the human body. Currently, clinical routine measurement of extracellular pH is limited to measuring systemic blood pH. We synthesized, characterized, calibrated and applied [1,5-13C2]zymonic acid (ZA) as a novel hyperpolarized 13C pH biosensor. With its demonstrated features both in vitro and in vivo (bladder, healthy kidney, Mat B III adenocarcinoma), we believe that ZA could help localize and quantify regions with aberrant acid-base balance, allowing for improved understanding, diagnostics and therapy of common diseases.
Introduction
Local pH changes in the human body are often triggered by pathologies that overrule natural pH regulatory mechanisms, such as ischemia, inflammation or tumors1-3. However, clinical routine measurement of pH is currently limited to measuring the systemic blood pH by blood gas analysis. A reliable and non-invasive pH imaging method could localize and quantify regions with aberrant acid-base balance, allowing for improved understanding, diagnostics and therapy of common diseases4. Although many non-invasive pH-imaging methods have been developed, only methods to measure the intracellular pH have successfully passed beyond preclinical studies. Here we report hyperpolarized [1,5-13C2]zymonic acid (ZA)5,6 as a novel sensor molecule for in vivo measurements of pH using 13C magnetic resonance imaging.Methods
ZA is synthesized from [1-13C]pyruvic acid in a one-step-synthesis, purified using reversed phase HPLC and freeze dried in vacuo. Its structure is confirmed using mass spectrometry (HR-MS-spectrum using a Thermo Finnigan LTQ-FT) and high-field NMR (14.1 T Avance III Bruker BioSpin). ZA is copolarized (Hypersense, Oxford Instruments) together with [13C]urea being used as a chemical shift reference and both are injected into phantoms in vitro either for calibration experiments or in order to test for the method's robustness. Hyperpolarized spectra and images are acquired on a 7T small animal MR scanner (GE/Agilent) with a 72 mm dual tuned 1H/13C birdcage coil for signal transmission and a two channel 13C flexible coil receive array (Rapid Biomedical). 1H images are acquired with a fast spin echo (FSE) sequence, 13C imaging experiments are performed using a free induction decay chemical shift imaging (FIDCSI) sequence (5 kHz bandwidth, 512 points, 16×16 nominal matrix size, 5 mm slice thickness, 6 cm FOV, 4° flip angle, 118 ms repetition time, 208 excitations, k-space sampled in centric order) and reconstructed by zero-filled Fourier transform in three dimensions in Matlab (MathWorks)7. Electrode pH values were recorded with a standard pH electrode (ProLab 4000, SI Analytics). Animals were anesthetized with 3-5% isoflurane. Tumors are induced by injecting 200 µL PBS containing 1×10⁶ Mat B III tumor cells subcutaneously into the right flank. Copolarized ZA and [13C]urea are injected in vivo directly into the rat bladder or via tail vain catheter before acquiring localized spectra. pH sensitive 13C chemical shift differences between the fitted ZA peak pair and urea are being used to back calculate up to three pH values per voxel on a voxel-by-voxel basis using a scaled logistic function.Results & Discussion
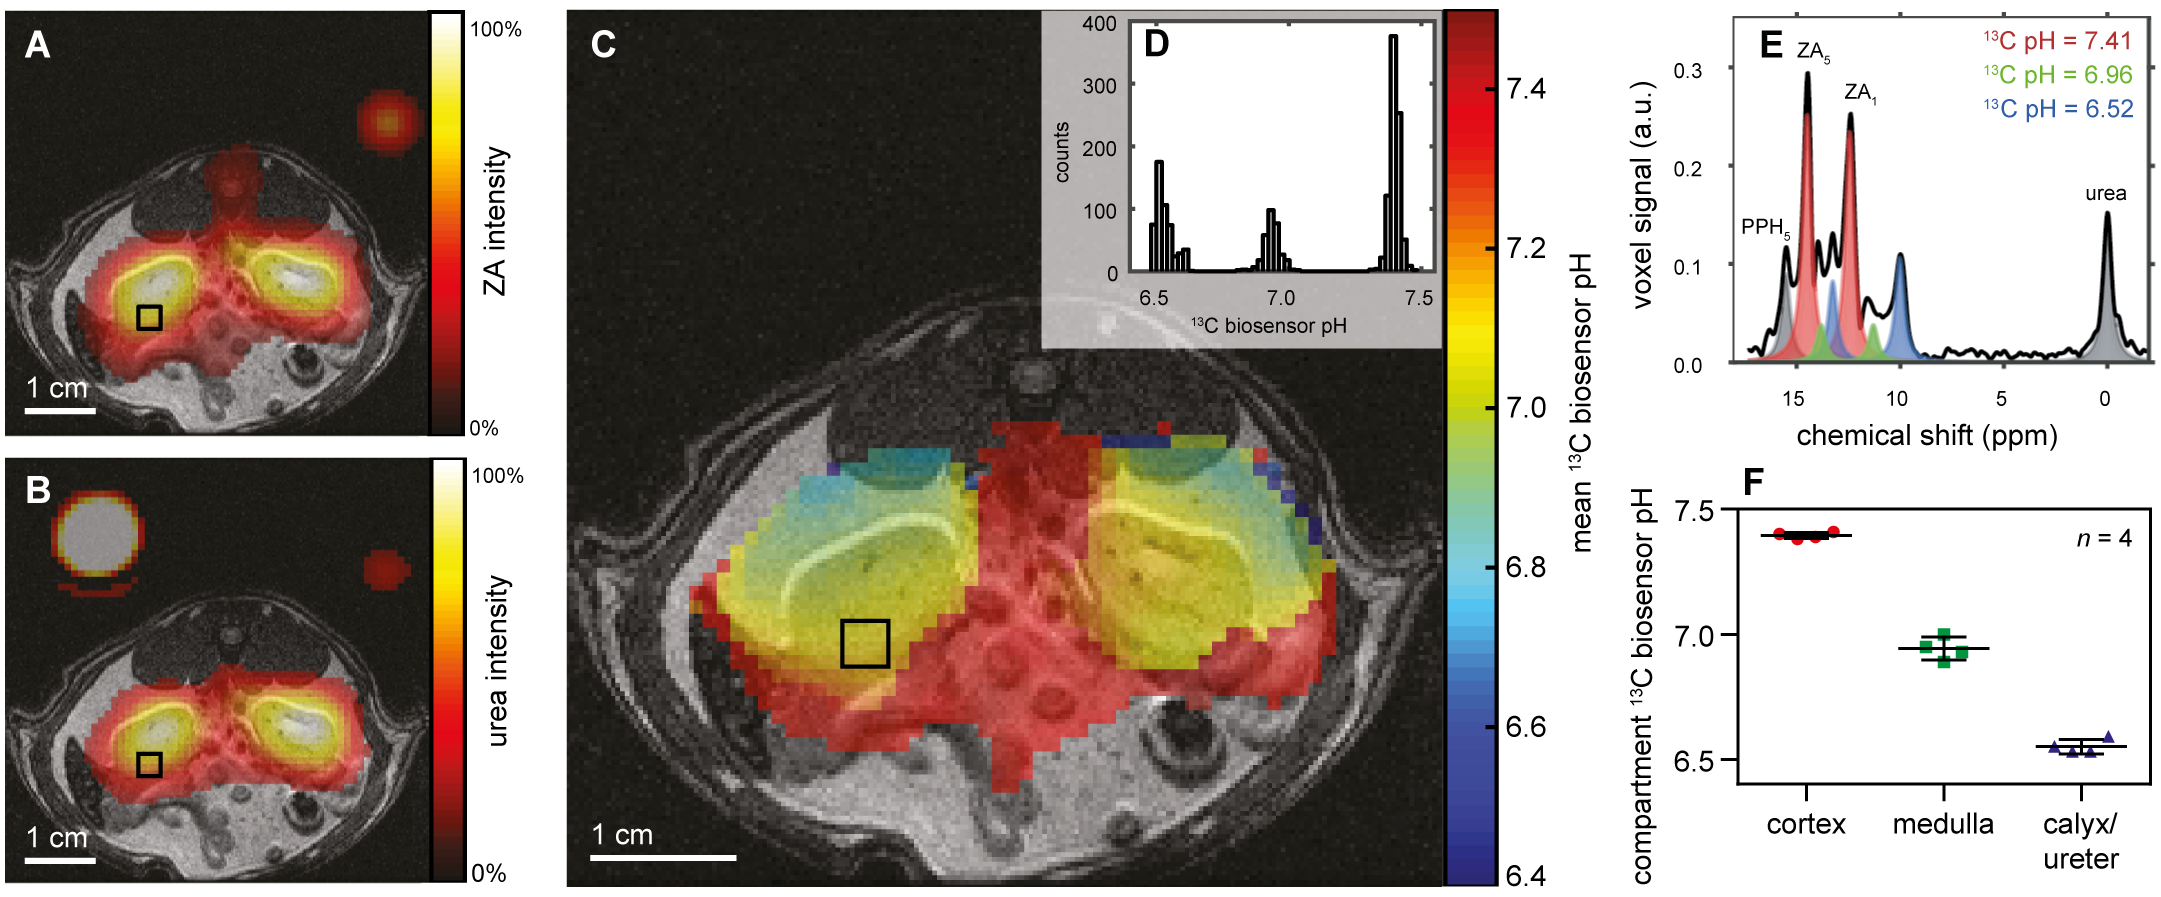
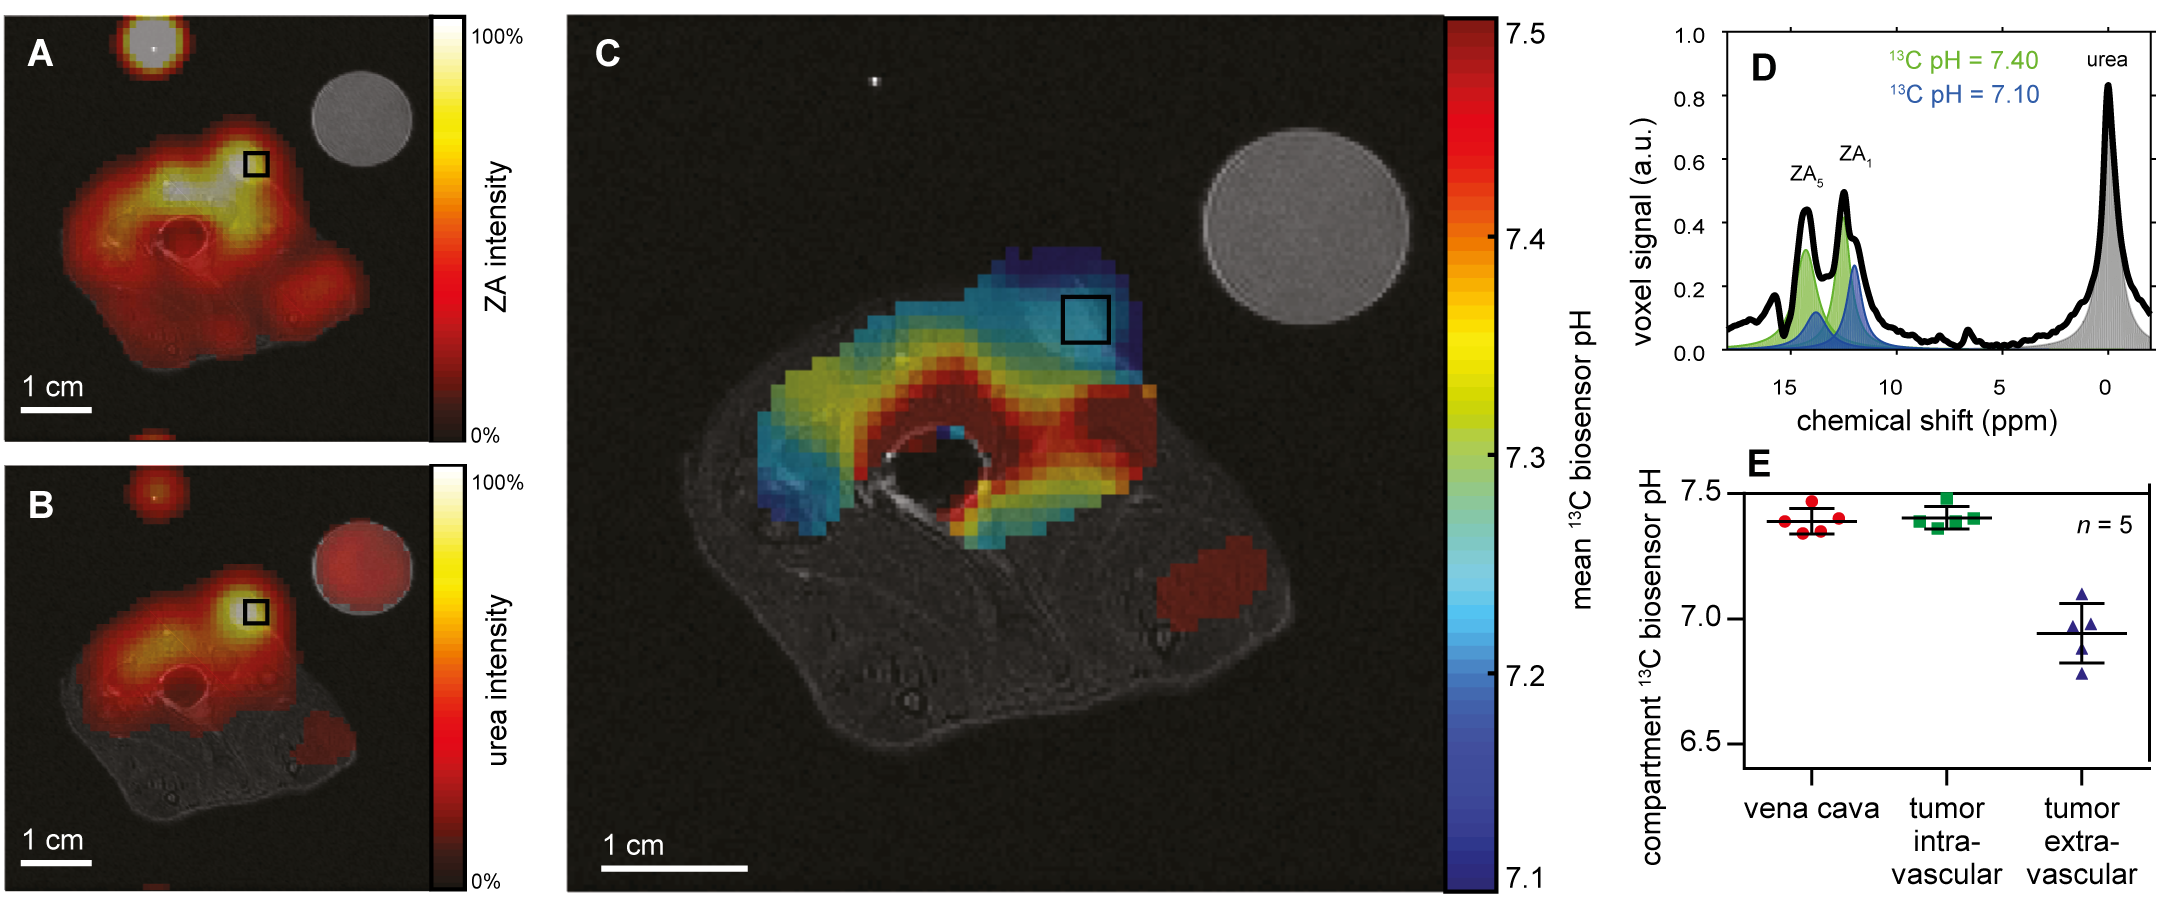
ZA's pH sensitivity in the physiological range is due to the value of its second acid dissociation constant pKa2 = 6.90 while ZA's changes in chemical shift can conveniently be modelled and fitted by a scaled logistic function (Fig. 1). pH measurements using ZA are demonstrated both in buffer phantoms and blood, and are robust towards changes in temperature and possible complexation by calcium ions (Fig. 2). Measurements using ZA in the rat bladder result in a pH of 6.48±0.02 (n = 9 pixels, mean±s.d.), in good agreement with the pH of 6.55±0.01 determined via pH electrode in the urine, sampled from the bladder directly after the MR measurement (Fig. 3). pH measurements in the kidneys of healthy rats showed up to three pairs of ZA peaks within the same voxel forming three pH clusters with a pH of 7.40±0.01, 6.94±0.05 and 6.55±0.03 (n = 4 rats, mean±s.d., Fig. 4). Based on literature values8, the pH clusters were attributed to the cortex, medulla and calyx/ureter, reflecting the transition effects of the blood pH before, during and after processing, filtering and renal metabolism. Measurements in Mat B III adenocarcinoma tumors resulted in an acidic tumor compartment of pH 6.94±0.12 (n = 5 rats, mean±s.d.), a neutral tumor compartment of pH 7.40±0.05 (n = 5 rats, mean±s.d.) and a neutral pH of 7.39±0.05 (n = 5 rats, mean±s.d.) near the vena cava (Fig. 5).Conclusion
We synthesized, characterized, calibrated and applied ZA as a novel hyperpolarized 13C pH biosensor in vitro and in vivo. Electrode pH and 13C pH measurements in phantoms under various conditions are reproducible, they correlate well in urine within the rat bladder and the detected clusters of pH values in the kidney agree with data reported in literature from cortex, medulla and calyx/ureter. Mat B III tumors show an acidic compartment in line with the Warburg effect9. Given the robustness of the presented pH imaging approach, ZA's low toxicity and the diagnostic value of imaging pH in the context of tumors, ischemia or inflammation, we believe that our novel pH reporter molecule could prove valuable for studying many biological phenomena.
Acknowledgements
EU Grant No. 294582 (MUMI), BMBF (FKZ 13EZ1114), DFG (SFB 824)References
1. R. A. Gatenby, R. J. Gillies, Why do cancers
have high aerobic glycolysis? Nat. Rev. Cancer 4, 891-899 (2004).
2. A. Lardner, The effects of extracellular pH on
immune function. J. Leukoc. Biol. 69, 522-530 (2001).
3. J. V. Bonventre, Mechanisms of ischemic acute
renal failure. Kidney Int. 43, 1160-1178 (1993).
4. R. J. Gillies, N. Raghunand, M. L.
Garcia-Martin, R. A. Gatenby, pH imaging. A review of pH measurement methods
and applications in cancers. IEEE Eng. Med. Biol. Mag. 23, 57-64 (2004).
5. L. Wolff, Ueber ein neues Condensationsproduct
der Brenztraubensäure. Justus Liebigs Ann. Chem. 317, 1-22 (1901).
6. J. L. Bloomer, M. A. Gross, F. E. Kappler, G. N.
Pandey, Identity of "zymonic acid" with a pyruvate derivative. Chem.
Comun., 1030-1030 (1970).
7. M. Durst et al., Comparison of acquisition
schemes for hyperpolarised C-13 imaging. NMR Biomed. 28, 715-725 (2015).
8. N. Raghunand, C. Howison, A. D. Sherry, S.
Zhang, R. J. Gillies, Renal and systemic pH imaging by contrast-enhanced MRI.
Magn. Reson. Med. 49, 249-257 (2003).
9. O. Warburg, On the Origin of Cancer Cells. Science 123, 309-314 (1956).
Figures
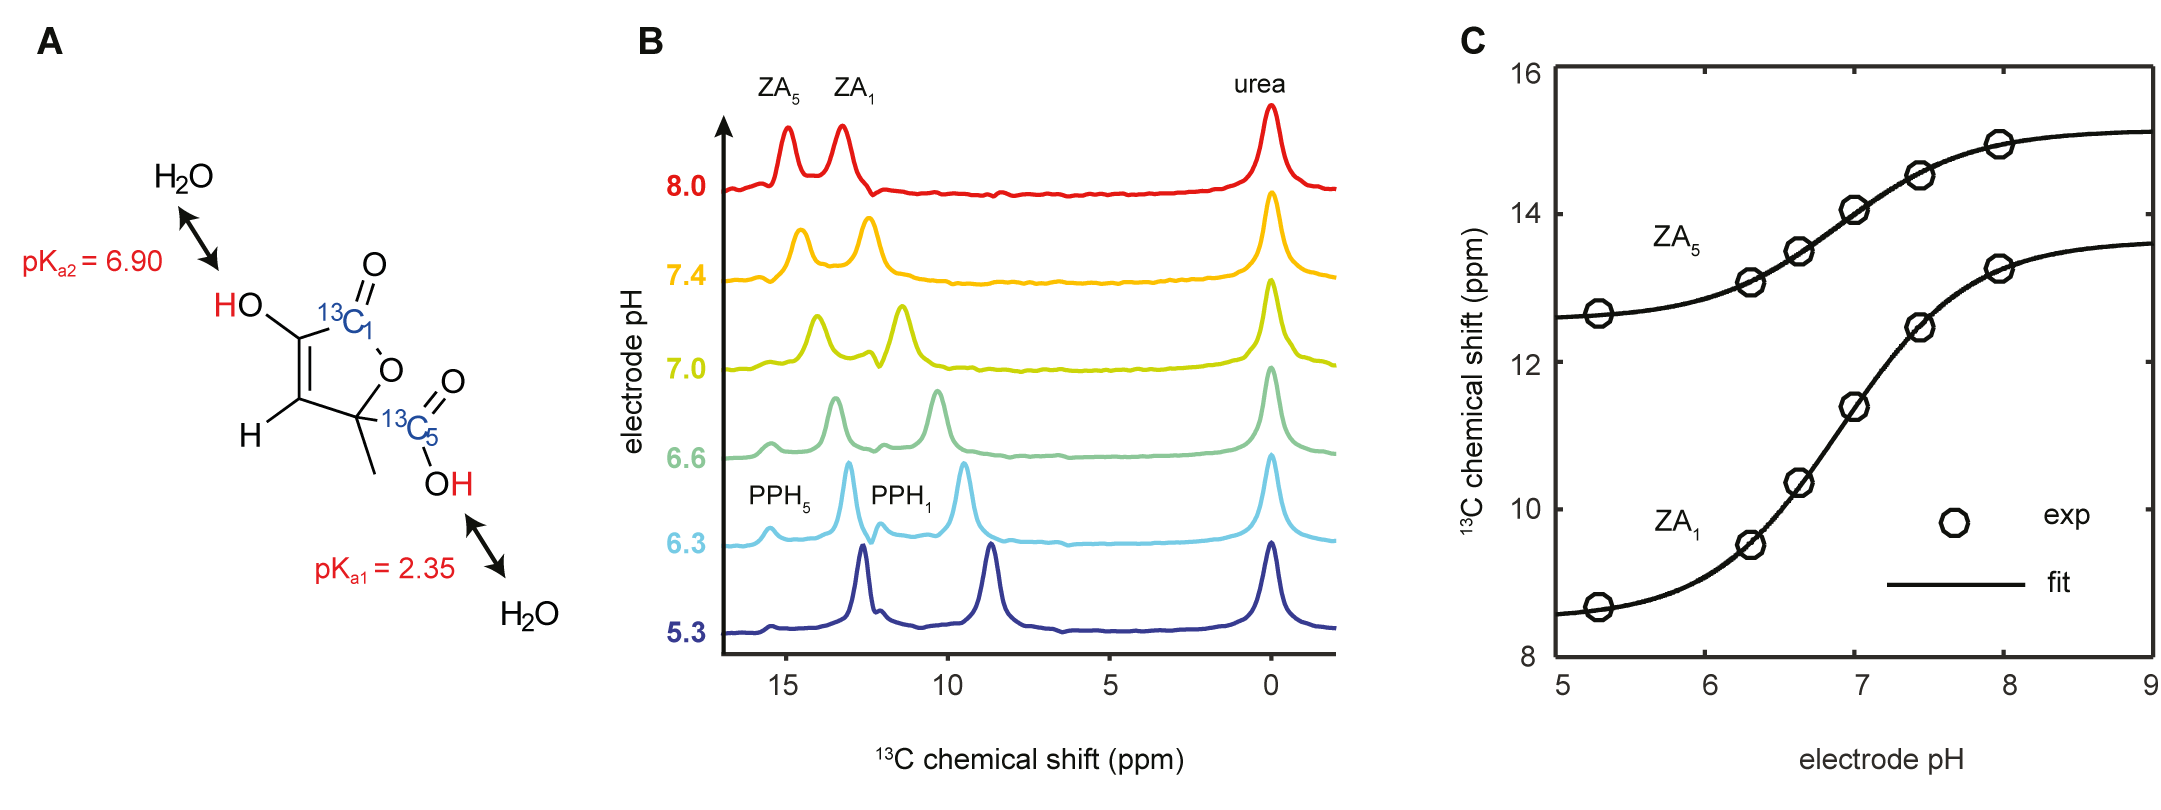
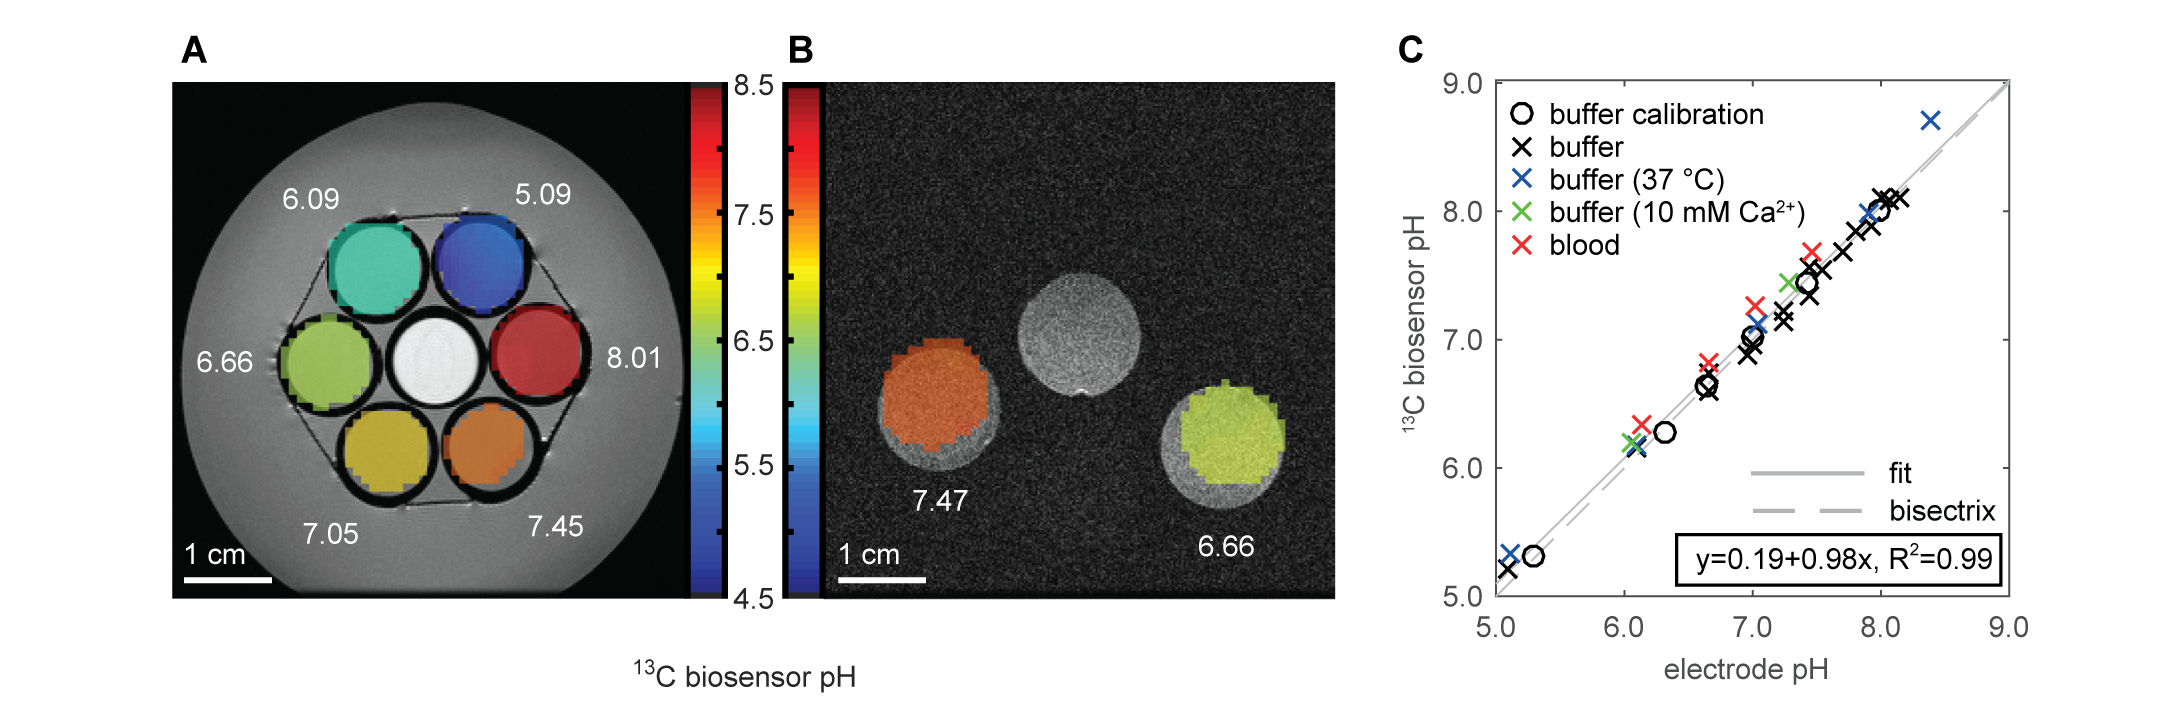
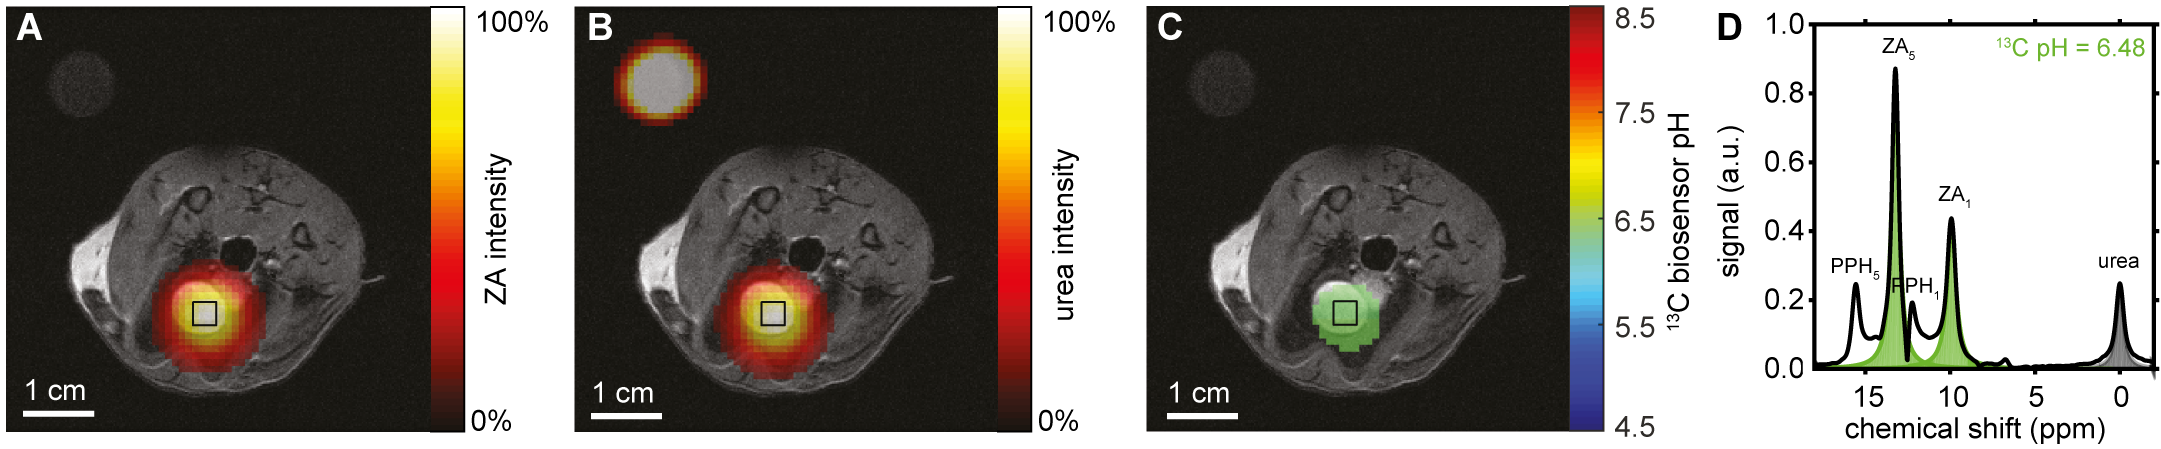
Figure 3: Hyperpolarized ZA in vivo pH measurement in rat bladder. A,B,C, Hyperpolarized 13C measurements (colored) in an axial slice overlayed on anatomical proton images (grayscale) with a calibration phantom containing 13C urea. The two simultaneously hyperpolarized and injected substances ZA (A) and urea (B) are well localized to the bladder. C, The 13C biosensor pH map shows an acidic pH of 6.48 ± 0.02 (n = 9 pixels, mean ± s.d.). D, The spectrum from a voxel in the bladder at nominal resolution (black box) shows fitted ZA, urea and the decay product parapyruvate hydrate.