0555
Dynamic Hyperpolarized 13C Metabolic Imaging of Patients with Brain Tumors1Radiology and Biomedical Imaging, University of California San Francisco, San Francisco, CA, United States, 2Neurological Surgery, University of California San Francisco, San Francisco, CA, United States, 3Department of Clinical Pharmacy, University of California San Francisco, San Francisco, CA, United States
Synopsis
Dynamic 13C data were acquired following injection of hyperpolarized [1-13C]pyruvate from 3 patients previously diagnosed with glioblastoma. Pyruvate, lactate and bicarbonate signal with high SNR were detected in human brain. Lactate/Pyruvate appeared to be relatively high in the contra-lateral, normal appearing brain. In contrast, tumor regions produced higher Lactate/Bicarbonate than contra-lateral brain. The contrast-enhancing lesion of one patient, who underwent surgical resection shortly after 13C imaging due to suspected recurrence, produced a relatively low level of Lactate/Pyruvate compared to contra-lateral brain and Lactate/Bicarbonate similar to the value in contra-lateral brain. Subsequent biopsy of the contrast-enhancing lesion indicated treatment effect.
Purpose
The purpose of this study was to develop and implement HP 13C metabolic imaging techniques for probing in vivo metabolism in brain tumors using [1-13C]labeled pyruvate. Dynamic 13C data were acquired from 3 patients previously diagnosed with glioblastoma, who had been treated with surgery, radiation and temozolomide. One patient underwent surgical resection shortly after HP 13C imaging due to suspected recurrence, and the 13C data was compared with results from histopathology.Methods
All experiments were performed using a GE 3T MR scanner with a clamshell volumetric 13C transmit coil and bilateral 8-channel phased array receive coils1. The HP [1-13C]pyruvate was prepared using a SpinLabTM system. Dynamic 2D 13C spectroscopic imaging data were acquired after injection of the HP agent from a 20~30 mm thick axial slice centered over suspected tumor using either a variable flip angle2 multi-band RF excitation designed to maximize lactate SNR (10 total time points) or constant 10° flip angle single-band excitation (24 total time points) with 10 phase encodes in RL direction and a symmetric echo-planar readout in AP direction (TE/TR=6.1/130ms, 3s temporal resolution, 20x20mm nominal in-plane resolution)3. After dissolution, the pyruvate solution underwent QC testing to determine the pH, temperature, polarization level and sterilization filter integrity, as well as the concentrations of pyruvate and the residual electron paramagnetic agent (EPA) used in the preparation. Following pharmacist approval, the agent was quickly transferred to the scanner room so that 0.43mL/kg pyruvate solution (~250mM)+20mL saline could be administered to the patient through the antecubital vein with a power injector at a rate of 5mL/s. Data acquisition started 5s from the end of the saline flush. The 13C data were processed and analyzed using in-house software4,5. The rate of conversion from pyruvate to lactate (Kpl) was fitted using the simplified 2-site-exchange model6. The ratio of lactate-to-bicarbonate (Lac/Bicarb) was calculated from total-summed spectra as a measure of balance between glycolysis and oxidative phosphorylation7 and compared with the ratio of lactate-to-pyruvate (Lac/Pyr). Tissue samples obtained from the patient who underwent surgery for recurrence were analyzed by a board-certified neuropathologist.Results and Discussion
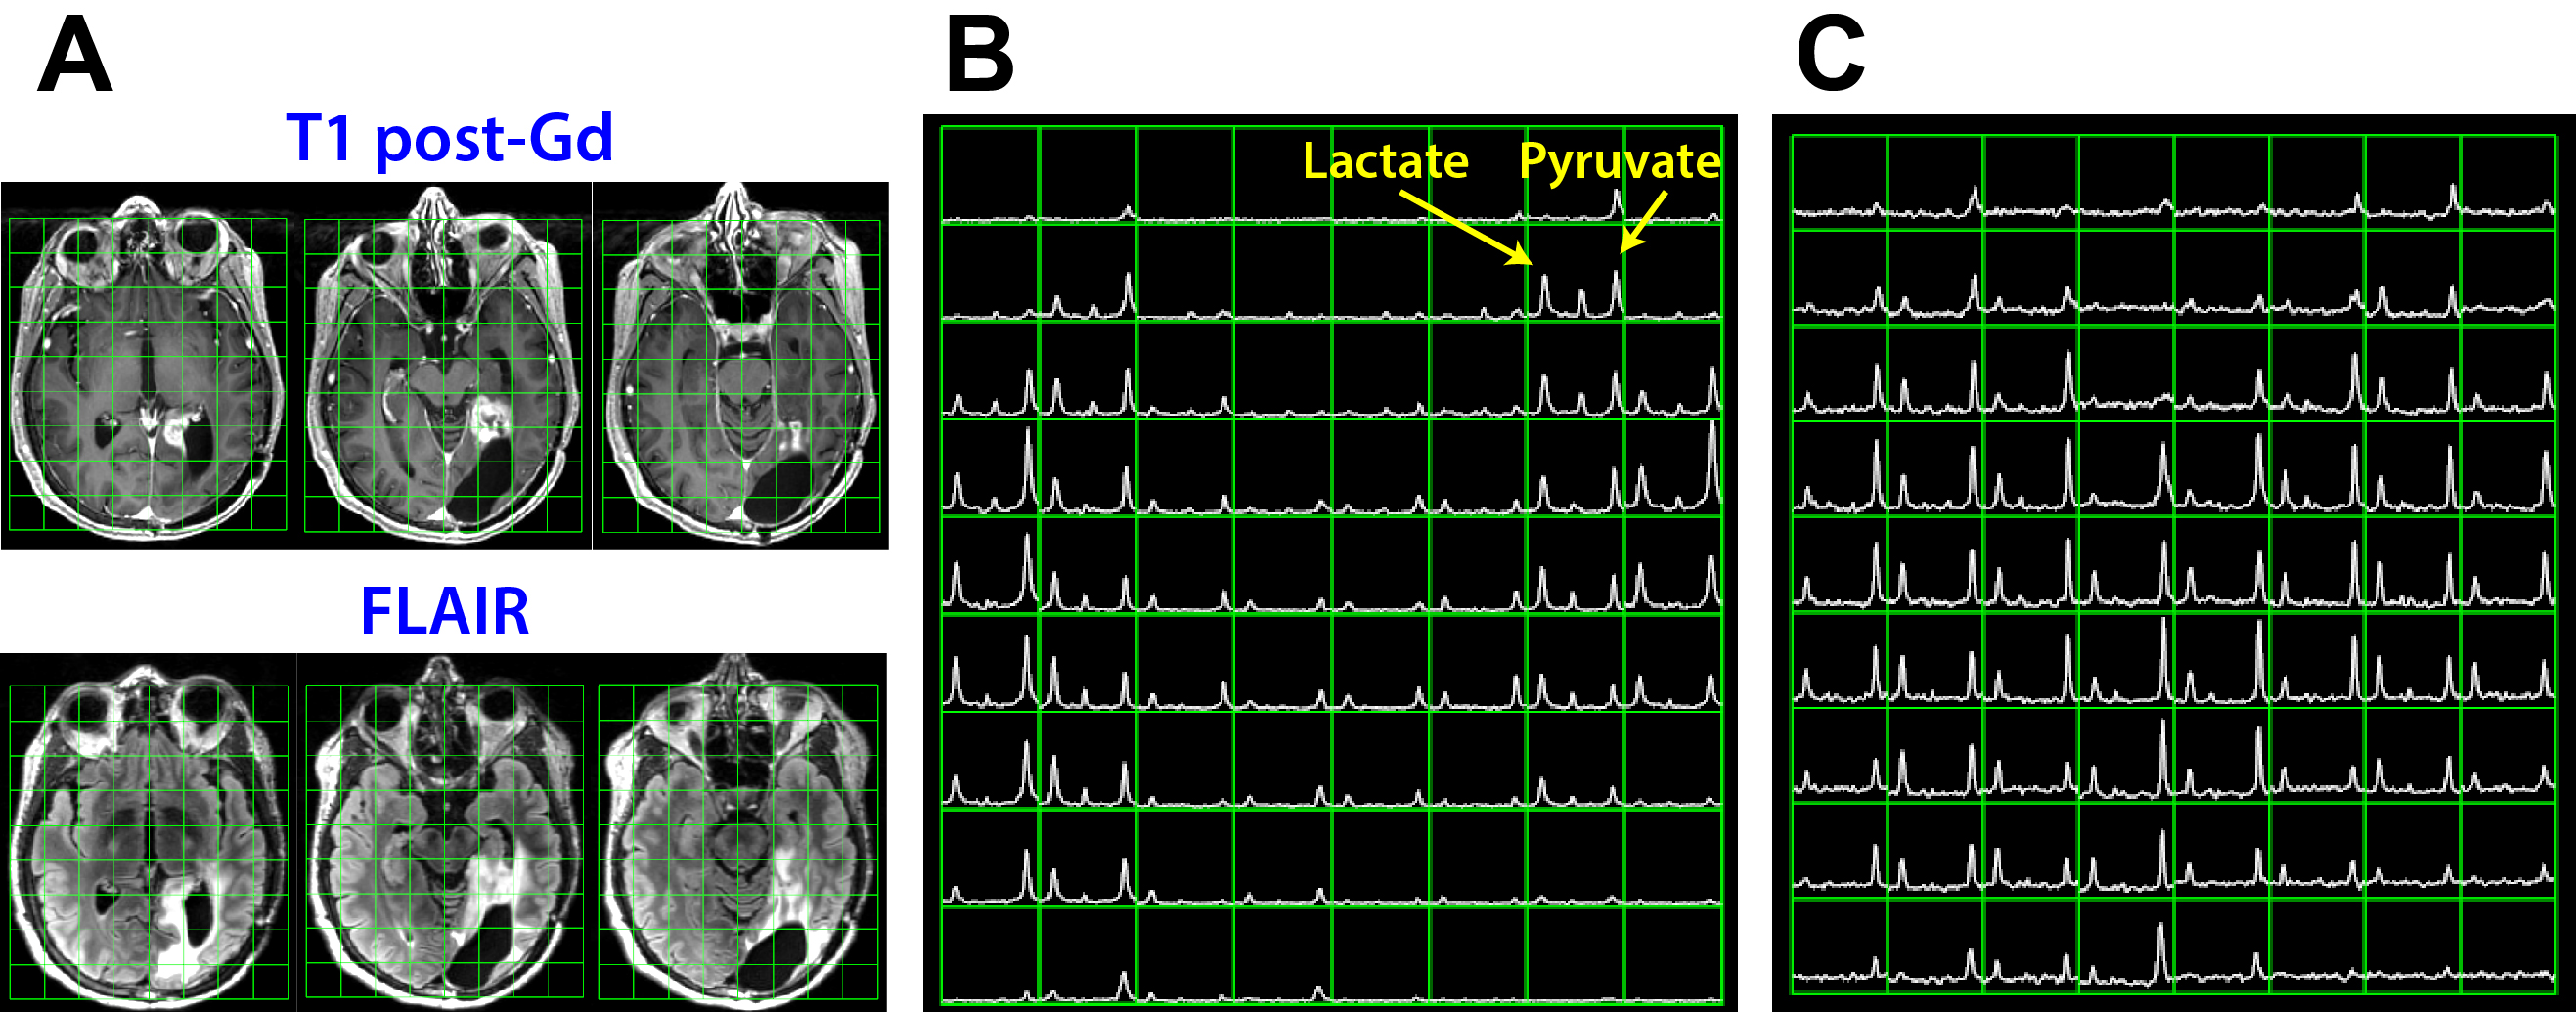
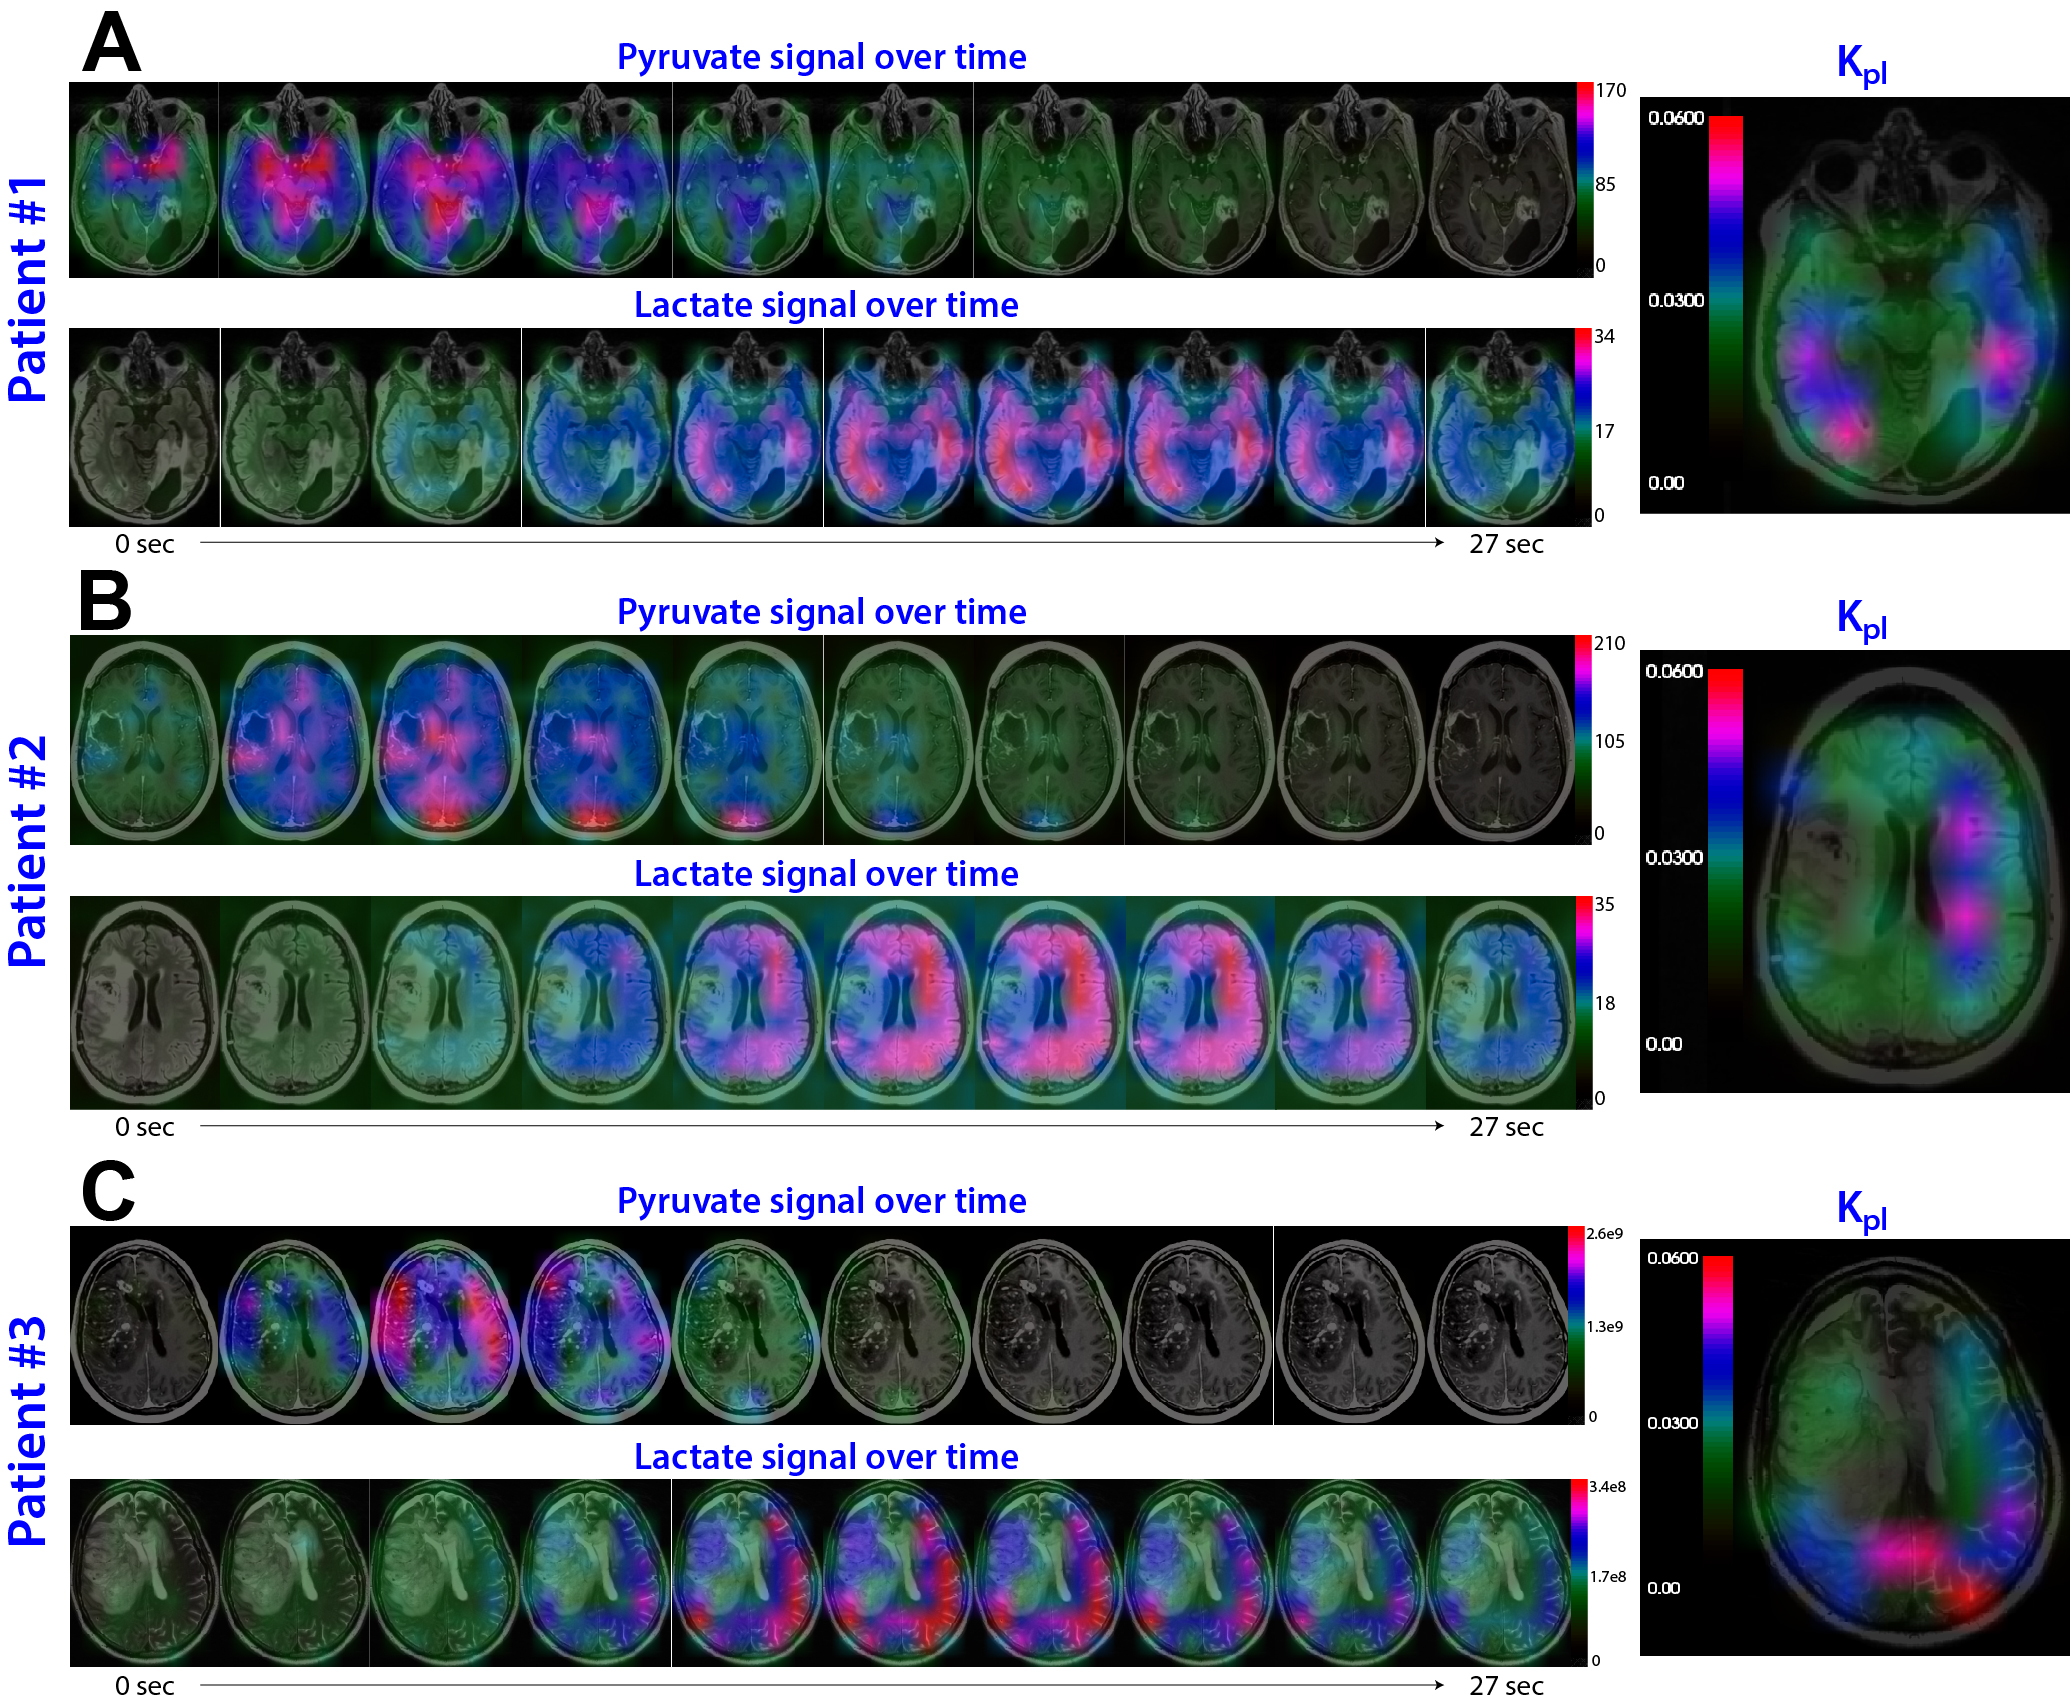
HP 13C MRSI were able to detect metabolic processes in human brain: Figure 1 shows an example of HP 13C spectra from a patient with a maximum SNR of 320 for pyruvate and 180 for lactate. The original 13C spectra (Figure1B) were intensity-corrected using the coil sensitivity map obtained by summing all metabolites over all time points (Figure1C). The flip angle- and intensity-corrected dynamic pyruvate and lactate signal demonstrated the spatial and temporal evolution of 13C-labeled pyruvate and lactate resonances in normal appearing brain (Figure2). The pyruvate appeared in multiple regions, with the maximum pyruvate in the cavernous sinus (Figure2A) or superior sagittal sinus (Figure2B) appearing approximately 9s from the start of data acquisition. Maximum lactate signal was observed approximately 15-18s from the start of data acquisition. The Kpl shows similar values in the normal-appearing brain from 3 patients (right panels in Figure2A,2B,2C).
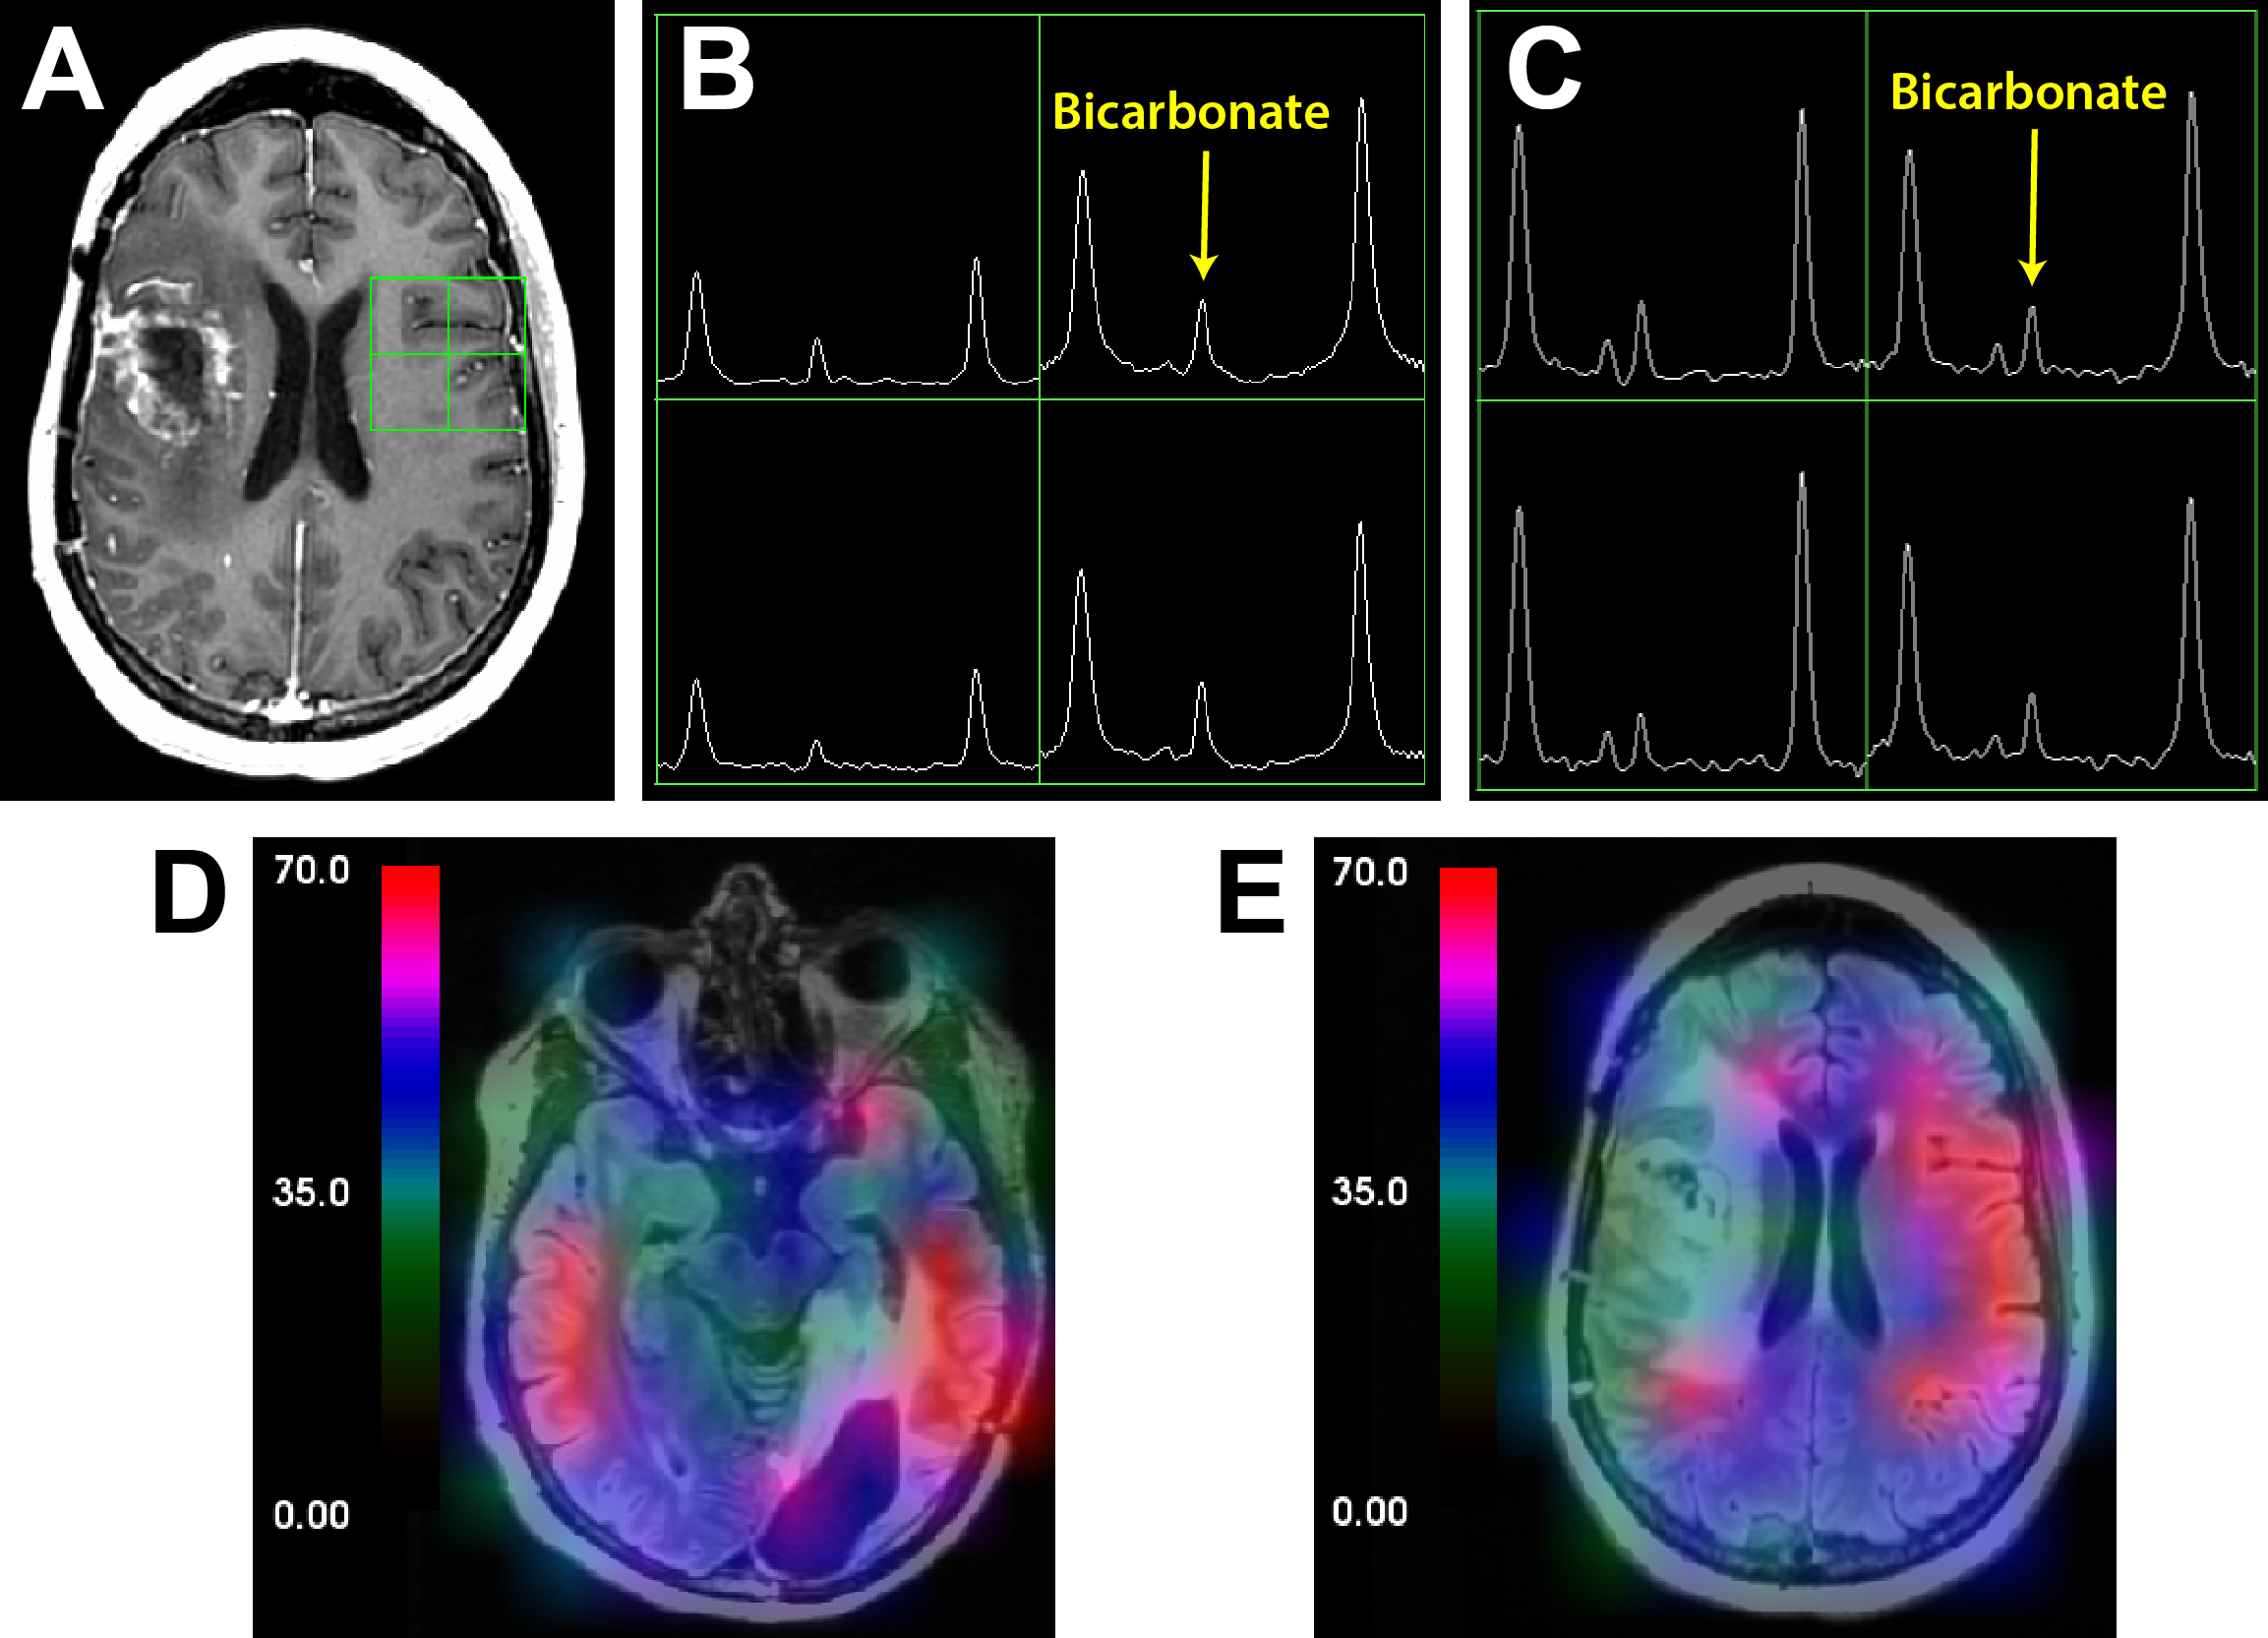
HP 13C MRSI was able to detect bicarbonate with high SNR: Figure 3 shows an example of bicarbonate signals, with peaks being observed in the raw spectra (Figure3B), as well as the intensity-corrected spectra (Figure3C). The ability to detect bicarbonate (Figure3D,3E) suggests that HP [1-13C]bicarbonate may be useful for studying the metabolism of not only glioma, but of a number of other neurological diseases.
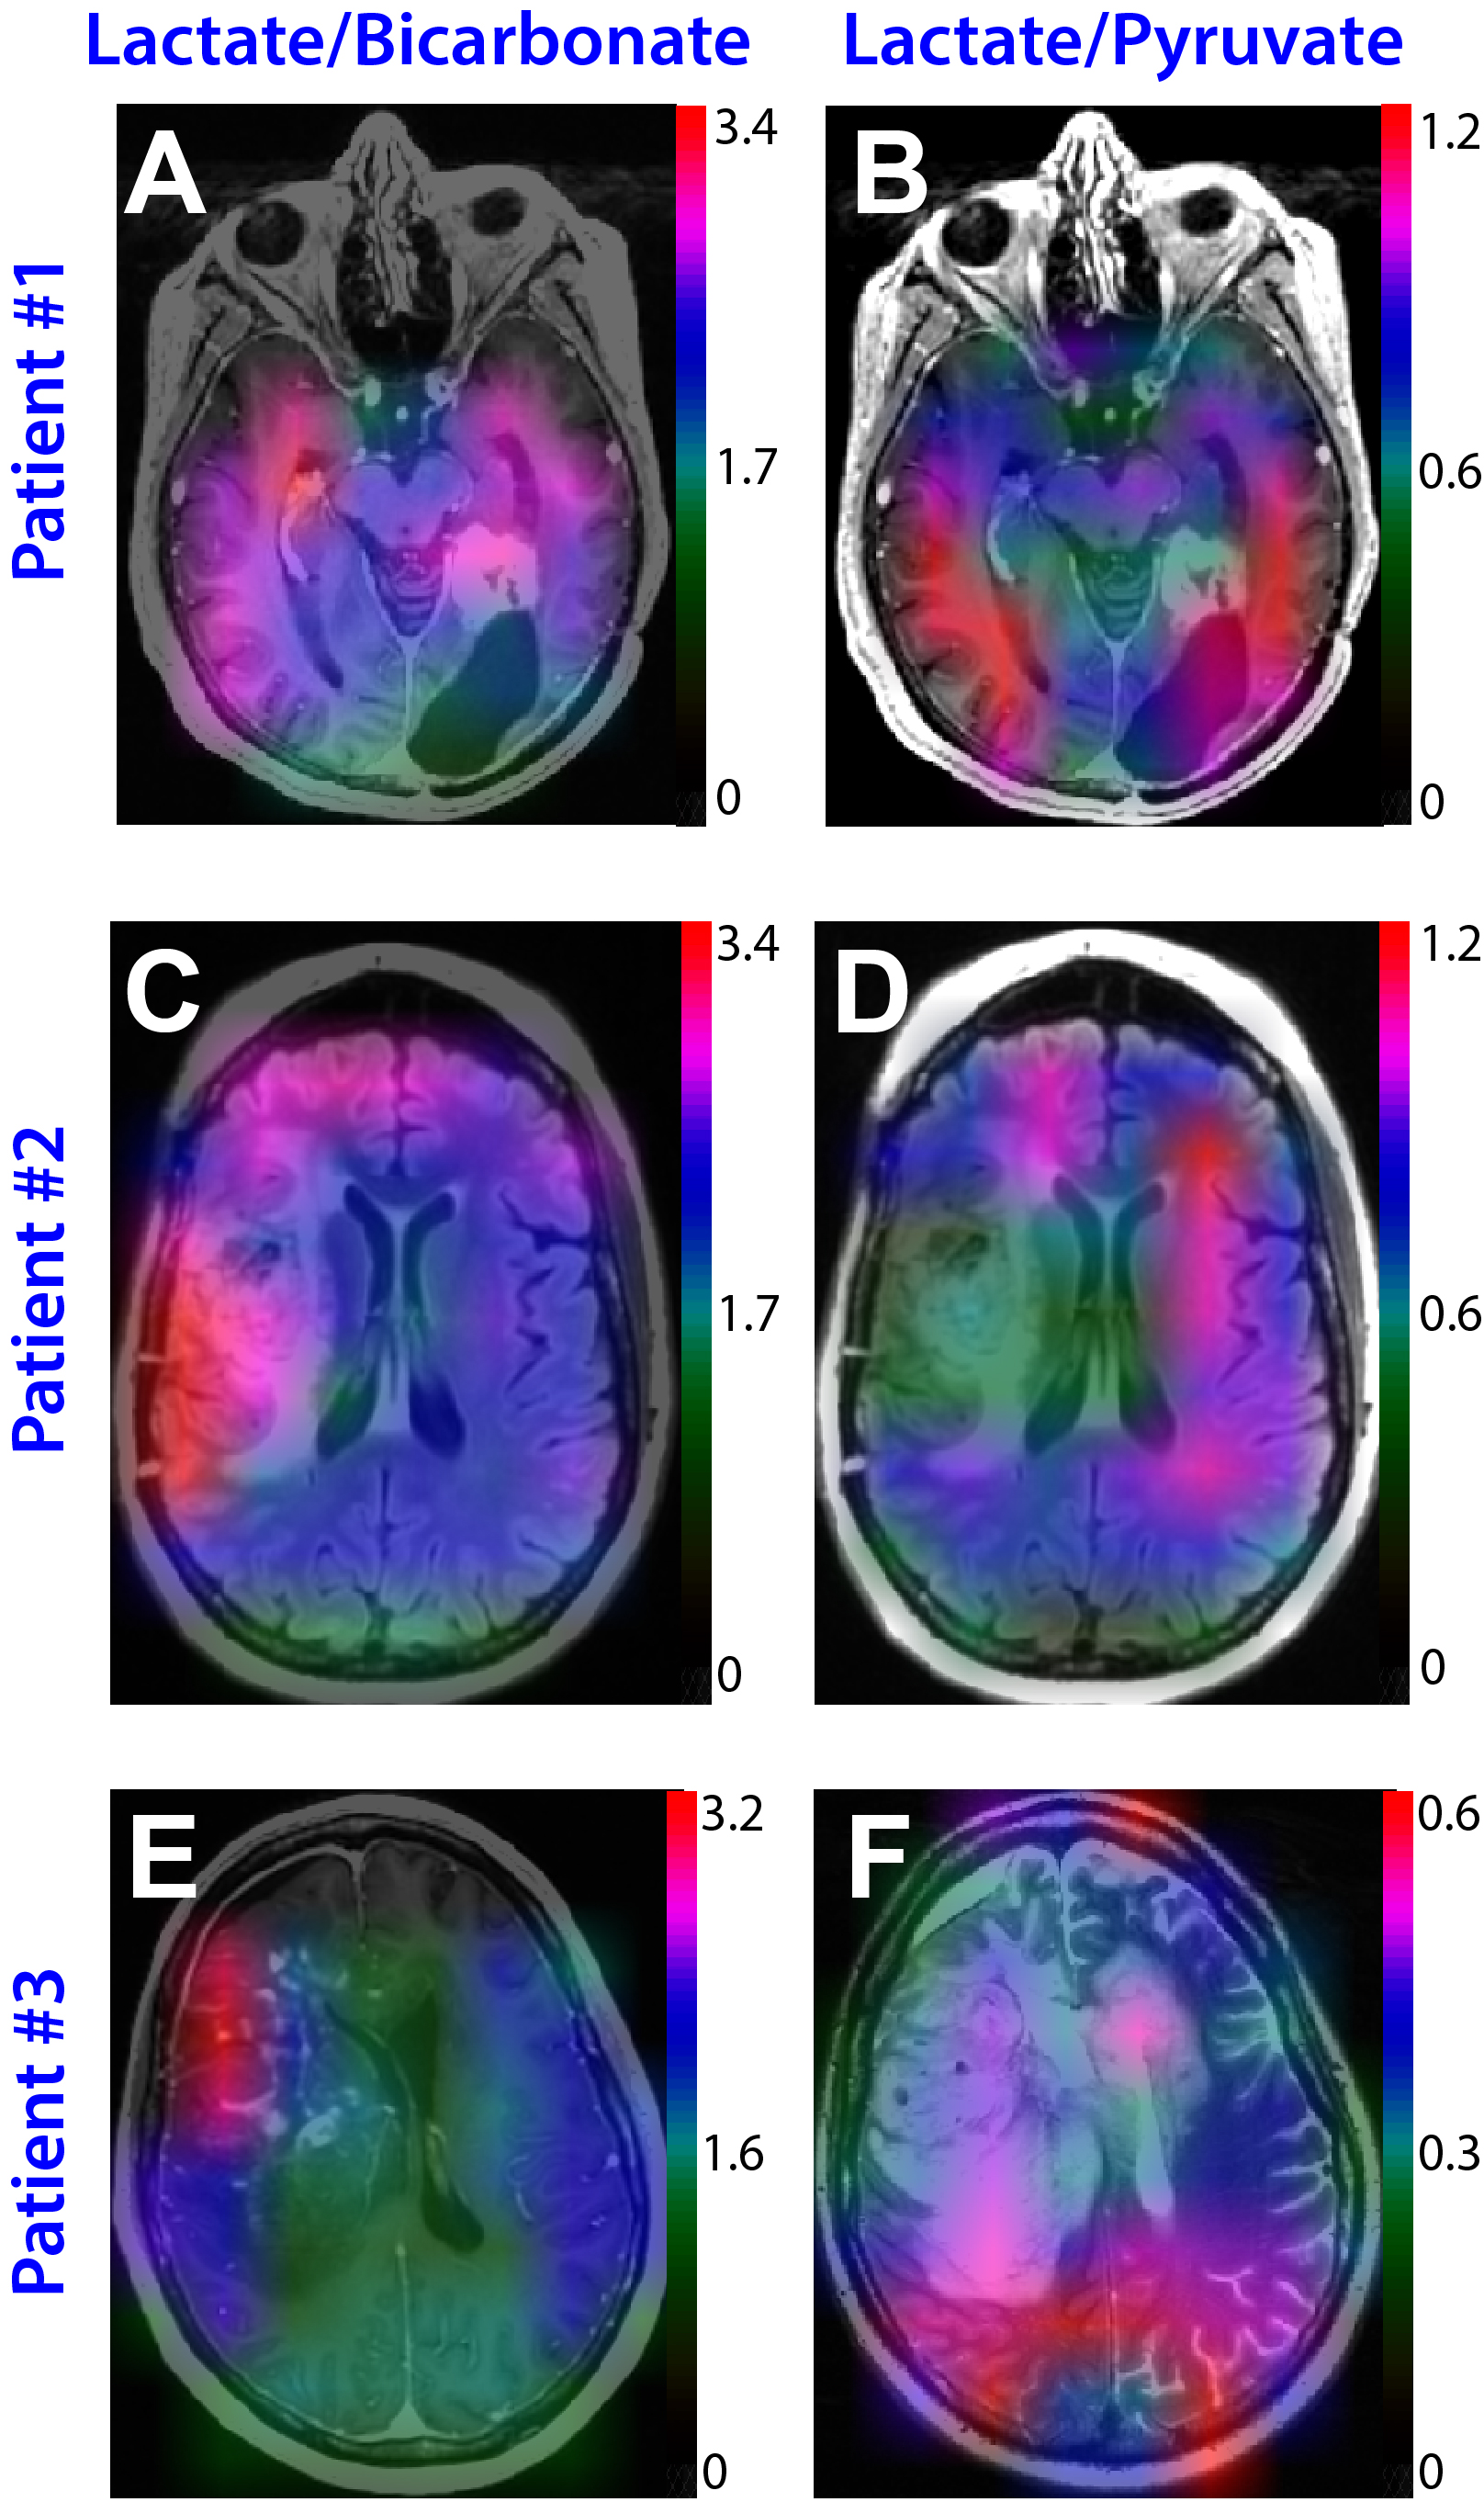
HP Lac/Bicarb and HP Lac/Pyr show different aspects of tumor metabolism: Figure 4 shows comparisons between Lac/Bicarb and Lac/Pyr for 3 patients. The contra-lateral normal-appearing brain produced higher or similar levels of Lac/Pyr to those in the anatomic lesion (Figure4B,4D,4F). In contrast, regions of suspected tumor demonstrated higher levels of Lac/Bicarb than the contra-lateral normal appearing brain in 2 of the patients (patient#2,#3 in Figure4).
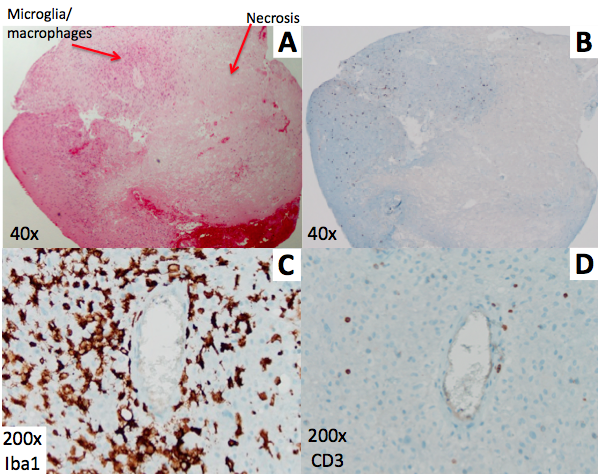
The lesion that had lower levels of HP Lac/Bicarb and Lac/Pyr was associated with treatment effect: Patient #1 presented with findings from a prior MRI that were suspected of recurrent tumor (see Figure4). This patient exhibited high Lac/Pyr throughout normal-appearing brain, but relatively low Lac/Pyr in the enhancing lesion (Figure4B). The level of Lac/Bicarb in the enhancing lesion was similar to that in normal-appearing brain (Figure4A). Analysis of tissue obtained from the enhancing lesion at a subsequent resection confirmed the diagnosis of treatment effect with predominant microglia//macrophages (Figure5).
Conclusions
An experimental strategy was developed for using HP 13C metabolic imaging to study the brain of patients with glioma. Preliminary results from this study demonstrated the feasibility of using HP [1-13C]pyruvate to measure in vivo metabolic processes in the brain and warrant further investigation in a larger population of patients.Acknowledgements
The first author was supported by a NCI training grant in translational brain tumor research (T32 CA151022) and Kure It Grant for Underfunded Cancer Research. The support for the research studies came from NIH grants P41EB013598, R21CA170148 and P01CA118816.References
1. Park I, Larson PEZ, Tropp JL, Carvajal L, Reed G, Bok R, Robb F, Bringas J, Kells A, Pivirotto P, Bankiewicz K, Vigneron DB, Nelson1 SJ. Dynamic Hyperpolarized Carbon-13 Metabolic MR Imaging of Non-Human Primate Brain. Magn Reson Med. 2014 Jan;71(1):19-25.
2. Xing Y, Reed GD, Pauly JM, Kerr AB, Larson PE. Optimal variable flip angle schemes for dynamic acquisition of exchanging hyperpolarized substrates. J Magn Reson. 2013 Sep;234:75-81.
3. Larson PE, Hu S, Lustig M, Kerr AB, Nelson SJ, Kurhanewicz J, Pauly JM, Vigneron DB. Fast dynamic 3D MR spectroscopic imaging with compressed sensing and multiband excitation pulses for hyperpolarized 13C studies. Magn Reson Med. 2011 Mar;65(3):610-9.
4. Nelson SJ Analysis of volume MRI and MR spectroscopic imaging data for the evaluation of patients with brain tumors. Magn Reson Med 2001;46:228-39.
5. Crane JC, Olson MP, Nelson SJ. SIVIC: Open-Source, Standards-Based Software for DICOM MR Spectroscopy Workflows. Int J Biomed Imaging. 2013;2013:169526.
6. Zierhut ML, Yen Y-F, Chen AP, Bok R, Albers MJ, Zhang V, Tropp J, Park I, Vigneron DB, Kurhanewicz J, Hurd RE, Nelson SJ. Kinetic Modeling of Hyperpolarized 13C1-Pyruvate Metabolism in Normal Rat Kidneys and TRAMP Mice. J Magn Reson. 2010 Jan;202(1):85-92.
7. Park JM, Spielman DM, Josan S, Jang T, Merchant M, Hurd RE, Mayer D, Recht LD. Hyperpolarized (13)C-lactate to (13)C-bicarbonate ratio as a biomarker for monitoring the acute response of anti-vascular endothelial growth factor (anti-VEGF) treatment. NMR Biomed. 2016 May;29(5):650-9.
Figures