0551
Cardiac Magnetic Resonance Elastography for Quantitative Assessment of Elevated Myocardial Stiffness in Cardiac AmyloidosisArvin Arani1, Shivaram P. Arunachalam1, Ian CY Chang2, Francis Baffour1, Kevin J Glaser1, Joshua D Trzasko1, Kiaran McGee1, Armando Manduca1, Martha Grogan2, Angela Dispenzieri3,4, Richard L Ehman1, and Philip A Araoz1
1Radiology, Mayo Clinic, Rochester, MN, United States, 2Cardiovascular Diseases, Mayo Clinic, Rochester, MN, United States, 3Medicine: Division of Hematology, Mayo Clinic, Rochester, MN, United States, 4Laboratory Medicine and Pathology, Mayo Clinic
Synopsis
Myocardial stiffness plays an important role in cardiac function. The objective of this study is to evaluate if 3D high frequency cardiac MR elastography (MRE) can measure increased myocardial stiffness in cardiac amyloidosis patients compared to healthy volunteers. Twenty-two patients with cardiac amyloidosis and 16 healthy volunteers were enrolled. The myocardial stiffness of cardiac amyloid patients (median: 11.4 kPa, min: 9.2, max: 15.7) was found to be significantly stiffer (p < 0.01) than healthy controls (median: 8.2 kPa, min: 7.2, max: 11.8). These results motivate future investigation of 3D high frequency cardiac MRE in different patient cohorts.
Purpose
Myocardial stiffness plays an important role in cardiac function. Increased stiffness in the myocardium can cause poor function and restrictive diastolic filling, which can lead to heart failure symptoms, even with a normal left ventricular (LV) ejection fraction (1). Myocardial infarcts can cause abnormal tissue stiffness that can affect LV wall stress and the pattern of LV remodeling (2). Shear wave elastography is an emerging imaging approach for measuring myocardial stiffness in vivo (3-10). Recently, a 3D high frequency cardiac MR elastography (MRE) technique, which has shown a high level of agreement with dynamic material testing (intra-class correlation coefficient up to 0.99) (11), has been shown to be feasible in normal volunteers (12). However, the feasibility of 3D high frequency cardiac MRE has not been evaluated in a patient cohort. Cardiac amyloidosis is an established disease of myocardial stiffening and this patient group is an excellent candidate for evaluating if elevated myocardial stiffness can be detected with MRE. The objective of this study is to evaluate if 3D high frequency cardiac MRE can measure increased myocardial stiffness in cardiac amyloidosis patients compared to healthy volunteers.Methods
Twenty-two patients with cardiac amyloidosis and 16 healthy volunteers were enrolled after receiving institutional review board and written informed consent approval. All subjects underwent cardiac MRI/MRE and echocardiography with speckle tracking strain imaging Doppler evaluation of diastolic function. Patients with tissue diagnosis of amyloidosis and left ventricular maximal wall thickness of greater than 12 mm by echocardiography were classified as having cardiac amyloidosis. Cardiac MRE was used to quantitatively measure myocardial stiffness across the left ventricle of each subject. The experimental set up is shown in Figure 1. MRE Imaging was conducted at a vibration frequency of 140Hz using the same procedure as previously described (12). To establish a noise baseline, the MRE exam was repeated with the vibrational motion turned off (“no motion” scan) and the octahedral shear strain signal to noise ratio (OSS-SNR) (13) was calculated. An MRE exam was considered successful only if the mean OSS-SNR in the myocardium was at least two standard deviations above the median OSS-SNR of all no-motion scans (i.e. noise) across all subjects. Statistical analysis was done using a commercial software package (OriginPro 2015, OriginLab Corporation, Northampton, MA) that implemented a Mann-Whitney U test of significance (14). A p-value of less than 0.05 was considered statistically significant.Results
The group-wise median OSS-SNR for the “no motion” scans was 0.96 and an OSS-SNR value of 1.17 (two standard deviations above the median) was used as a quantitative quality factor threshold to exclude MRE exams with poor image quality (Figure 2). The mean OSS-SNR of 6 patients and 5 volunteers fell below this threshold and thus these exams were excluded from the study. The LV myocardial stiffness of the 16 cardiac amyloid patients (median: 11.4 kPa, min: 9.2, max: 15.7), measured with cardiac MRE, was significantly higher (p < 0.01) than the LV myocardium of 11 normal healthy volunteers (median: 8.2 kPa, min: 7.2, max: 11.8) (Figure 3). Typical short-axis elastograms from the mid-section of the left ventricle in a healthy volunteer and an age- and sex-matched amyloidosis patient are shown in Figure 4A) and 4B), respectively. The MRE stiffness values for each cohort have been listed at the top of Table 2. MRI imaging demonstrated that patients with amyloidosis had significantly thicker diastolic and systolic left ventricular wall thickness, a greater LVEDVi and LV mass, and lower LVEF than normal healthy volunteers. Echocardiography showed that the amyloidosis group had significantly lower e’, increased E/e’ ratio, lower longitudinal and basal strain, and greater left atrial volume index than the healthy volunteer group. All bSSFP and echocardiography parameters have been listed in Table 1.Discussion and Conclusions
This study demonstrates the feasibility of 3D high-frequency cardiac MRE as a contrast-agent-free diagnostic imaging technique for quantitatively measuring myocardial stiffness; validated in a cardiac amyloidosis patient cohort. The myocardial stiffness of cardiac amyloid patients (median: 11.4 kPa, min: 9.2, max: 15.7) was found to be significantly stiffer (p < 0.01) than healthy controls (median: 8.2 kPa, min: 7.2, max: 11.8). These results motivate future investigation of 3D high frequency cardiac MRE in different patient cohorts, in therapy monitoring studies, and future prognostic evaluation studies where myocardial stiffness measurements could play a potential role in early disease diagnosis and therapy monitoring.Acknowledgements
This work was supported by National Institutes of Health (NIH) grants 5R01HL115144 and EB001981 and the Mayo Clinic Center for Individualized Medicine, Imaging Biomarker Discovery Program.References
1. Zile MR, Baicu CF, Gaasch WH. Diastolic heart failure--abnormalities in active relaxation and passive stiffness of the left ventricle. The New England journal of medicine 2004;350(19):1953-1959. 2. Holmes JW, Borg TK, Covell JW. Structure and mechanics of healing myocardial infarcts. Annual review of biomedical engineering 2005;7:223-253. 3. Kolipaka A, Aggarwal SR, McGee KP, Anavekar N, Manduca A, Ehman RL, Araoz PA. Magnetic resonance elastography as a method to estimate myocardial contractility. Journal of magnetic resonance imaging : JMRI 2012;36(1):120-127. 4. Kolipaka A, Mcgee KP, Araoz PA, Glaser KJ, Manduca A, Romano AJ, Ehman RL. MR Elastography as a Method for the Assessment of Myocardial Stiffness: Comparison with an Established Pressure-Volume Model in a Left Ventricular Model of the Heart. Magnet Reson Med 2009;62(1):135-140. 5. Elgeti T, Beling M, Hamm B, Braun J, Sack I. Cardiac magnetic resonance elastography: toward the diagnosis of abnormal myocardial relaxation. Investigative radiology 2010;45(12):782-787. 6. Elgeti T, Knebel F, Hattasch R, Hamm B, Braun J, Sack I. Shear-wave amplitudes measured with cardiac MR elastography for diagnosis of diastolic dysfunction. Radiology 2014;271(3):681-687. 7. Elgeti T, Laule M, Kaufels N, Schnorr J, Hamm B, Samani A, Braun J, Sack I. Cardiac MR elastography: comparison with left ventricular pressure measurement. Journal of cardiovascular magnetic resonance 2009;11:44. 8. Couade M, Pernot M, Messas E, Bel A, Ba M, Hagege A, Fink M, Tanter M. In vivo quantitative mapping of myocardial stiffening and transmural anisotropy during the cardiac cycle. IEEE transactions on medical imaging 2011;30(2):295-305. 9. Song P, Zhao H, Urban M, Manduca A, Pislaru S, Kinnick R, Pislaru C, Greenleaf J, Chen S. Improved Shear Wave Motion Detection Using Pulse-Inversion Harmonic Imaging with a Phased Array Transducer. IEEE transactions on medical imaging 2013;32(12):2299-2310. 10. Hollender PJ, Wolf PD, Goswami R, Trahey GE. Intracardiac echocardiography measurement of dynamic myocardial stiffness with shear wave velocimetry. Ultrasound in medicine & biology 2012;38(7):1271-1283. 11. Arunachalam SP, Rossman PJ, Arani A, Lake DS, Glaser KJ, Trzasko JD, Manduca A, McGee KP, Ehman RL, Araoz PA. Quantitative 3D magnetic resonance elastography: Comparison with dynamic mechanical analysis. Magnetic resonance in medicine : official journal of the Society of Magnetic Resonance in Medicine / Society of Magnetic Resonance in Medicine 2016. 12. Arani A, Glaser KL, Arunachalam SP, Rossman PJ, Lake DS, Trzasko JD, Manduca A, McGee KP, Ehman RL, Araoz PA. In vivo, high-frequency three-dimensional cardiac MR elastography: Feasibility in normal volunteers. Magnetic resonance in medicine : official journal of the Society of Magnetic Resonance in Medicine / Society of Magnetic Resonance in Medicine 2016. 13. McGarry MD, Van Houten EE, Perrinez PR, Pattison AJ, Weaver JB, Paulsen KD. An octahedral shear strain-based measure of SNR for 3D MR elastography. Physics in medicine and biology 2011;56(13):N153-164. 14. Siegel S. Nonparametric statistics for the behavioral sciences. 1956.Figures
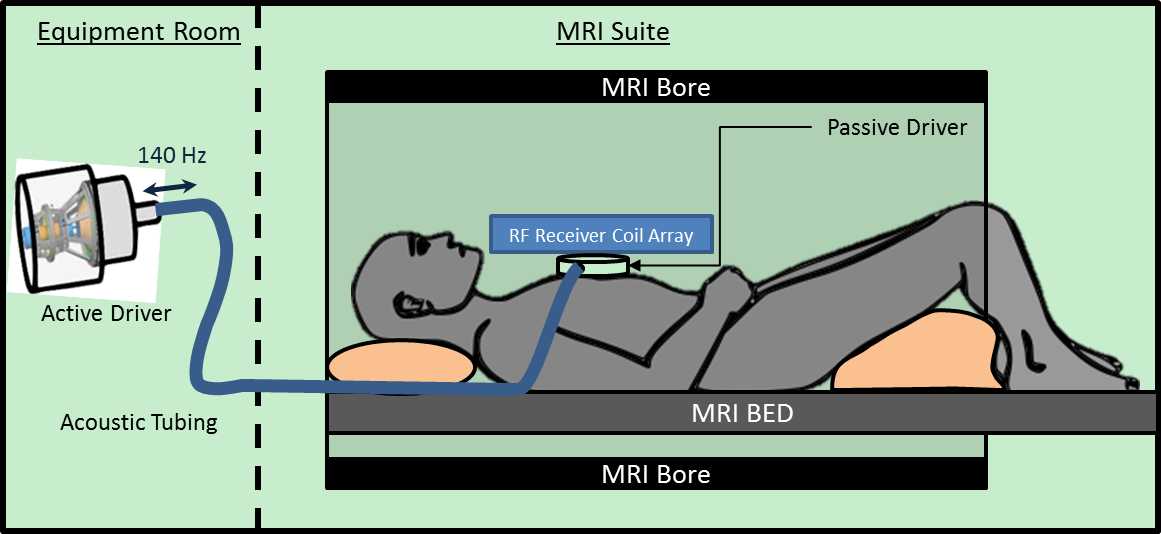
Figure 1: Cardiac MRE experimental setup. An active
driver delivers 140Hz vibrations through acoustic tubing to a passive cardiac
driver that is strapped to the subject’s chest. Shear waves are transmitted
into the myocardium and the wave displacement field is imaged with the MRI
scanner.
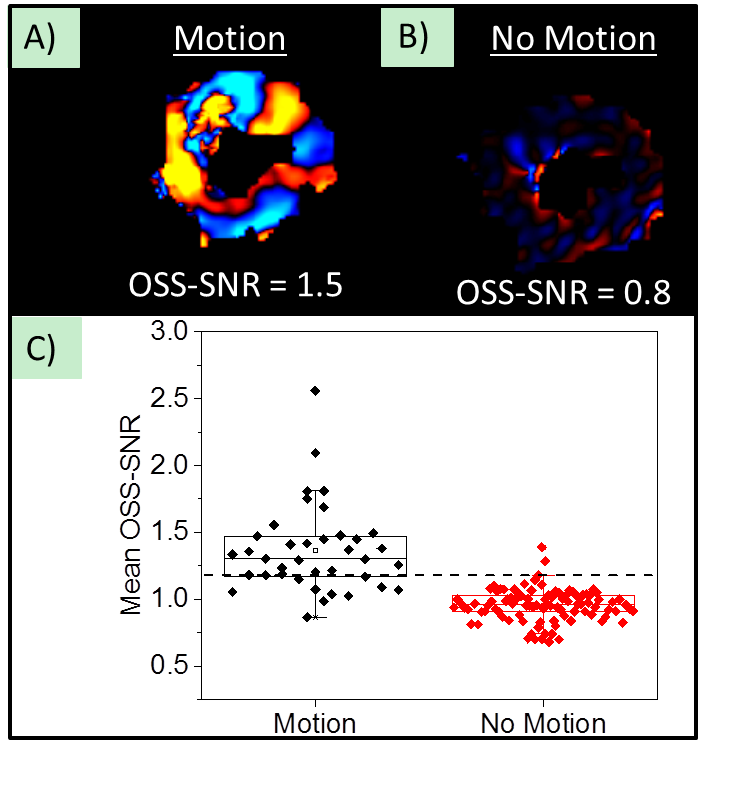
Figure 2: Wave quality factor metric. An example of a
wave image from the same subject A) with vibrational motion on (“Motion”), and
B) with vibrational motion turn off (“No-Motion”). The mean
octahedral-shear-strain (OSS-SNR) signal to noise ratio over the entire
myocardial volume for each scan has been reported at the bottom of each wave
image. C) Mean OSS-SNR across the myocardium for “Motion” and “No Motion” scans
across all subjects. The dotted line is
two standard deviations above the mean OSS-SNR from “No Motion” scans, and only
scans with values above this threshold were included in the study.
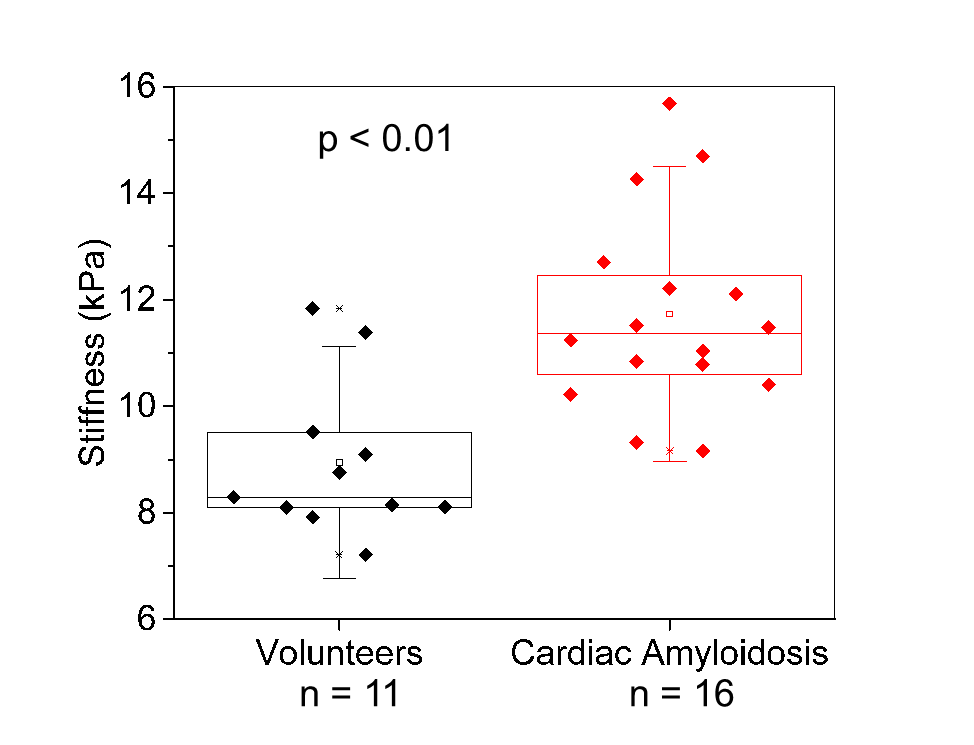
Figure 3: Box and whisker plot of median myocardial
stiffness (kPa) in patients diagnosed with amyloidosis and normal healthy
controls. Patients in the amyloidosis group had significantly stiffer myocardial tissue (p < 0.01) than
age and sex matched controls.
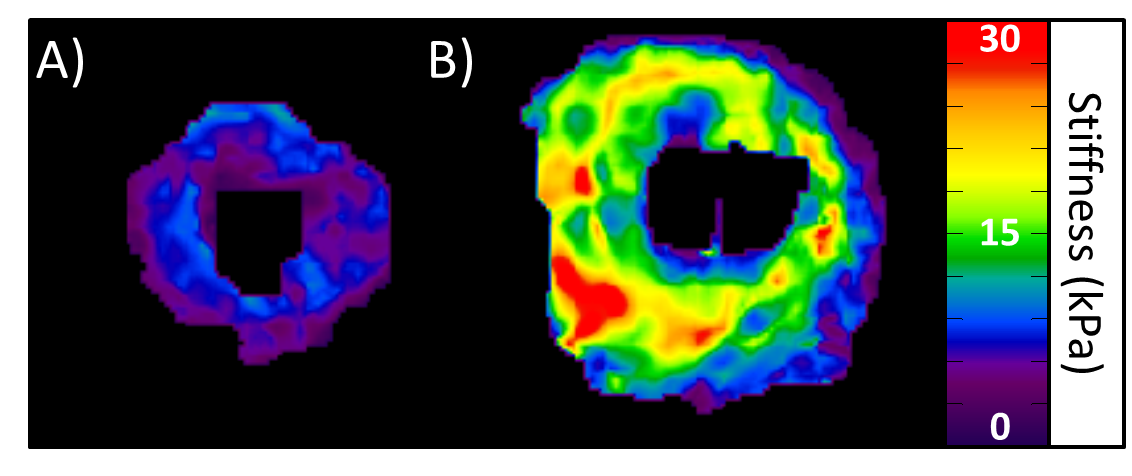
Figure 4: MRE Elastograms. A) and B) Three short-axis
view stiffness maps (elastograms) transitioning from the apex to the base of
the heart in a healthy volunteer (mean stiffness = 7.2 kPa) and age and sex
matched patient with amyloidosis (mean stiffness = 15.7 kPa), respectively.
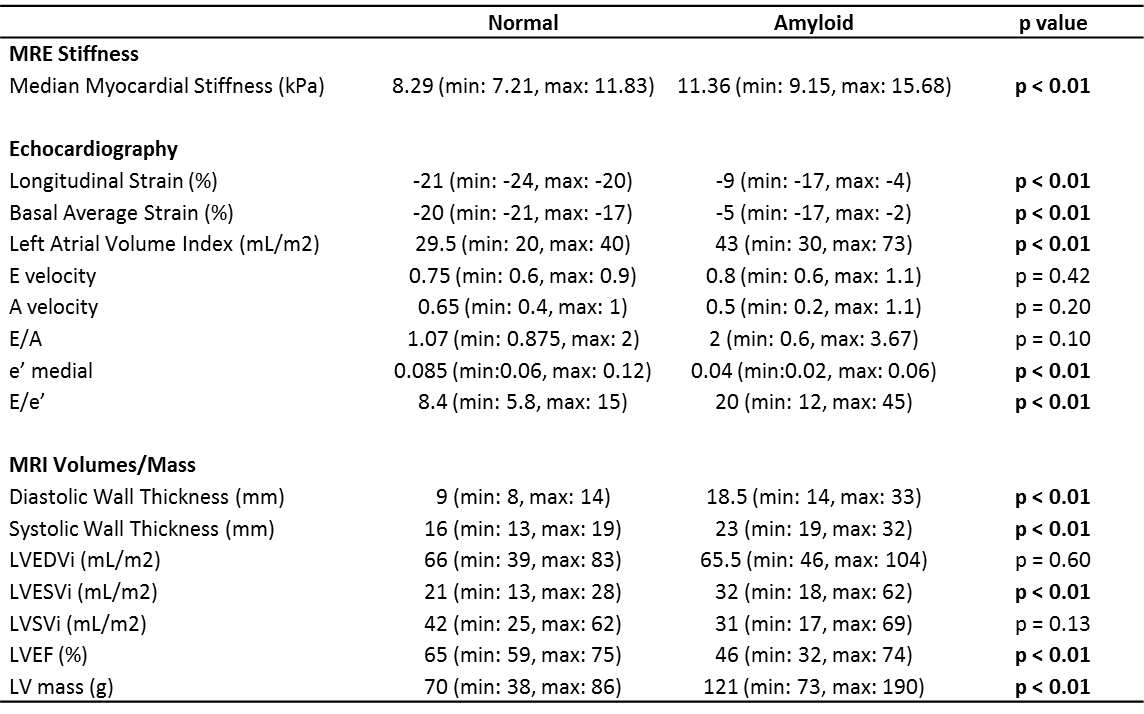
Table 1: Diagnostic Parameters. Legend: A-velocity –
late filling velocity; E-velocity
– early filling velocity; e’ medial – the diastolic peak velocities of
the medial mitral annulus; kPa – kilopascal; LV – Left Ventricle; MRE –
Magnetic Resonance Elastography; RV – Right Ventricle; NYHA – New York Heart
Association; LVEDVi – Left ventricle end-diastolic volume index; LVESVi – Left
ventricle end-systolic volume index; LVSVi – Left ventricle systolic volume
index; LVEF – left ventricle ejection fraction.