0550
High-fat diet feeding in mice may partially protect the heart from pressure overload induced heart failure - a longitudinal study of cardiac metabolism and function1Department of Biomedical Engineering, Biomedical NMR, Eindhoven University of Technology, Eindhoven, Netherlands, 2Department of Genetics and Cell Biology, CARIM school for cardiovascular diseases, Maastricht University, Netherlands, 3Department of Radiology, University Medical Center, Utrecht, Netherlands
Synopsis
Obesity increases the risk of heart failure, but obese heart failure patients have a better prognosis and survival. Altered cardiac energy metabolism is proposed to be an important contributor to this discrepancy. With an in vivo longitudinal approach measuring cardiac function (MRI), energetics (31P-MRS) and lipid content (1H-MRS) during the development of heart failure we have shown that cardiac function was less impaired in obese mice compared with lean mice after induction of pressure overload. This suggests that metabolic adaptations in obese mice are not detrimental and may even be beneficial in heart failure development.
Introduction
Overweight and obesity have become a growing
threat to global health, especially in developed countries (1). Obesity increases the risk of
heart failure, but obese heart failure patients have a better prognosis and survival (2–4). Altered cardiac energy metabolism
is proposed to be an important contributor to this discrepancy. The aim of the
current study is to investigate cardiac structural, functional, and metabolic
changes during the development of heart failure in obese and lean
mice, in a longitudinal in vivo approach.
Methods
Starting at the age of 12 weeks mice were randomly assigned to either a High Fat Diet (HFD; 45 kcal% palm oil-based fat, 35 kcal% carbohydrate, 20 kcal% protein) or an isocaloric, sucrose matched Low Fat Diet (LFD; 10 kcal% palm oil-based fat, 70 kcal% carbohydrate, 20 kcal% protein). After 8 weeks mice were subjected to transverse aortic constriction (TAC) to induce pressure overload heart failure. A subset of LFD mice was given HFD 1 week post-TAC (postHFD). At baseline, 1, 5 and 12 weeks post-TAC, cardiac function, energetics and lipid content were measured as described below.
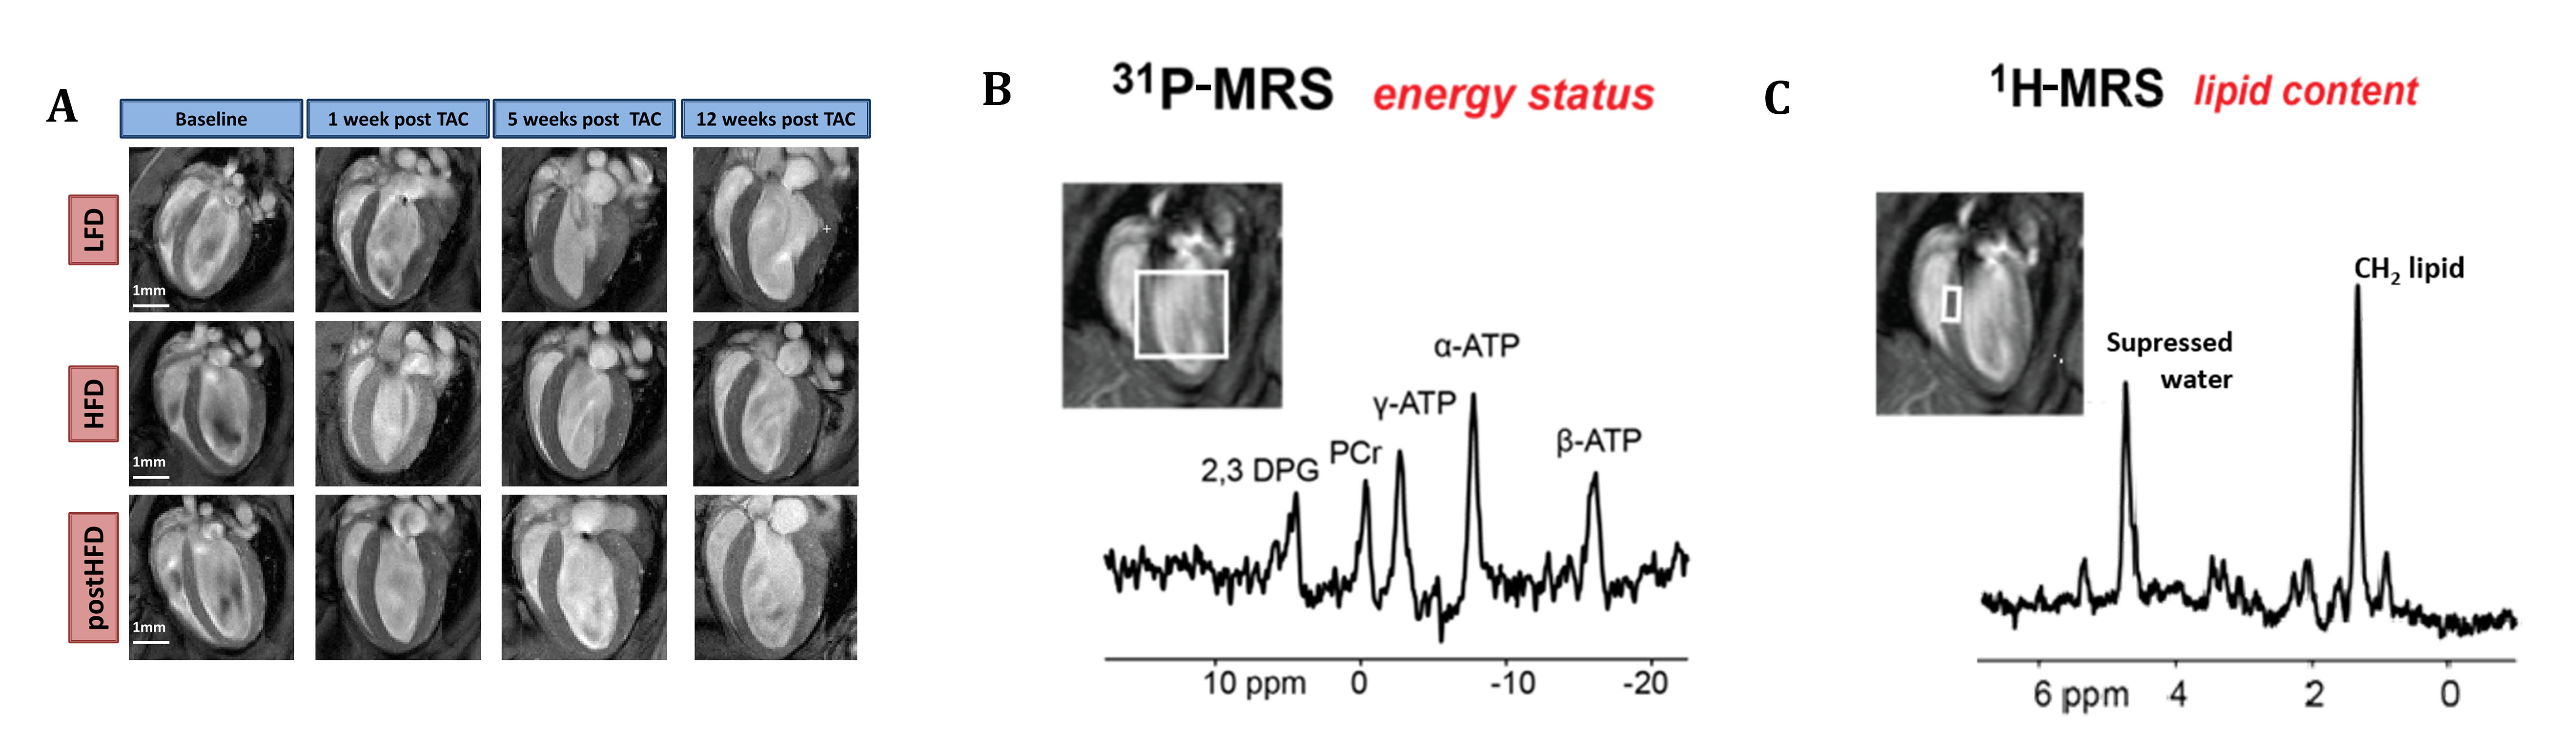
Cardiac systolic function was measured in cine movies from the beating heart (15-18 frames/cardiac cycle) acquired using prospectively cardiac-triggered gradient echo imaging of 6-8 contiguous short axis and 2 long axis slices (slice thickness 1 mm; Fig. 1A). Imaging parameters were as follows: repetition time: 7ms, echo time: 1.8ms, flip angle: 15⁰, matrix: 192x192, field of view: 30x30mm2, NA: 6. Left ventricular mass (LVM) and volume were semi-automatically delineated using Segment (version http://segment.heiberg.se). Stroke volume (SV) was calculated as the difference between end-diastolic volume (EDV) and end-systolic volume (ESV). Ejection fraction (EF) was calculated as (SV/EDV)*100%.
31P-MR spectroscopy was used to measured cardiac energy status using the image selected in vivo spectroscopy (ISIS) sequence in a voxel of typically ~6x6x6mm3 covering the LV at the end-diastolic phase (Fig. 1B) (5,6). The parameters were as follows: repetition time: 2s, 1.2ms 90⁰ sinc-shaped excitation pulse (bandwidth: 32.0ppm), 6.26ms 180⁰ adiabatic hyperbolic secant inversion pulses (bandwidth: 37.5ppm), 96 ISIS cycles, y-ATP on resonance. Data fitting and analysis was performed using AMARES in jMRUI (7,8). The ratio of PCr to y-ATP was used as a measure of cardiac energy status.
Myocardial lipid content was measured using 1H-MR spectra acquired from a 1x2x2mm3 voxel positioned in the interventricular septum during the diastolic phase of the cardiac cycle, using point resolved spectroscopy (PRESS) with chemical shift selective (CHESS) water suppression (Fig. 1C) (9). The parameters were as follows: repetition time: 2s, echo time: 9.1ms, 0.41ms 90⁰ Hermite-shaped excitation pulse, ~1ms 180⁰ Mao-type refocusing pulses, 256 averages. The spectra were processed and analyzed using AMARES in jMRUI (7,8). All metabolites (taurine, choline/carnitine, creatine and 7 peaks form lipids) were fitted to Gaussian line shapes. Myocardial metabolite levels were then calculated form the metabolite signal relative to the unsuppressed water signal measured in the same voxel.
Data are expressed as means ± SEM. Statistical significance of diet (LFD, HFD and postHFD) and time (baseline, 1, 5 and 12 weeks post-TAC) effect were assessed by a two-way ANOVA in SPSS v 21.0 (SPSS Inc., Chicago, IL, USA) with LSD-posthoc tests.
Results
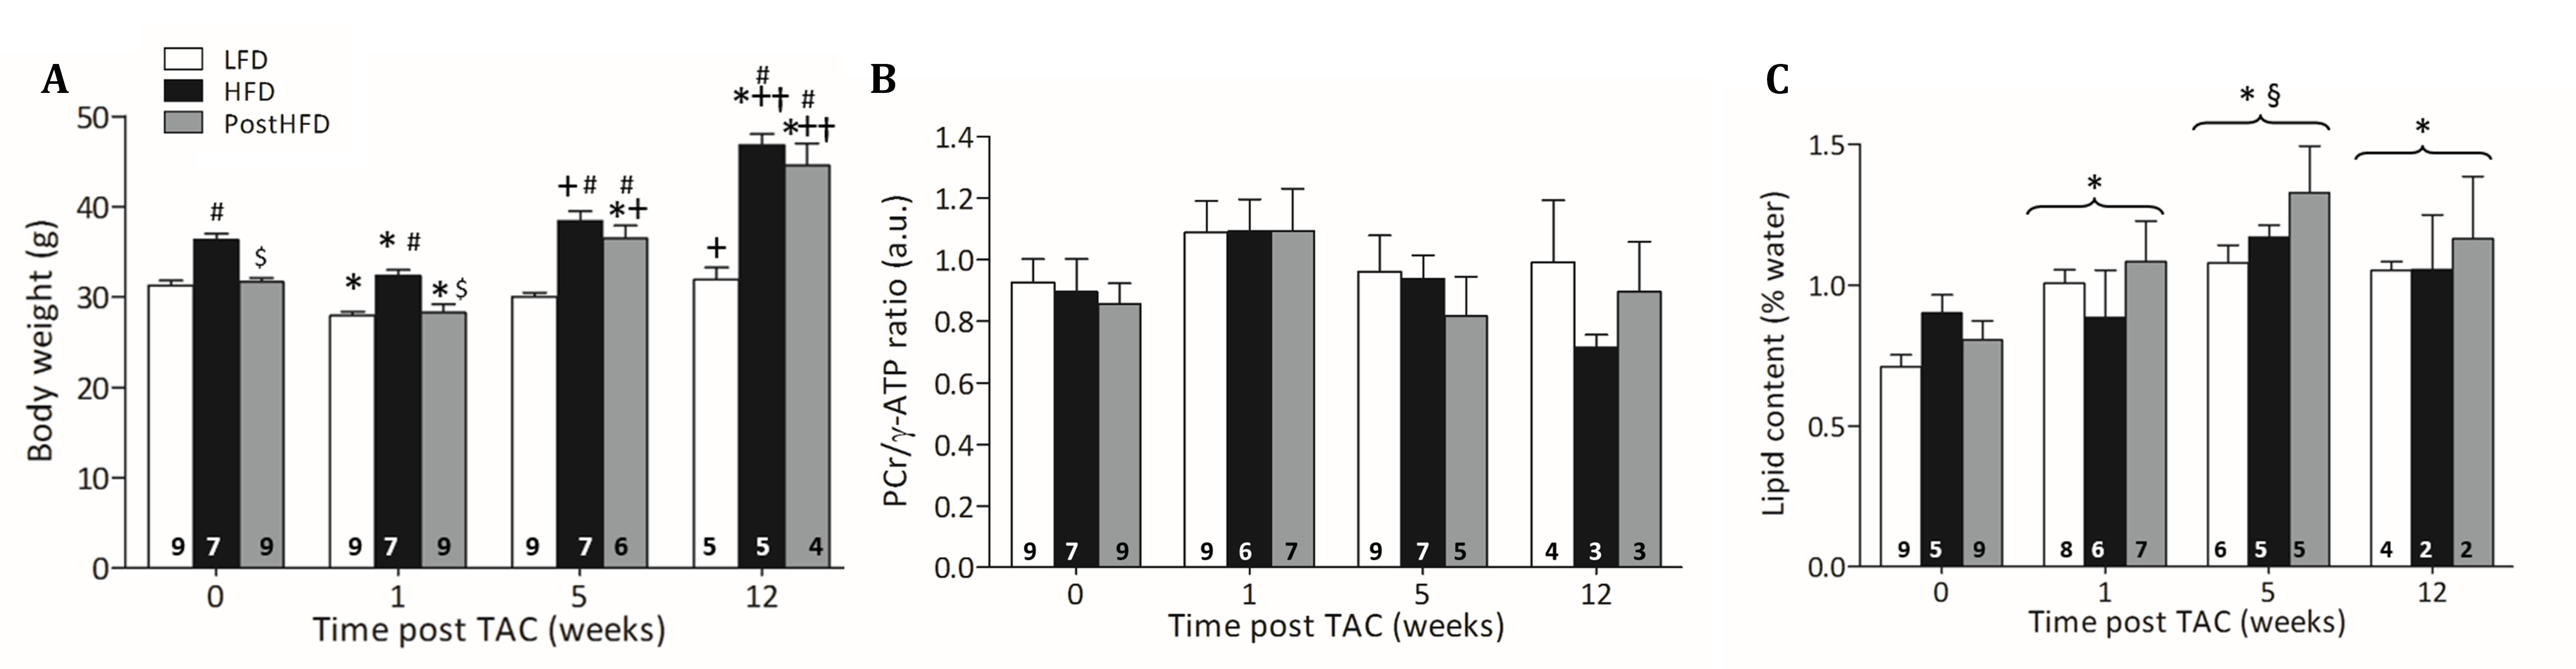
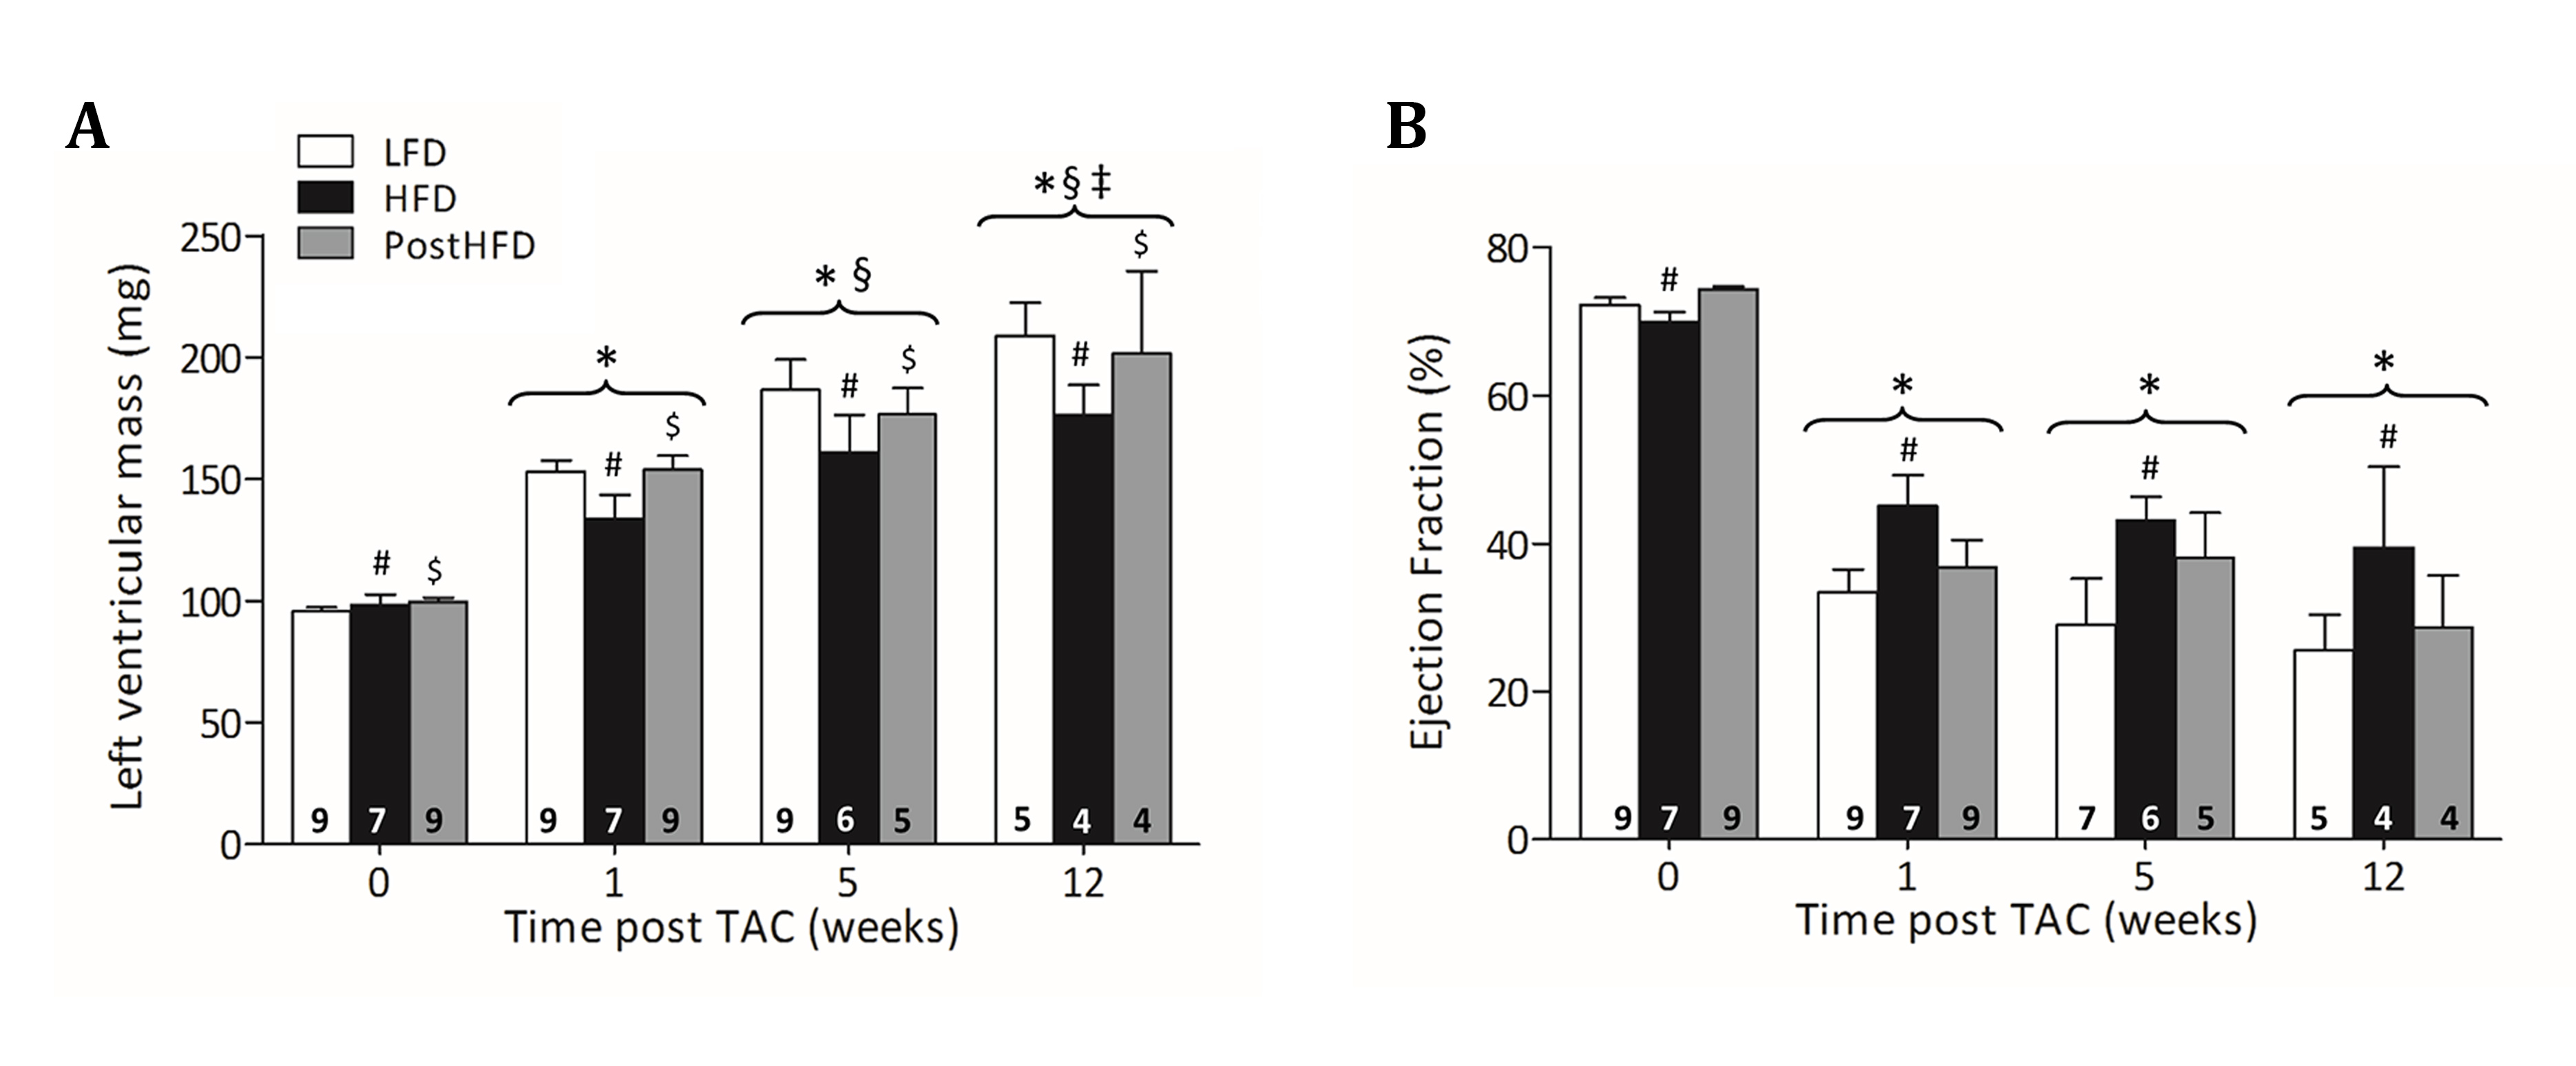
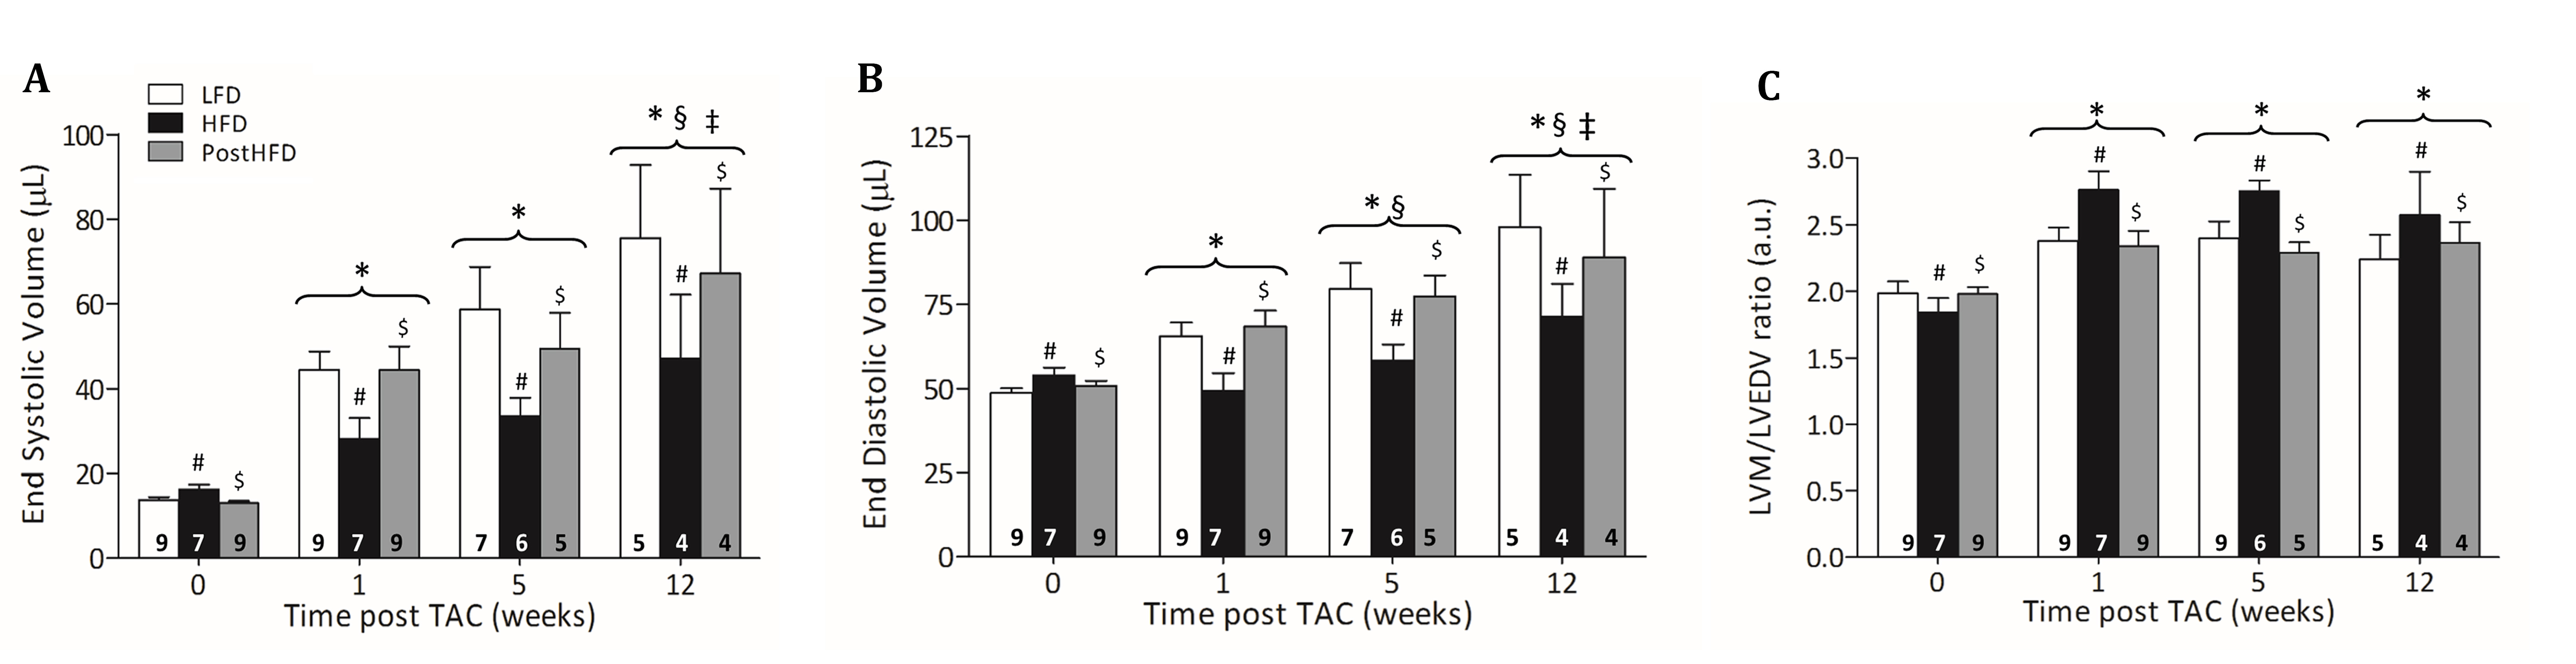
At all time points body weight (BW) was significantly higher in HFD compared to LFD (Fig. 2A). At 5 and 12 weeks post-TAC, also postHFD had a higher BW compared to LFD. Cardiac PCr/ATP ratio was not different between groups and was also not significantly altered post-TAC (Fig. 2B). Lipid content was not significantly different at baseline between groups, but increased significantly post-TAC in all groups (Fig. 2C). After TAC, LVM progressively increased in all groups (Fig. 3A). However, LVM was significantly lower in HFD compared to LFD and postHFD. EF declined significantly post-TAC in all groups, but remained significantly higher in HFD compared to LFD (Fig. 3B). Both EDV and ESV increased post-TAC in all groups. However, HFD had lower EDV and ESV compared to LFD and postHFD (Fig. 4A and 4B). The LVM/LVEDV ratio was significantly higher in HFD post-TAC, indicating more concentric hypertrophy (Fig. 4C).Discussion
In conclusion, cardiac function was less impaired in HFD mice compared with LFD mice after TAC, which was accompanied by a lower hypertrophic response. Moreover, LV hypertrophy was more concentric in HFD mice than in LFD mice, explaining the better maintained cardiac function in HFD mice after TAC. This suggests that metabolic adaptations induced by a HFD are not detrimental and may even be beneficial in heart failure development. However, cardiac function could not be rescued after TAC by starting a HFD.Acknowledgements
We thank the employees of the Central Animal Facility Maastricht for their technical support.References
1. Ng M, Fleming T, Robinson M, et al. Global, regional, and national prevalence of overweight and obesity in children and adults during 1980–2013: a systematic analysis for the Global Burden of Disease Study 2013. Lancet 2014;6736:1–16.
2. Lavie CJ, Osman AF, Milani R V, Mehra MR. Body composition and prognosis in chronic systolic heart failure: the obesity paradox. Am. J. Cardiol. 2003;91:891–894.
3. Oreopoulos A, Padwal R, Kalantar-Zadeh K, Fonarow GC, Norris CM, McAlister FA. Body mass index and mortality in heart failure: A meta-analysis. Am. Heart J. 2008;156:13–22.
4. Fonarow GC, Srikanthan P, Costanzo MR, Cintron GB, Lopatin M. An obesity paradox in acute heart failure: analysis of body mass index and inhospital mortality for 108,927 patients in the Acute Decompensated Heart Failure National Registry. Am. Heart J. 2007;153:74–81.
5. Bakermans AJ, Abdurrachim D, van Nierop BJ, et al. In vivo mouse myocardial 31P MRS using three-dimensional image-selected in vivo spectroscopy (3D ISIS): Technical considerations and biochemical validations. NMR Biomed. 2015;28:1218–1227.
6. Abdurrachim D, Ciapaite J, Wessels B, Nabben M, Luiken JJFP, Nicolay K, Prompers JJ. Cardiac diastolic dysfunction in high-fat diet fed mice is associated with lipotoxicity without impairment of cardiac energetics in vivo. Biochim. Biophys. Acta 2014;1841:1525–1537.
7. Stefan D, Cesare F Di, Andrasescu A, et al. Quantitation of magnetic resonance spectroscopy signals: the jMRUI software package. Meas. Sci. Technol. 2009;20:104035.
8. Vanhamme L, van den Boogaart A, van Huffel S. Improved method for accurate and efficient quantification of MRS data with use of prior knowledge. J. Magn. Reson. 1997;129:35–43.
9. Bakermans AJ, Abdurrachim D, Geraedts TR, Houten SM, Nicolay K, Prompers JJ. In vivo proton T1 relaxation times of mouse myocardial metabolites at 9.4 T. Magn. Reson. Med. 2014;0:4–9.
Figures