0546
Validation of Cardiac Diffusion Tensor MRI using Transparent Tissue Preparation (CLARITY) with 3D Optical Microscopy1Biomedical Imaging Research Institute, Cedars-Sinai Medical Center, Los Angeles, CA, United States, 2Division of Cardiology, Yonsei University College of Medicine, Seoul, Korea, Republic of, 3Departement of Pharmacology, Yonsei University College of Medicine, Seoul, Korea, Republic of, 4Bioengineering, University of California Los Angeles, Los Angeles, CA, United States
Synopsis
The myocardium consists of a complex 3-dimensional (3D) microstructure has been shown to be perturbed in the presence of myocardial ischemia. Recently, diffusion tensor magnetic resonance imaging (DT-CMR) was introduced which can characterize the 3D tissue microstructure in intact myocardium. However, past histologic validation of DTI has been limited since traditional pathology allows only 2D optical microscopy after potentially destructive tissue sectioning. We present a novel approach to validate the derivation of the myocardial fiber orientation (MFO) using DT-CMR with 3D histology using a non-destructive, transparent-tissue preparation technique (CLARITY). Results indicate MFO derived from 3D histology and DT-CMR are strongly concordant.
INTRODUCTION
The myocardium consists of a complex 3-dimensional (3D) microstructure has been shown to be perturbed in the presence of myocardial ischemia1. Recently, diffusion tensor magnetic resonance imaging (DT-CMR) was introduced which can characterize the 3D tissue microstructure in intact myocardium2. However, past histologic validation of DTI has been limited since traditional pathology allows only 2D optical microscopy after potentially destructive tissue sectioning3. We present a novel approach to validate the derivation of the myocardial fiber orientation (MFO) using DT-CMR with 3D histology using a non-destructive, transparent-tissue preparation technique (CLARITY4).METHODS
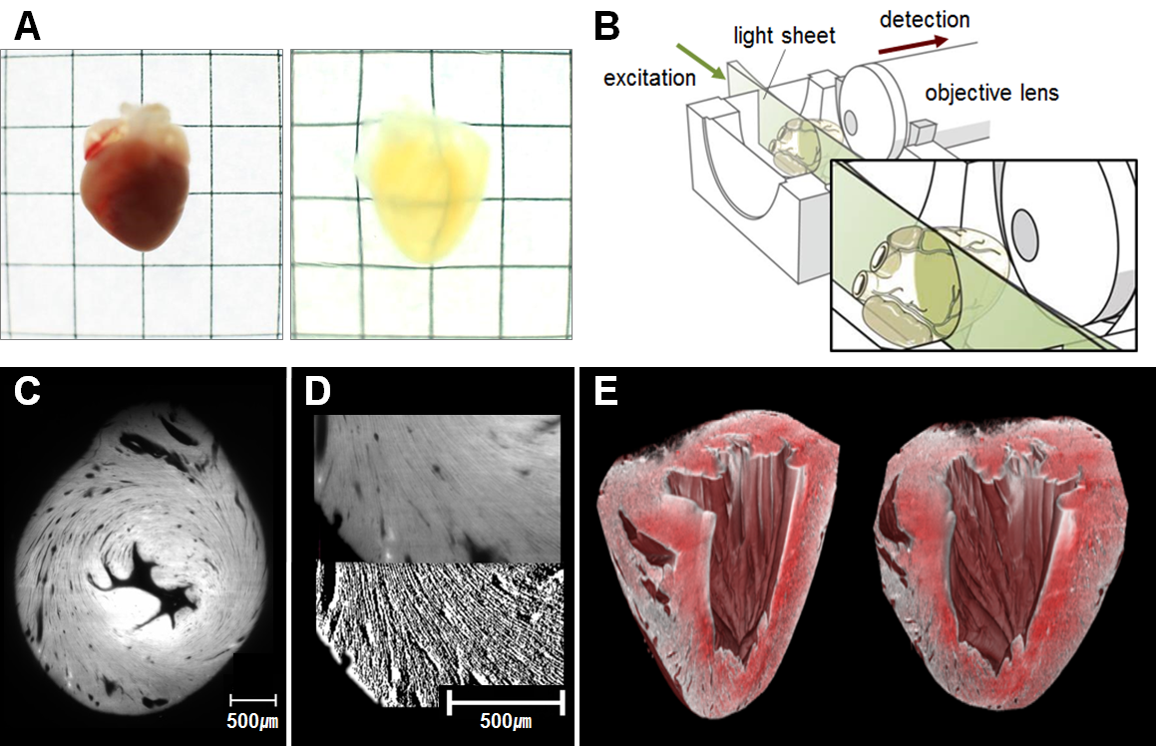
Validation of the approach was performed ex vivo in normal (n=7) and ischemic (n=8) mouse hearts after fixation. All hearts were scanned with a gold standard DT-CMR (single spin echo, 12 directions, b=1000 s/mm2, TR=8750ms, TE=36ms, NEX=5, 125x125x300um3, scan time=14hrs) sequence on a 9.4T Bruker (BioSpec 94/20 USR, Bruker Biospin) scanner. After CMR, the hearts were fixed and processed with CLARITY. After 1 month of CLARITY, 3D optical fluorescence imaging (638nm wavelength, 4.4x4.4x7.8um3, 5x objective lens) of the hearts were performed on an optical system (Light Sheet Z1, Carl Zeiss Microscopy Co) covering the entire left ventricle (LV).
DT-CMR images were processed using custom software based off DIPY (www.dipy.org) to estimate voxelwise self-diffusion tensors with primary eigenvectors assumed to be parallel to MFO. Raw optical images were processed with a 3D structural tensor analysis [5] to derive voxelwise MFO. Helix angle (HA) maps and HA transmurality (HAT) were calculated for both imaging modalities. HAT was calculated at 100 radial segments in the short axis plane for each slice. Comparison between DT-CMR and 3D optical microscopy was performed after down-sampling and co-registration of the calculated HA maps. Segment and global HAT comparisons between modalities for each subject were carried out.
RESULTS
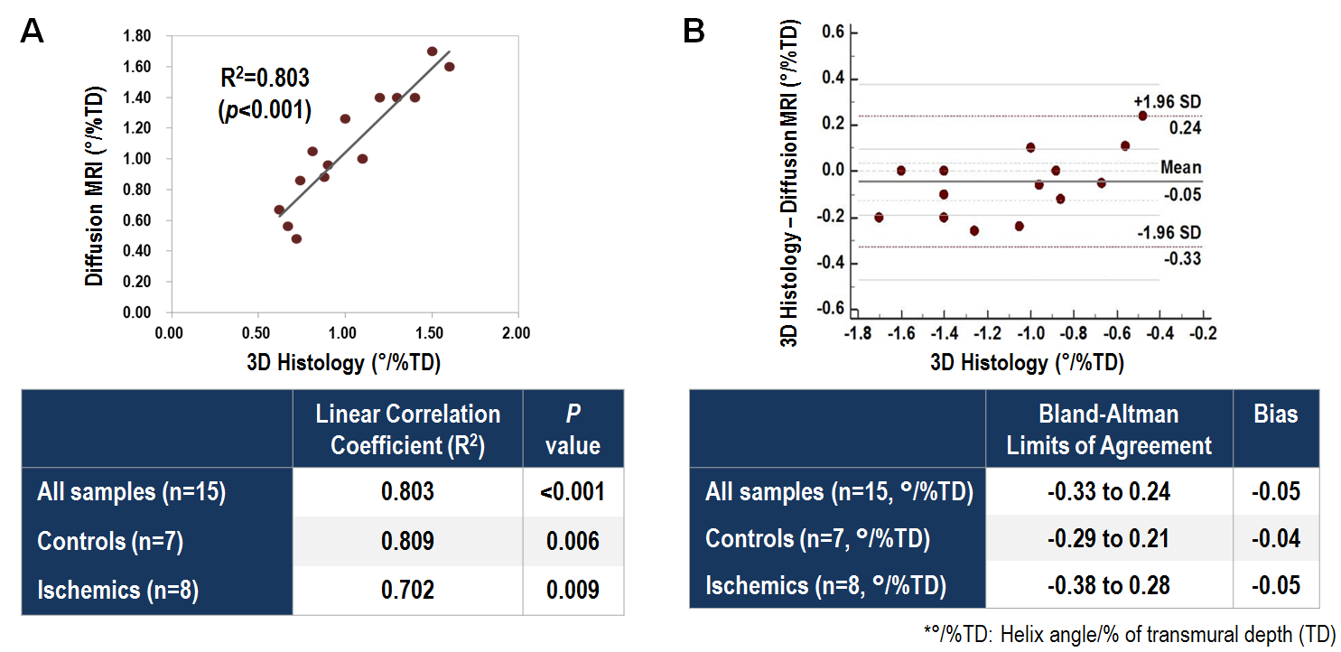
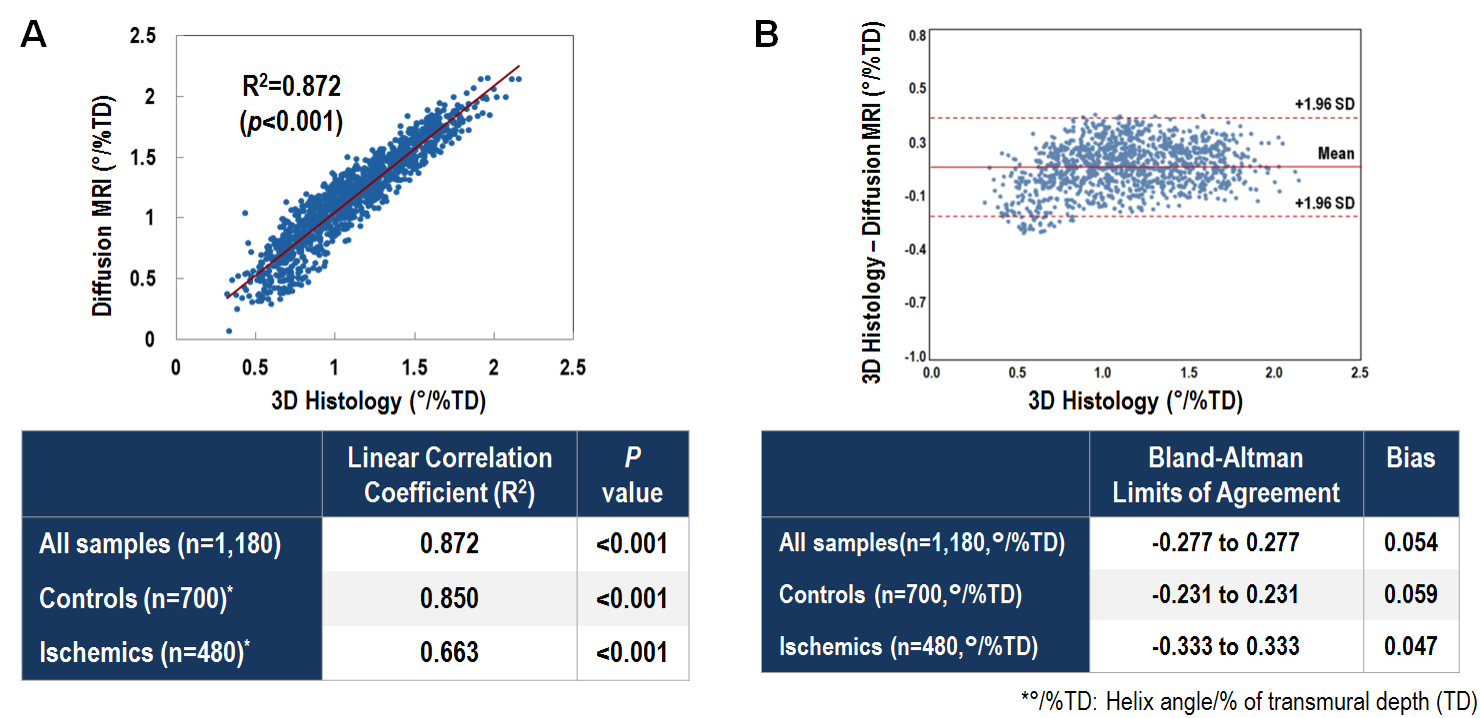
Segment HAT comparison between the two modalities demonstrated substantial correlation for normal (R2=0.85, p<0.05) and ischemic (R2=0.66, p<0.05) groups and across all subjects (R2=0.87, p<0.05). Correlation of global HAT was also substantial (R2=0.80, p<0.05) between both modalities across all subjects and within normal (R2=0.81, p<0.05) and ischemic (R2=0.70, p<0.05) groups. Normal HAT (DT-CMR: 1.31±0.20°/% transmural depth (TD) vs optical: 1.36±0.27°/%TD) was significantly (p<0.05) larger than ischemic HAT (DT-CMR: 0.79±0.13°/%TD vs optical: 0.84±0.26°/%TD) for both modalities.DISCUSSION
There was fundamental doubt that diffusion motility of water molecules accurately reflected myocardial fiber architecture. CLARITY allowed 3D optical imaging to be performed on an intact heart sample and thus could be used to validate DT-CMR by directly visualizing the cardiac muscle fibers. Optical-derived and DT-CMR-derived fiber orientations of the heart in both normal and diseased hearts exhibited substantial correlation and agreement. This demonstrates that DT-CMR does indeed fundamentally reflect myocardial fiber orientation.CONCLUSION
DT-CMR fundamentally reflects myocardial fiber orientation in ex vivo conditions showing concordance with CLARITY-based 3D optical imaging in intact normal and ischemic myocardium. This anchors the vast literature of DT-CMR studying myocardial fiber architecture and allows future studies to confidently draw conclusions from DT-CMR studies.Acknowledgements
No acknowledgement found.References
1. Mekkaoui C, Huang S, Chen HH, Dai G, Reese TG, Kostis WJ, Thiagalingam A, Maurovich-Horvat P, Ruskin JN, Hoffmann U, Jackowski MP, Sosnovik DE. Fiber architecture in remodeled myocardium revealed with a quantitative diffusion CMR tractography framework and histological validation. Journal of Cardiovascular Magnetic Resonance. 2012;14(1):70.
2. Sosnovik DE, Wang R, Dai G, Reese TG, Wedeen VJ. Diffusion MR tractography of the heart. Journal of Cardiovascular Magnetic Resonance. 2009;11(1):47.
3. Scollan DF, Holmes A, Winslow R, Forder J. Histological validation of myocardial microstructure obtained from diffusion tensor magnetic resonance imaging. Am. J. Physiol. 1998 Dec;275(6 Pt 2):H2308–18.
4. Budde MD, Annese J. Quantification of anisotropy and fiber orientation in human brain histological sections. Front Integr Neurosci. Frontiers; 2013;7:3. PMCID: PMC3561729
Figures