0544
Non-contrast assessment of vasodilator response using native myocardial T1 and T2 mapping and Arterial Spin Labeled CMR1Physical Sciences Platform, Sunnybrook Research Institute, Toronto, ON, Canada, 2Schulich Heart Program, Sunnybrook Research Institute, Toronto, ON, Canada, 3Department of Medical Biophysics, University of Toronto, Toronto, ON, Canada, 4Department of Physics and Astronomy, University of Southern California, Los Angeles, CA, United States, 5Ming Hsieh Department of Electrical Engineering, University of Southern California, Los Angeles, CA, United States
Synopsis
Myocardial vasodilator response is an important indicator of microvascular function and integrity in ischemic injury. The objective of our study was to systematically compare myocardial stress response with native contrast mechanisms involving quantitative T2, T1 and Arterial spin labeled (ASL) imaging. Our findings suggest that oxygenation (T2 BOLD effect), blood volume (T1 effect) and perfusion (ASL) taken together could offer a complementary contrast-free framework to identify vasodilator dysfunction in heart disease. These could potentially offer insights into the myocardial remodeling process particularly in the remote territory, which develops hypertrophy and fibrosis in the high-risk patients in the chronic stage.
Introduction
Following acute myocardial infarction (AMI), many patients experience compromised microvascular integrity and function (1,2). This is commonly manifested in the form of ‘no-reflow’ or microvascular obstruction (MVO) in the infarcted territory. It has further been demonstrated that remote myocardial territories may also exhibit impaired myocardial blood flow (MBF) patterns associated with abnormal vasodilator response (3). Several native MRI techniques are emerging to non-invasively assess myocardial stress response post ischemic injury - T2-based blood-oxygen-level-dependent effect (T2-BOLD) (4); Rest-Stress Native T1 mapping (5) and Arterial spin labeled CMR (ASL-CMR) for myocardial blood flow (MBF) quantification (6). The objective of our study was to systematically compare the myocardial response observed with these techniques in association with the nature of contrast generated (BOLD, blood volume and blood flow effect) in an experimental porcine model.Methods
Healthy Yucatan minipigs were imaged on a 3T scanner (GE Healthcare, MR750) (N=7). T2 mapping was performed using a previously validated T2-prepared spiral sequence: 12 spirals (3072 points), in-plane resolution = 1 mm, slice thickness = 5 mm, 5 TE’s (2.9-184.2 ms) (4). T1 values were quantified using a Modified Look-Locker T1 Imaging (MOLLI) sequence; 3-5 pattern with 7 pausing heart-beats acquiring 8 images in 15 heart-beats; in-plane resolution = 1.75 mm, slice thickness = 5 mm. ASL-CMR was performed using a flow-sensitive alternating inversion recovery (FAIR) labeling and steady state free precession (SSFP) image acquisition strategy (parameters: TE/TR=1.5/3.2ms, FA = 500, slice thickness = 10 mm, matrix size of 96x96, parallel imaging factor of 2, in-plane resolution = 2 mm). Labeling and imaging were gated at mid-diastole. All sequences were acquired in two mid-ventricular short axis slices and were repeated following an intravenous injection of Dipyridamole to assess vasodilator function. Global and segmental T1 and T2 changes were computed using %T change (100*[Tstress-Trest]/Trest) while MBF and myocardial perfusion reserve (MPR=MBFstress/MBFrest) were computed as global quantities.
Results
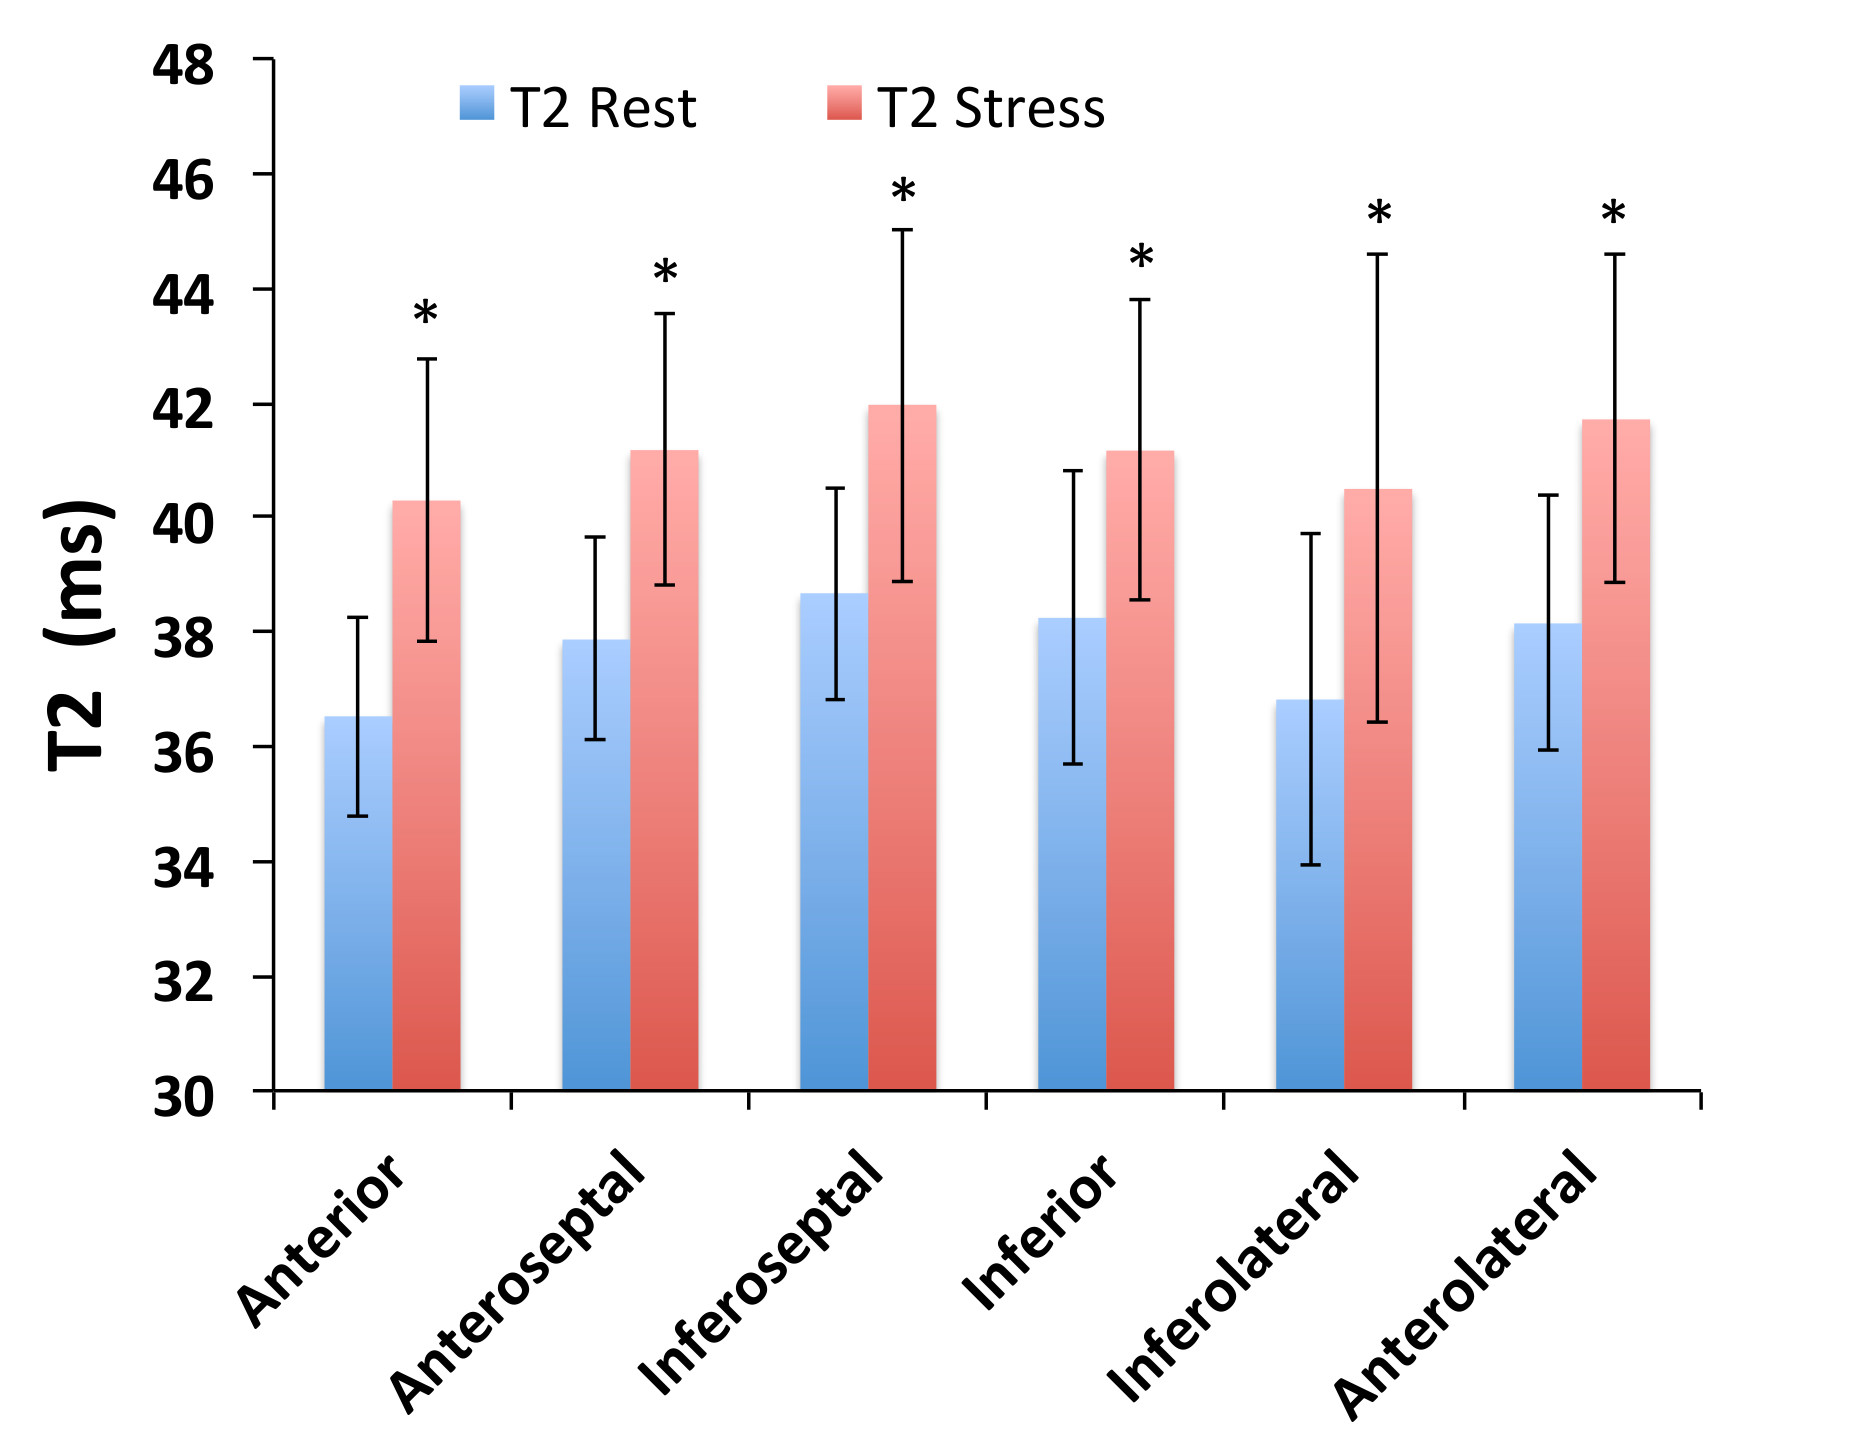
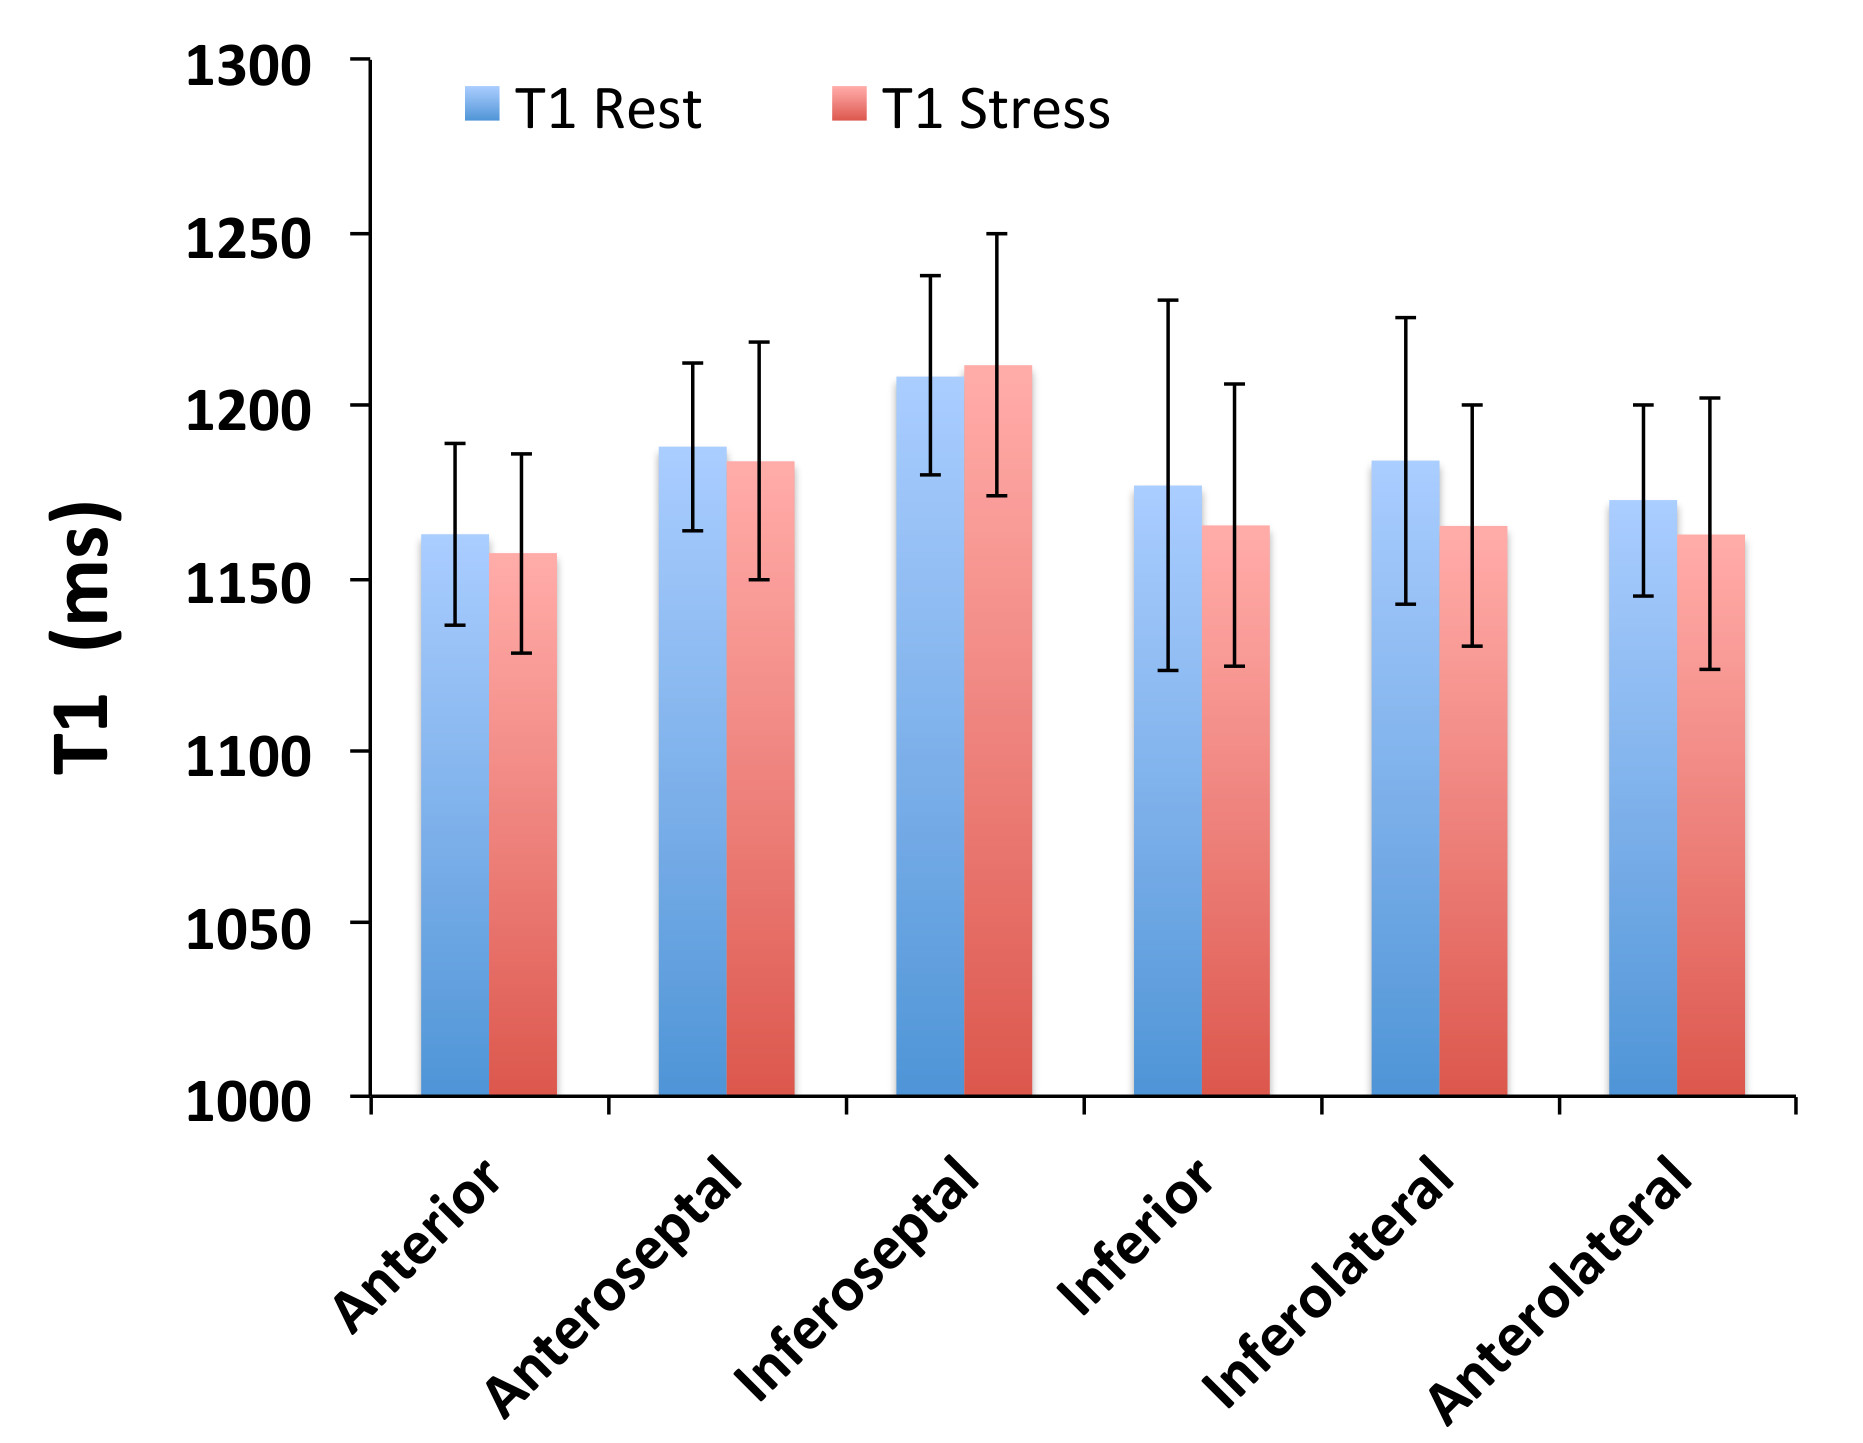
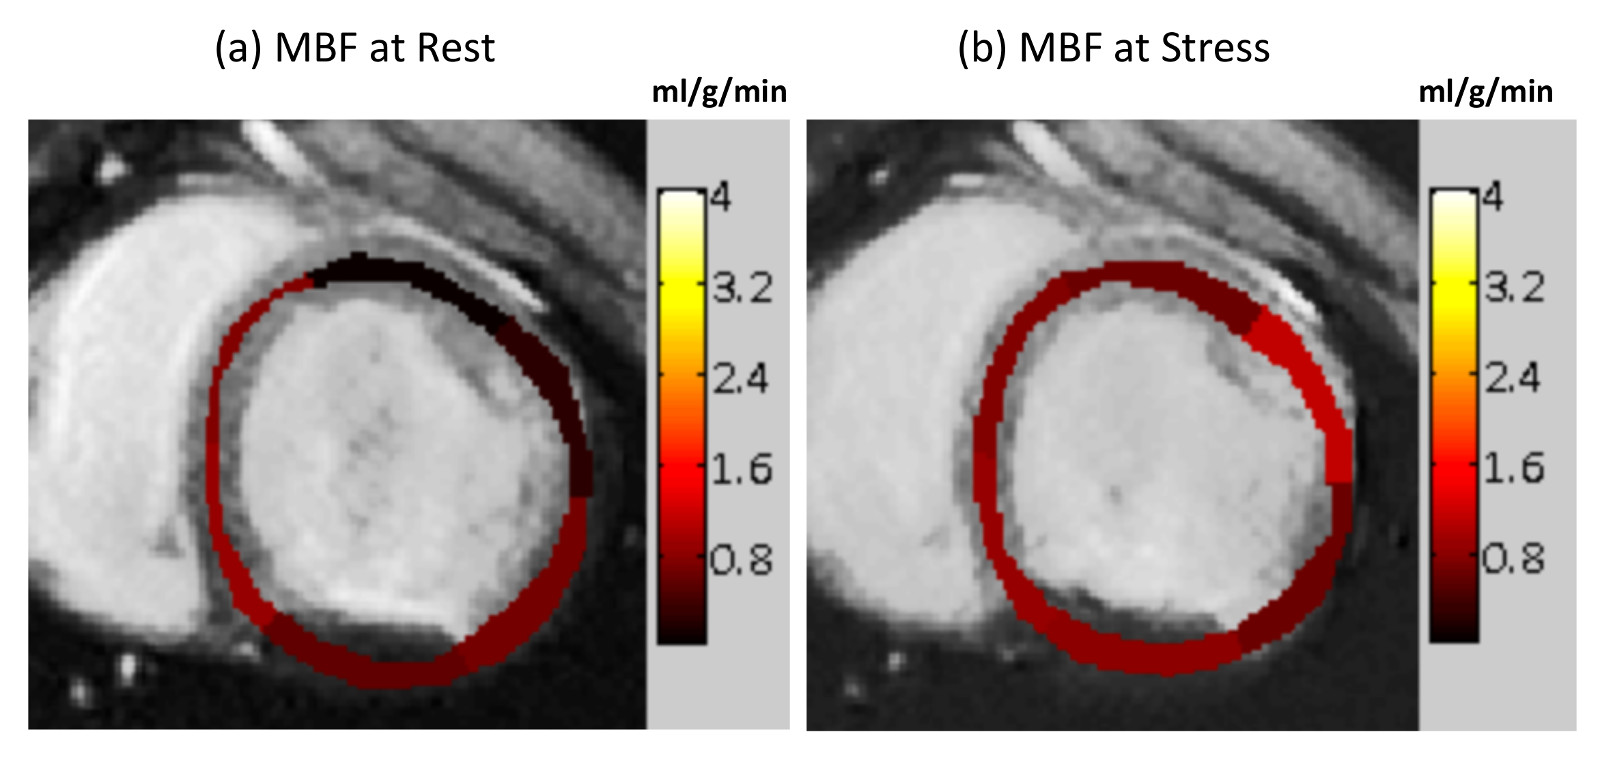
T1 and T2 quantification was performed in 14 mid-ventricular slices with 6 myocardial segments each (total 84 measurements); Figure 1 shows representative short-axis slices from one animal in the rest state. Figure 2 demonstrates that the T2 value at stress was significantly increased compared to the rest state (8-12% change) in all 6 myocardial segments in each of the imaged slices (p<0.0001). However we did not note any significant change in T1 associated with a stress response (Figure 3). Global MBF was available from ASL-CMR images in a sub-set of four animals (MBFrest = 0.58±0.1 and MBFstress = 0.91±0.2 ml/g/min; p=0.07 and MPR=1.6±0.6). Figure 4 demonstrates ASL-CMR images representing MBF maps in rest and stress states. In this sub-set of animals, global T2 was significantly elevated under stress (T2rest = 37.3±1.8 and T2stress = 41.2±2.4 ms; p=0.04 and %T2 change = 10.5±1.8) but not T1 (T1rest = 1120.5±47 and T1stress = 1143.4±67 ms; p=NS and %T1 change = 2.0±3.8).Discussion
The T2-based blood-oxygen-level-dependent effect (T2-BOLD) has been previously exploited to serially assess stress response in a porcine model of AMI (4). In our study, the T2 elevation with coronary vasodilation could be attributed to this blood oxygenation effect and/or changes in blood volume as has been observed in prior studies. Recently, rest-stress native T1 mapping has been shown to be able to distinguish normal, remote, infarcted and ischemic myocardial response via changes in blood volume (5). Our study did not observe any notable elevation in T1 post stress suggesting minimal or no changes in blood volume with dipyridamole administration. One previous study has indicated a non-significant 14% elevation in blood volume in pigs with dipyridamole vasodilation (7); in this context, the sensitivity of T1 alterations with vasodilators needs to be further evaluated. Arterial spin labeled CMR (ASL-CMR) is a novel native MR based technique that can quantify myocardial blood flow (MBF) regionally and serially post-AMI and also post-stress (8). Our findings show that T2-BOLD and MBF alterations go hand in hand, suggesting oxygenation and perfusion are closely linked to vasodilator function. Our study demonstrates that the T2-BOLD, native T1 and ASL-CMR techniques offer a contrast-free alternative to evaluate vasodilator function in heart disease. Taken together, they can potentially provide complementary insights into the myocardial remodeling process particularly in the remote territory, which develops hypertrophy and fibrosis in the high-risk patients in the chronic stage.Acknowledgements
We would like to acknowledge funding support from the Ontario Research Fund (ORF-RE7) and the American Heart Association 13GRNT13850012.References
1. Jaffe R, Charron T, Puley G, Dick A, Strauss BH. Microvascular obstruction and the no-reflow phenomenon after percutaneous coronary intervention. Circulation 2008;117:3152–3156.
2. Ishihara M, Sato H, Tateishi H, Kawagoe T, Yoshimura M, Muraoka Y. Impaired coronary flow reserve immediately after coronary angioplasty in patients with acute myocardial infarction. Br Heart J 1993;69:288–292.
3. Uren NG, Crake T, Lefroy DC, de Silva R, Davies GJ, Maseri A. Reduced coronary vasodilator function in infarcted and normal myocardium after myocardial infarction. N Engl J Med 1994;331:222–227.
4. Ghugre NR, Ramanan V, Pop M, Yang Y, Barry J, Qiang B, Connelly KA, Dick AJ, Wright GA. Myocardial BOLD imaging at 3 T using quantitative T(2): Application in a myocardial infarct model. Magn Reson Med 2011;66:1739–1747.
5. Liu A, Wijesurendra RS, Francis JM, Robson MD, Neubauer S, Piechnik SK, Ferreira VM. Adenosine Stress and Rest T1 Mapping Can Differentiate Between Ischemic, Infarcted, Remote, and Normal Myocardium Without the Need for Gadolinium Contrast Agents. JACC Cardiovasc. Imaging 2016;9:27–36.
6. Zun Z, Varadarajan P, Pai RG, Wong EC, Nayak KS. Arterial spin labeled CMR detects clinically relevant increase in myocardial blood flow with vasodilation. JACC Cardiovasc. Imaging 2011;4:1253–1261.
7. McCommis KS, Goldstein TA, Zhang H, Misselwitz B, Gropler RJ, Zheng J. Quantification of myocardial blood volume during dipyridamole and doubtamine stress: a perfusion CMR study. J Cardiovasc Magn Reson 2007;9:785–792.
8. HP Do, V Ramanan, GA Wright, NR Ghugre, KS Nayak. Non-contrast Vasodilator Response Assessment in a porcine model of Acute Myocardial Infarction using Arterial Spin Labeled CMR. ISMRM 2016:0999.
Figures