0536
Feasibility study of intervertebral disc degeneration assessment using phase imaging1Department of Radiology, Seoul St.Mary's Hospital, College of Medicine, The Catholic University of Korea, Seoul, Korea, Republic of, 2Center for neuroscience imaging research, Institute for Basic Science, Suwon, Korea, Republic of
Synopsis
In this study, we hypothesized that a GRE phase can be a potential indicator of annulus fibrosus integrity, because of its high sensitivity to micro-structural tissue change. With this hypothesis, we investigate the feasibility of GRE phase in the assessment of intervertebral disc degeneration in the lumbar spine. Ex vivo animal disk samples and nine human subjects were scanned and the high-pass filtered phase images were evaluated. For both ex vivo and in vivo experiments, distinctive phase contrasts were observed in the annulus fibrosus of the normal intervertebral discs.
Purpose
Intervertebral disc (IVD) degeneration is regarded as a major cause of lower-back pain.1,2 Although T2-weighted imaging has been widely used for the morphologic grading of IVD degeneration, it is observer-dependent and of limited value in early IVD degeneration.3 For this reason, quantitative MR techniques such as T2 mapping or T1rho mapping have been proposed for IVD assessment.4,5 These techniques provide quantitative information on nucleus purposus (NP). However, outer annulus fibrosus (AF), which is significantly associated with early or progressive degeneration of IVD, cannot be assessed with these techniques. We hypothesized that a GRE phase can be a potential indicator of AF integrity, because of its high sensitivity to micro-structural tissue change.6 In this study, we investigate the feasibility of GRE phase in the assessment of IVD degeneration in the lumbar spine.Methods
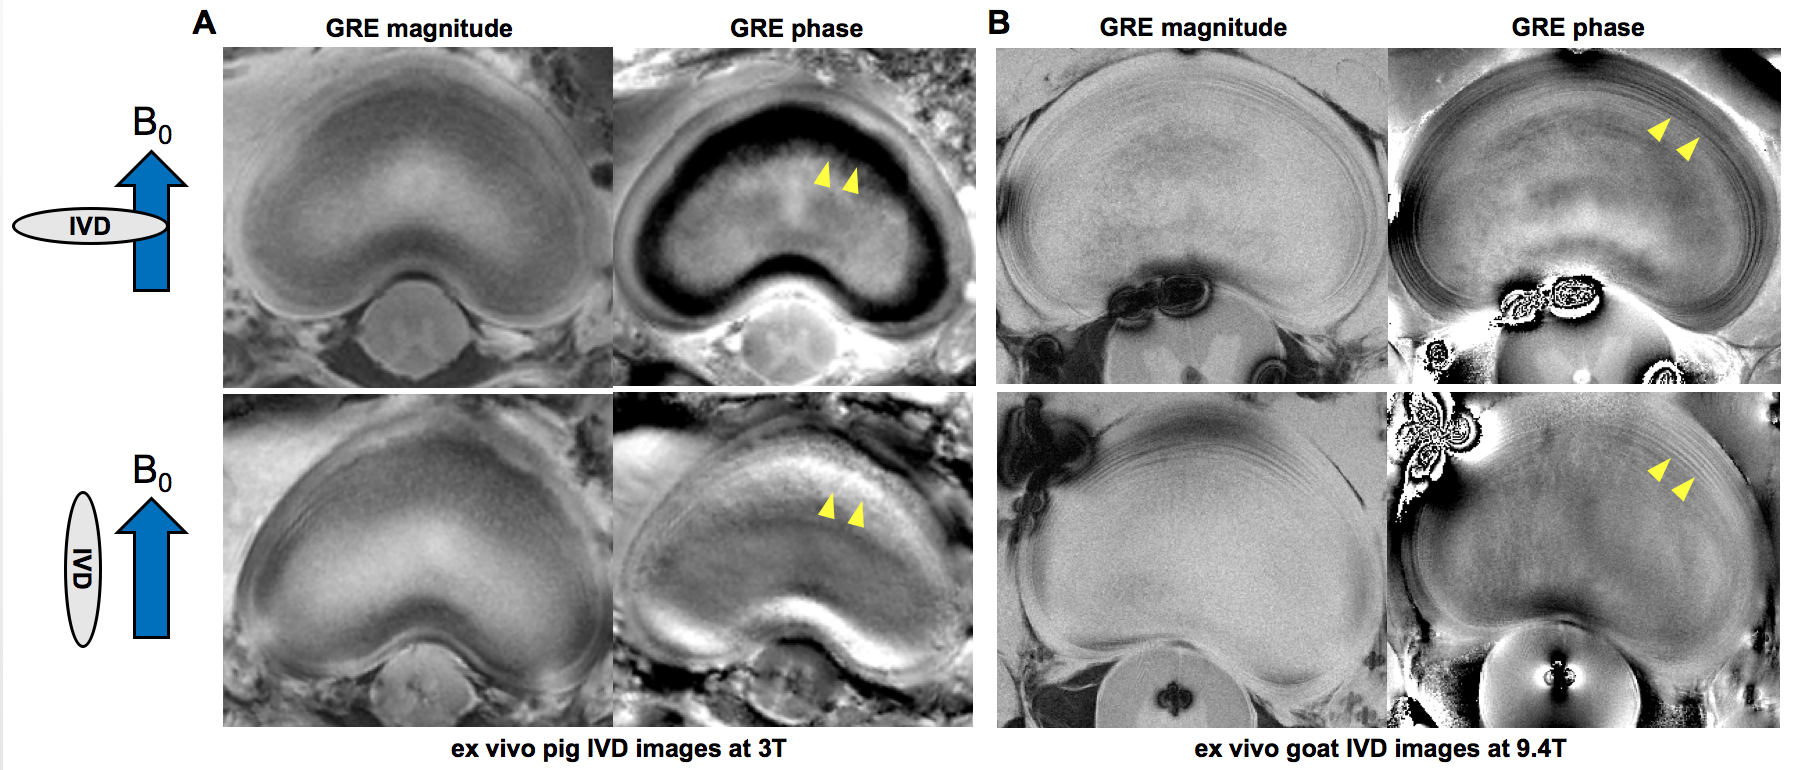
ex vivo experiments Ex vivo animal IVD samples were scanned at 3T clinical MRI (Verio, Siemens) and 9.4T animal MRI (Biospin, Bruker) with two different orientations (perpendicular to B0 field and parallel with B0 field as described in Fig.1). At 3T, a pig disk sample was scanned with following parameters: 2D GRE, TR = 29 ms, TE = 16 ms, flip angle = 10 °, in-plane resolution = 0.5 x 0.5 mm2, slice thickness = 3 mm, NEX = 2, scan time = 4 min 58 s. At 9.4T, a goat disk sample was scanned with following parameters: 2D GRE, TR = 200 ms, TE = 5 ms, flip angle = 30 °, in-plane resolution = 0.078 x 0.078 mm2, slice thickness = 2 mm, NEX = 8, scan time = 14 min.
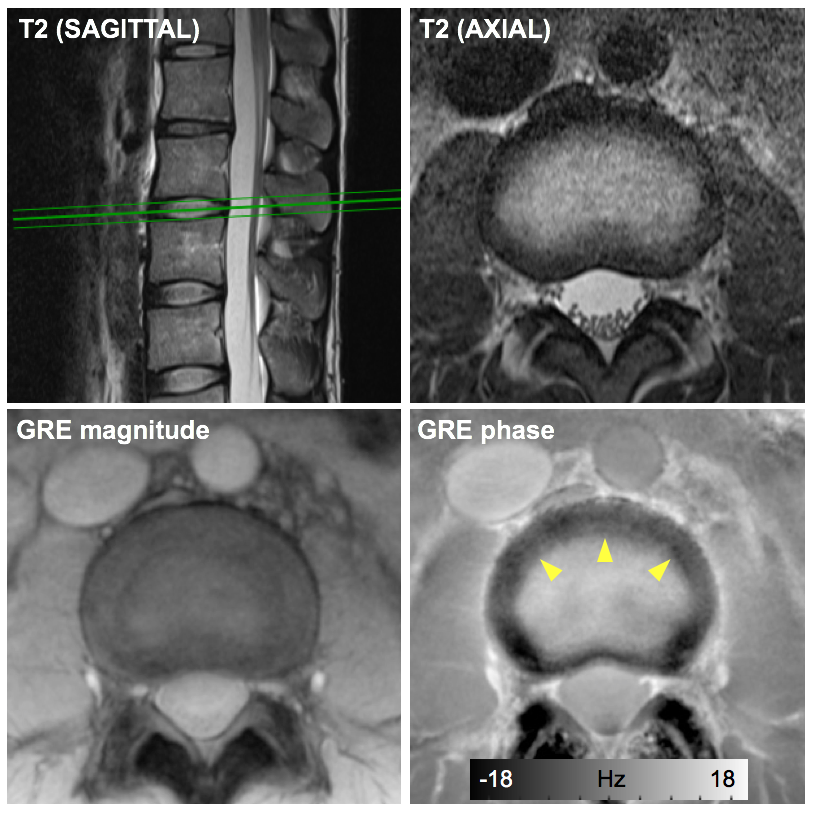
in vivo experiments Nine subjects (6 female, mean age = 42±13) were scanned at 3T clinical MRI (Verio, Siemens). For phase imaging, a multi-echo 2D GRE was acquired with following parameters: TR = 126 ms, TE = 7.5/12.5/17.5 ms, flip angle = 30 °, in-plane resolution = 0.5 x 0.5 mm2, slice thickness = 8 mm, 4 axial slices (L2-L3,L3-L4,L4-L5,L5-S1), NEX = 2, scan time = 2 min 49 s.
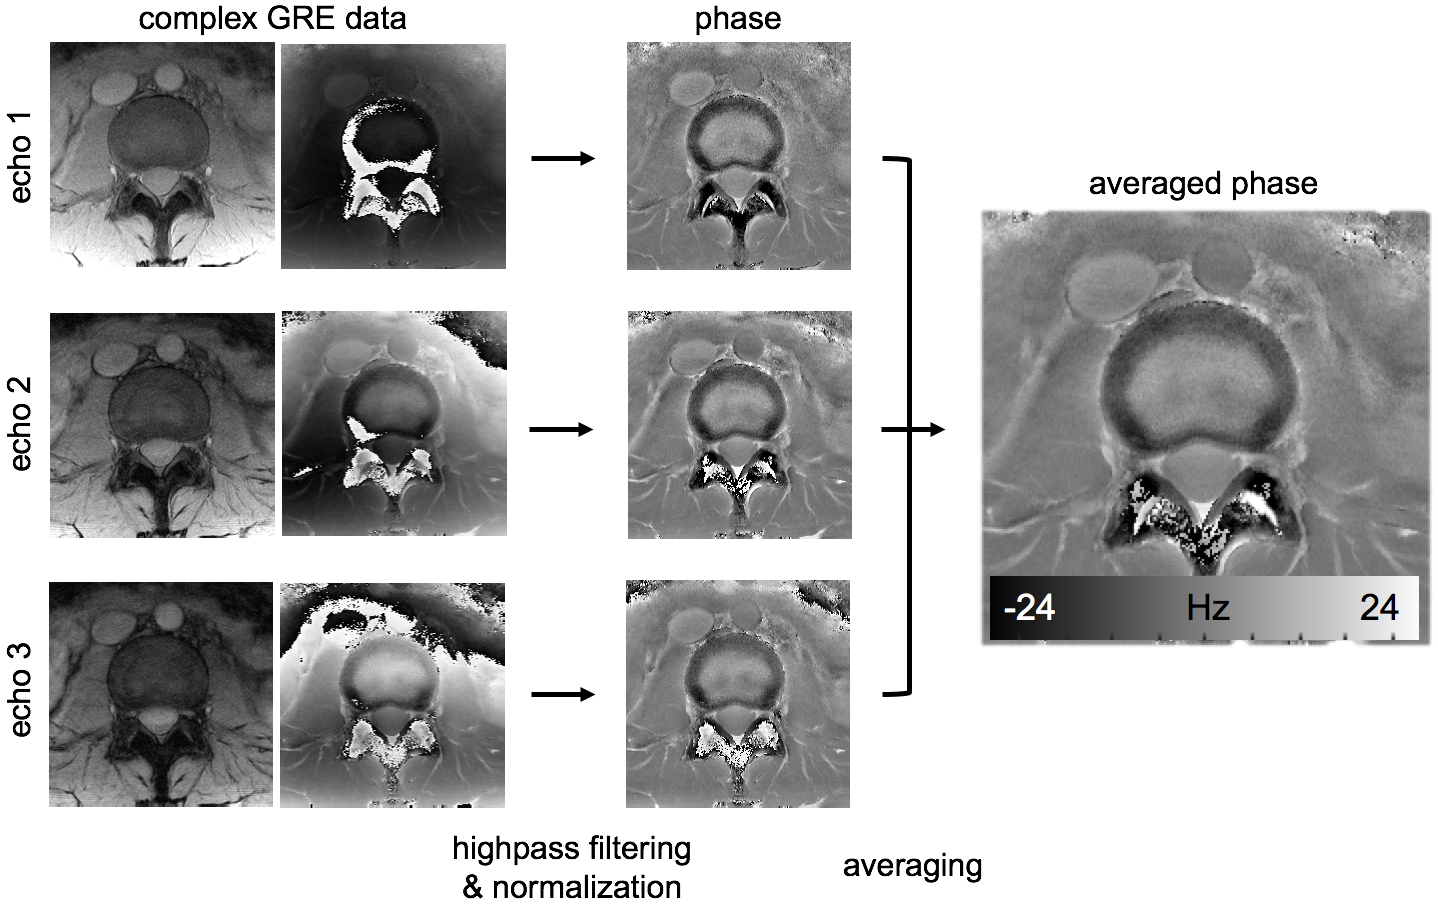
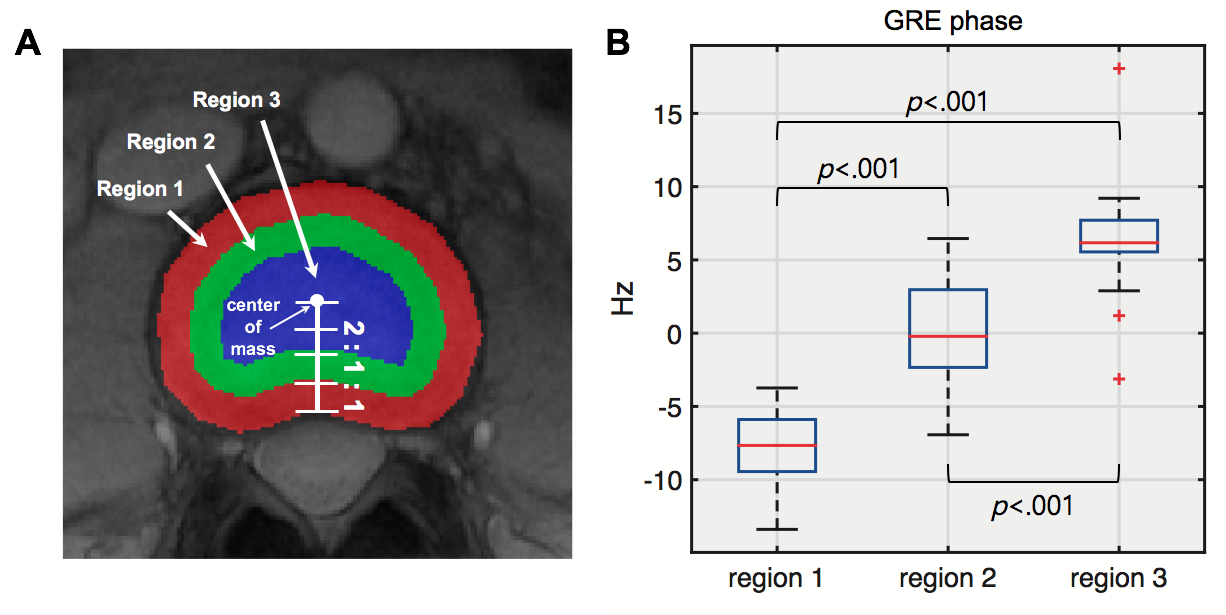
Image processing and analysis Homodyne filtering (Gaussian kernel, σ = 4 mm for ex vivo animal IVDs and σ = 16 mm for in vivo human IVDs) was performed to remove background phase. For multi-echo data, the filtering was performed in each echo image and normalized by echo time. Then, the filtered phase images were averaged. This process was summarized in Fig. 1. For in vivo data, a quantitative analysis was performed by manually dividing subregions of IVD : outer AF, inner AF, NP. The margins of IVDs were manually drawn on magnitude images, and three subregions were automatically segmented as shown in Fig. 4a. Three IVD levels (L2-L3, L3-L4 and L4-L5) which have similar orientations relative to B0 were evaluated to minimize orientation dependent effects. A radiologist graded the IVD as normal (Pfirrmann grade 1 and 2) and degenerated (Pfirrmann grade 3, 4 and 5) using T2-weighted images, and degenerated IVDs were excluded in the quantitative analysis. For the three subregions, average frequency values were calculated and a t-test was performed to determine statistical significance between the regions.
Results
Figure 2 shows the results from the ex vivo experiments. Both 3T and 9.4T results demonstrated B0 orientation dependent phase contrasts between the AF regions and other regions (arrowheads in Fig. 2), suggesting the contrasts were induced by the organized structures with diamagnetic susceptibilities. In addition, the 9.4T results showed a direct correlation between the lamellar structures in the AF regions and the phase contrasts in these regions (arrowheads in Fig. 2B). Figure 3 shows the representative images from the in vivo experiments. Distinctive contrasts (arrowheads in Fig.3) were observed in the GRE phase images compared to other contrast images. After the exclusion of 7 degenerated IVDs, 20 IVDs from healthy volunteers were included in quantitative analysis. The quantitative analysis showed the significant differences (p<0.001) between three subregions in the normal IVDs (Fig. 4).Discussion
We demonstrated the potential of GRE phase imaging for assessment of IVD degeneration with an emphasis on AF. For both ex vivo and in vivo experiments, negative phase contrasts were clearly observed in the AF of the normal IVDs when the long axis of the IVDs were placed perpendicular to B0. Due to the insufficient number of the abnormal appearing IVDs, we did not perform a quantitative analysis for the degenerated IVDs. Analysis of the phase images in a large population which consisted of both healthy volunteers and patients might be valuable for future clinical studies.Acknowledgements
This research was supported by Basic Science Research Program through the National Research Foundation of Korea (NRF) funded by the Ministry of Education (NRF-2016R1A6A3A01007677).References
1. Osti OL, Vernon-Roberts B, Moore R, Fraser RD. Annular tears and disc degeneration in the lumbar spine. A post-mortem study of 135 discs. J Bone Joint Surg Br. 1992;74(5):678-82.
2. Peng B, Hou S, Wu W, Zhang C, Yang Y. The pathogenesis and clinical significance of a high-intensity zone (HIZ) of lumbar intervertebral disc on MR imaging in the patient with discogenic low back pain. Eur Spine J. 2006;15(5):583-7.
3. Pfirrmann CW, Metzdorf A, Zanetti M, Hodler J, Boos N. Magnetic resonance classification of lumbar intervertebral disc degeneration. Spine. 2001;26(17):1873-8.
4. Marinelli NL, Haughton VM, Anderson PA. T2 relaxation times correlated with stage of lumbar intervertebral disk degeneration and patient age. AJNR Am J Neuroradiol. 2010;31(7):1278-82.
5. Zhou Z, Jiang B, Zhou Z, Pan X, Sun H, Huang B, et al. Intervertebral disk degeneration: T1rho MR imaging of human and animal models. Radiology. 2013;268(2):492-500.
6. Duyn, J. H., van Gelderen, P., Li, T.-Q., de Zwart, J. A., Koretsky, A. P., & Fukunaga, M. (2007). High-field MRI of brain cortical substructure based on signal phase. Proceedings of the National Academy of Sciences, 104(28), 11796–11801.
Figures