0534
Correlations and differences of myocardial blood flow with simultaneous measurements of MRI and PET1Department of Radiology, Mallinckrodt Institute of Radiology, Washington University in St. Louis, Saint Louis, MO, United States
Synopsis
The presented study explores correlations and differences of myocardial blood flow measured with MRI and PET. We employed a post-processing method to estimate the arterial input function using gamma variate model. Rest/stress quantitative PET/MRI cardiac perfusion study were simultaneously performed on sixteen patients with myocardial ischemia. The results demonstrated the feasibility of the new AIF estimation method for the quantification of MBF by MRI without using special sequences or dual bolus injections of contrast media. Statistical analysis between PET and MRI data demonstrated good correlation with a linear trend and error ranges comparable to those previously reported in the literature.
Purpose
Integrated PET-MRI system provides a platform for cross validation of some imaging methods in the same physiology settings and synergistic imaging for comprehensive diagnosis.1 Myocardial blood flow (MBF) is one of important physiology parameters in the heart that can be measured by both PET and MRI through first-pass perfusion approaches, albeit in different approaches. However, one obstacle for accurate quantification of MBF by MRI is the saturation of blood pool signal intensity used for arterial input function (AIF). Although dual bolus is the preferred method for correct estimation of AIF,2 it is impractical to adopt this approach in a clinical setting, particularly during the stress imaging. The objects of this project were to: (1) validate MBF measurements by MRI using a simple new AIF estimation method with simultaneous measurement of MBF by 13N-NH3 PET in a PET-MRI clinical system; (2) determine the difference in MBF between two imaging modalities.Methods
AIF estimation: The saturated portion of the AIF data, assuming a gamma variate curve, was identified according to varying saturation levels and trimmed so it can be interpolated for our boundary conditions: and imposing first and second derivatives of the interpolated curve to be constant. The gamma variate interpolation curve is then solved to minimize a cost function.3-4 This was done for varying saturation levels and also varying arterial delays to generate a number of candidate curves, from which the one that best minimizes the cost function is selected as the true interpolated reconstruction of the AIF.
Imaging methods: Sixteen patients with myocardial ischemia identified by SPECT were recruited for this study after obtaining consents. Rest/stress quantitative PET/MRI cardiac perfusion study were simultaneously performed in the Biograph mMR (Siemens Healthineer, Erlangen, Germany). For PET perfusion imaging, each patient was injected with 10 mCi of 13N-NH3 and a 10 min LIST mode acquisition was initiated upon injection. For MRI perfusion acquisition, each patient was injected 0.075 mmol/kg Multihance (Bracco Diagnostic, Monroe Township, NJ) and a saturation-recovery turboFLASH sequence was used to dynamically acquire 80 images/per slice for 3 slices.5 Stress perfusion was performed 50 minutes after the rest study where cardiac stress was stimulated using (400ug/5mL) Regadenoson injected 30 s prior to PET/MRI scanning. For both rest/stress study, dynamic PET images were created using 3D-OSEM (3 iterations, 21 subsets, 5 mm post-reconstruction Gaussian filter) using the DIXON attenuation correction. A standard AHA 16-segment approach were used for analysis in the same three slices from PET and MRI.6 Absolute MBF of each segment from PET images was derived using QPET software available from Cedars package. MRI images were analyzed using a custom-made software to calculate MBF maps with Fermi convolution.7 The mean MBF value in each segment on these voxel-wise maps were then used as the MRI MBF data.
Results
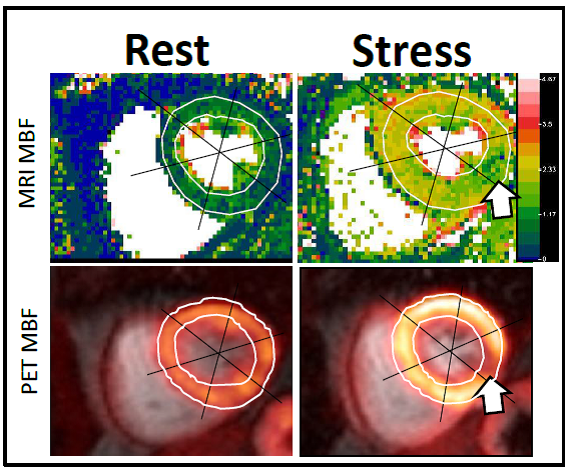
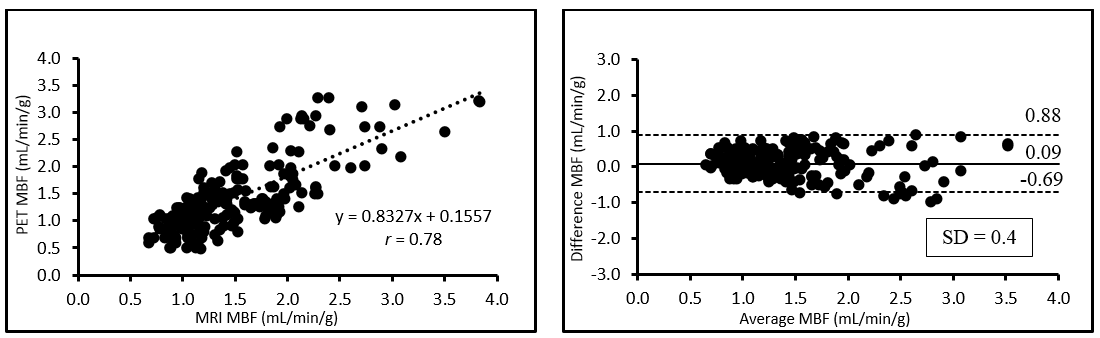
Simultaneous rest and stress PET/MR acquisitions were successfully performed in 16 patients with myocardial ischemia. Mean resting perfusion for PET was 1.05±0.29 ml/min/g and 1.16±0.29 ml/min/g for MRI P = 0.0005, whereas mean stress perfusion for PET was 1.82±0.67 ml/min/g and 1.91±0.59 ml/min/g for MRI (P = 0.095). Figure 1 provides an example of MRI MBF maps versus PET images, showing the same ischemic location in the stress images, but MRI MBF maps clearly delineate ischemic territory with higher spatial resolution. Linear regression analysis between PET and MRI demonstrated good correlation with a linear trend and error ranges comparable to those reported in the previous literature (Figure 2).8-9 MRI appears to overestimate MBF at low resting flow, but comparable with PET during the stress.Discussion
The results demonstrated the feasibility of the new AIF estimation method for the quantification of MBF by MRI without using special sequences or dual bolus injections of contrast media. The MRI MBF correlated reasonably well with PET MBF obtained simultaneously. However, several factors affect the comparability of MBFs measured by PET and MRI, including: different flow models used by PET (tracer extraction) and MRI (indicator dilution), partial volume effect of PET images, biodistribution of MRI contrast media, and linearity of contrast concentrations and signal intensities of MRI images, etc. The difference in two imaging modalities nevertheless may offer comprehensive information to myocardial ischemia.Acknowledgements
No acknowledgement found.References
1. Rischpler C, Nekolla SG, Kunze KP, Schwaiger M. PET/MRI of the heart, Semin Nucl Med. 2015;45:234-247.
2. Christian TF, Rettmann DW, Aletras AH, Liao SL, Taylor JL, Balaban RS, Arai AE. Absolute myocardial perfusion in canines measured by using dual-bolus first-pass MR imaging.
3. Wang H, Cao Y. Correction of Arterial Input Function in Dynamic Contrast-Enhanced MRI of the Liver. Journal of magnetic resonance imaging?: JMRI. 2012; 36(2):411-421. doi:10.1002/jmri.23636.
4. Brunecker P, Villringer A, Jörg Schultze,et al. Correcting saturation effects of the arterial input function in dynamic susceptibility contrast-enhanced MRI — a Monte Carlo simulation, Magnetic Resonance Imaging, Volume 25, Issue 9, November 2007, Pages 1300-1311.
5. Jerosch-Herold M, Wilke N. MR first pass imaging: quantitative assessment of transmural perfusion and collateral flow. Int J Card Imaging. 1997; 13:205-218.
6. Miller CA, Naish JH, Ainslie MP, Tonge C, Tout D, Arumugam P, Banerji A, Egdell RM, Clark D, Weale P, Steadman CD, McCann GP, Ray SG, Parker GJ, Schmitt M. Voxel-wise quantification of myocardial blood flow with cardiovascular magnetic resonance: effect of variations in methodology and validation with positron emission tomography. J Cardiovasc Magn Reson. 2014 Jan 24; 16:11.
7. Jerosch-Herold M, Wilke N, Stillman AE. Magnetic resonance quantification of the myocardial perfusion reserve with a Fermi function model for constrained deconvolution. Med Phys. 1998; 25:73-84.
8. Qayyum AA, Hasbak P, Larsson HB, Christensen TE, Ghotbi AA, Mathiasen AB, Vejlstrup NG, Kjaer A, Kastrup J. Quantification of myocardial perfusion using cardiac magnetic resonance imaging correlates significantly to rubidium-82 positron emission tomography in patients with severe coronary artery disease: a preliminary study. Eur J Radiol. 2014; 83:1120-1128.
9. Yoshinaga K, Manabe O, Tamaki N. Absolute quantification of myocardial blood flow. J Nucl Cardiol. 2016, Jul 21.
Figures