0533
Microvascular tissue characterization with cardiac PET/MRI: Quantitative comparison of myocardial DCE-MRI perfusion flow with 18F-FDG viability PET and coronary angiography1Nuclear Medicine, TU Munich, Munich, Germany, 2Cardiology, TU Munich, Munich, Germany
Synopsis
This cardiac multimodality study combines the use of metabolic 18F-FDG PET imaging with coronary angiography as well as DCE-MR perfusion imaging to investigate the relationship of myocardial metabolism and perfusion in chronic ischemia. A patient group with chronic total occlusion received exams pre- (PET/MRI+Angiography) as well as post- (MRI+Angiography) coronary intervention. Results showed a range of subtle to heavy resting perfusion deficits, with variable intra-patient relationships to metabolic deficits as indicated by 18F-FDG PET. Comparison of coronary angiography results with the corresponding quantitative perfusion analysis pre- and post-intervention suggest that resting perfusion is more sensitive to micro- than macrovascular coronary integrity.
Background
As of today, dynamic contrast-enhanced (DCE) myocardial perfusion MRI under pharmacologic stress is a well understood and clinically established tool to test the significance of coronary artery disease. Regional perfusion differences under resting condition are however not as well understood. Although it is suspected that such defects at rest represent microvascular changes as a consequence of chronic or acute ischemia, it is not clear on what level of the coronary microvasculature these changes occur and what their relationship to actual (metabolically measurable) tissue damage is. Therefore, this study aims to utilize the potential of simultaneous PET/MRI to quantitatively compare MRI-based resting perfusion flow with 18F-FDG viability PET, acting as an established marker for metabolic tissue integrity. The impact of changes in the macrovascular coronary circulation on resting perfusion estimates was tested by performing repeat scans both pre- and post coronary intervention in patients with chronic total occlusion (CTO) in combination with invasive coronary angiography.Methods
All imaging was performed on a 3T PET/MRI scanner (Biograph mMR, Siemens, Erlangen). CTO patients received a pre-intervention PET/MRI exam comprising an insulin-clamped 18F-FDG viability PET, a resting state DCE-MRI perfusion scan as well as T1 and ECV mapping. Four patients returned for a follow-up MRI-only scan six months after recanalization of the respective occluded coronary artery directly followed by invasive coronary angiography. MRI perfusion imaging was performed using a 2D SR-FLASH sequence as described previously1. Quantification of perfusion flow, i.e. plasma flow Fp, was performed based on nonlinearity correction using T1-mapping2 and subsequent deconvolution analysis with singular-value decomposition (SVD). For each patient, perfusion results from six sectors of one left-ventricular short-axis slice were compared between initial and follow up scans, as well as to results of the pre-intervention PET scan. Individual sector values were quantitatively compared as relative differences to the respective slice average, as it is known that absolute resting perfusion values exhibit significant inter-patient differences depending on the general physiological state, and absolute signal values from viability PET depend on the efficacy of the insulin-clamping. Therefore, a maximum relative perfusion difference dFp was defined as:
$$ dF_p =\frac{F_p(slice~average)-F_p(lowest~segment~in~slice)}{F_p(slice~average)} $$
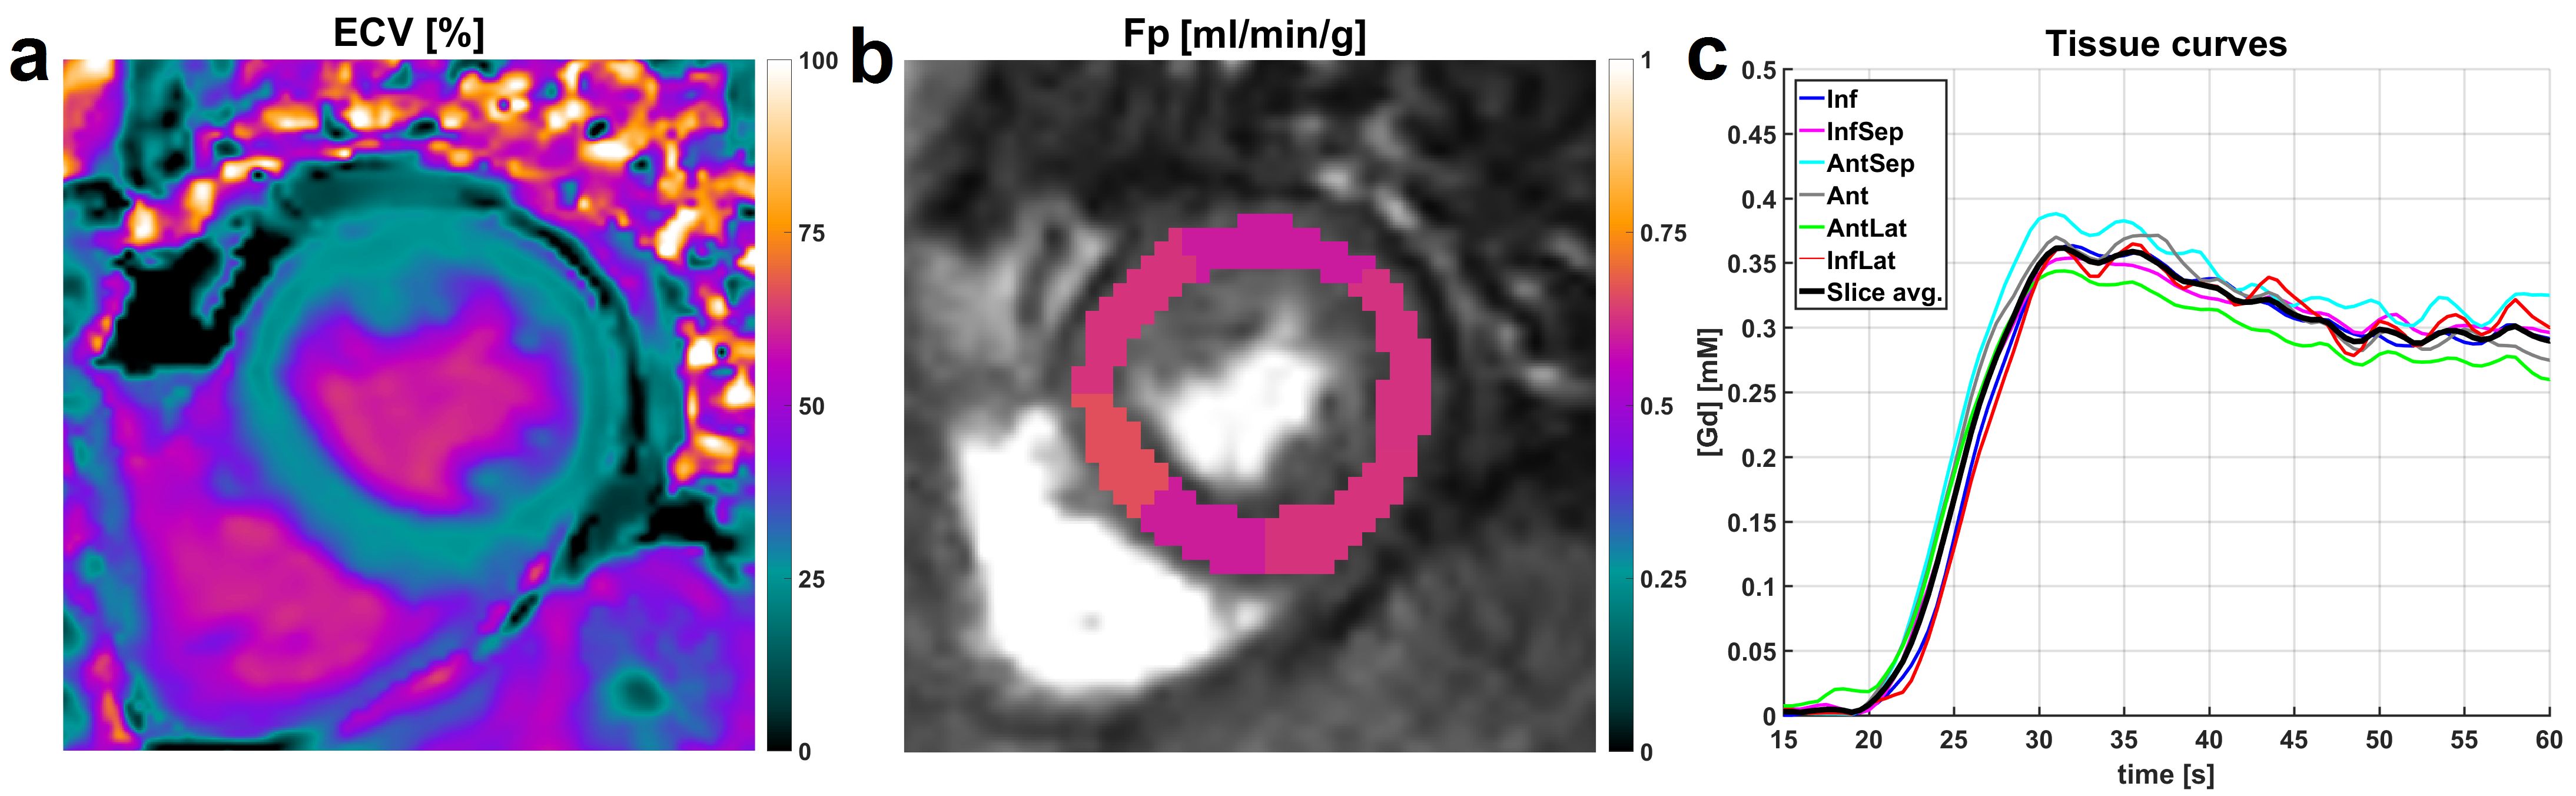
Control MRI data from four subjects without any known cardiac disease were acquired and processed in the same way in order to establish a significance level for small relative flow differences, as e.g. errors in the surface coil intensity correction can induce small systematic differences in Fp estimates across the LV myocardium (Fig. 1).
Results
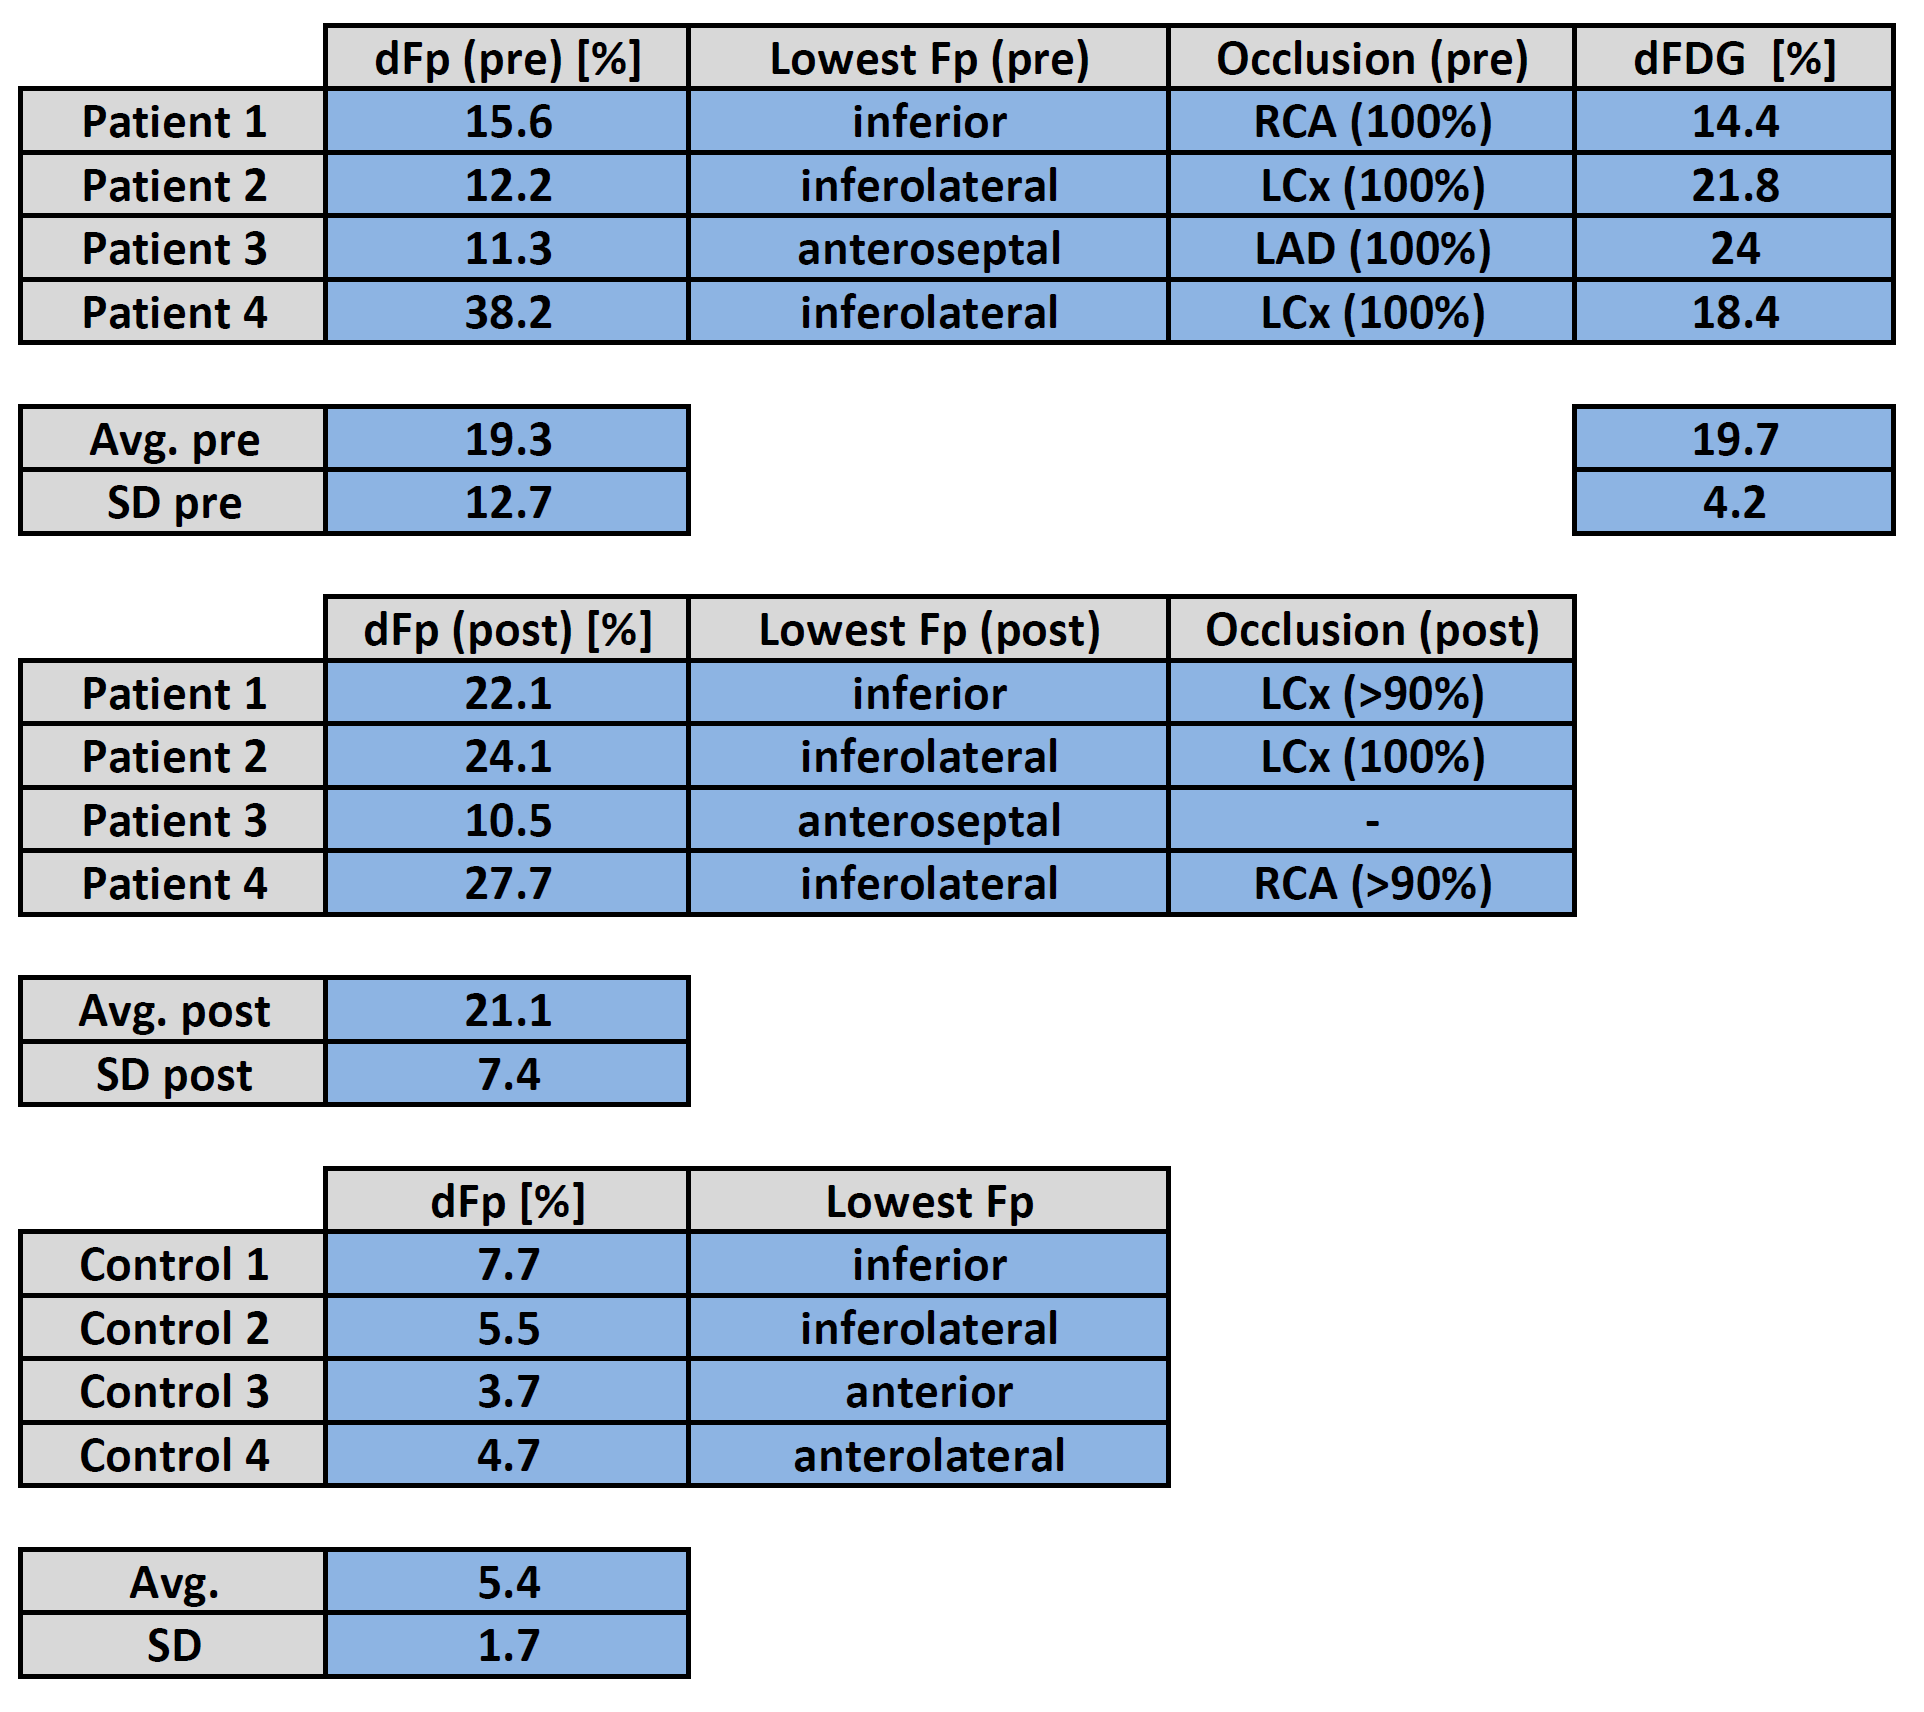
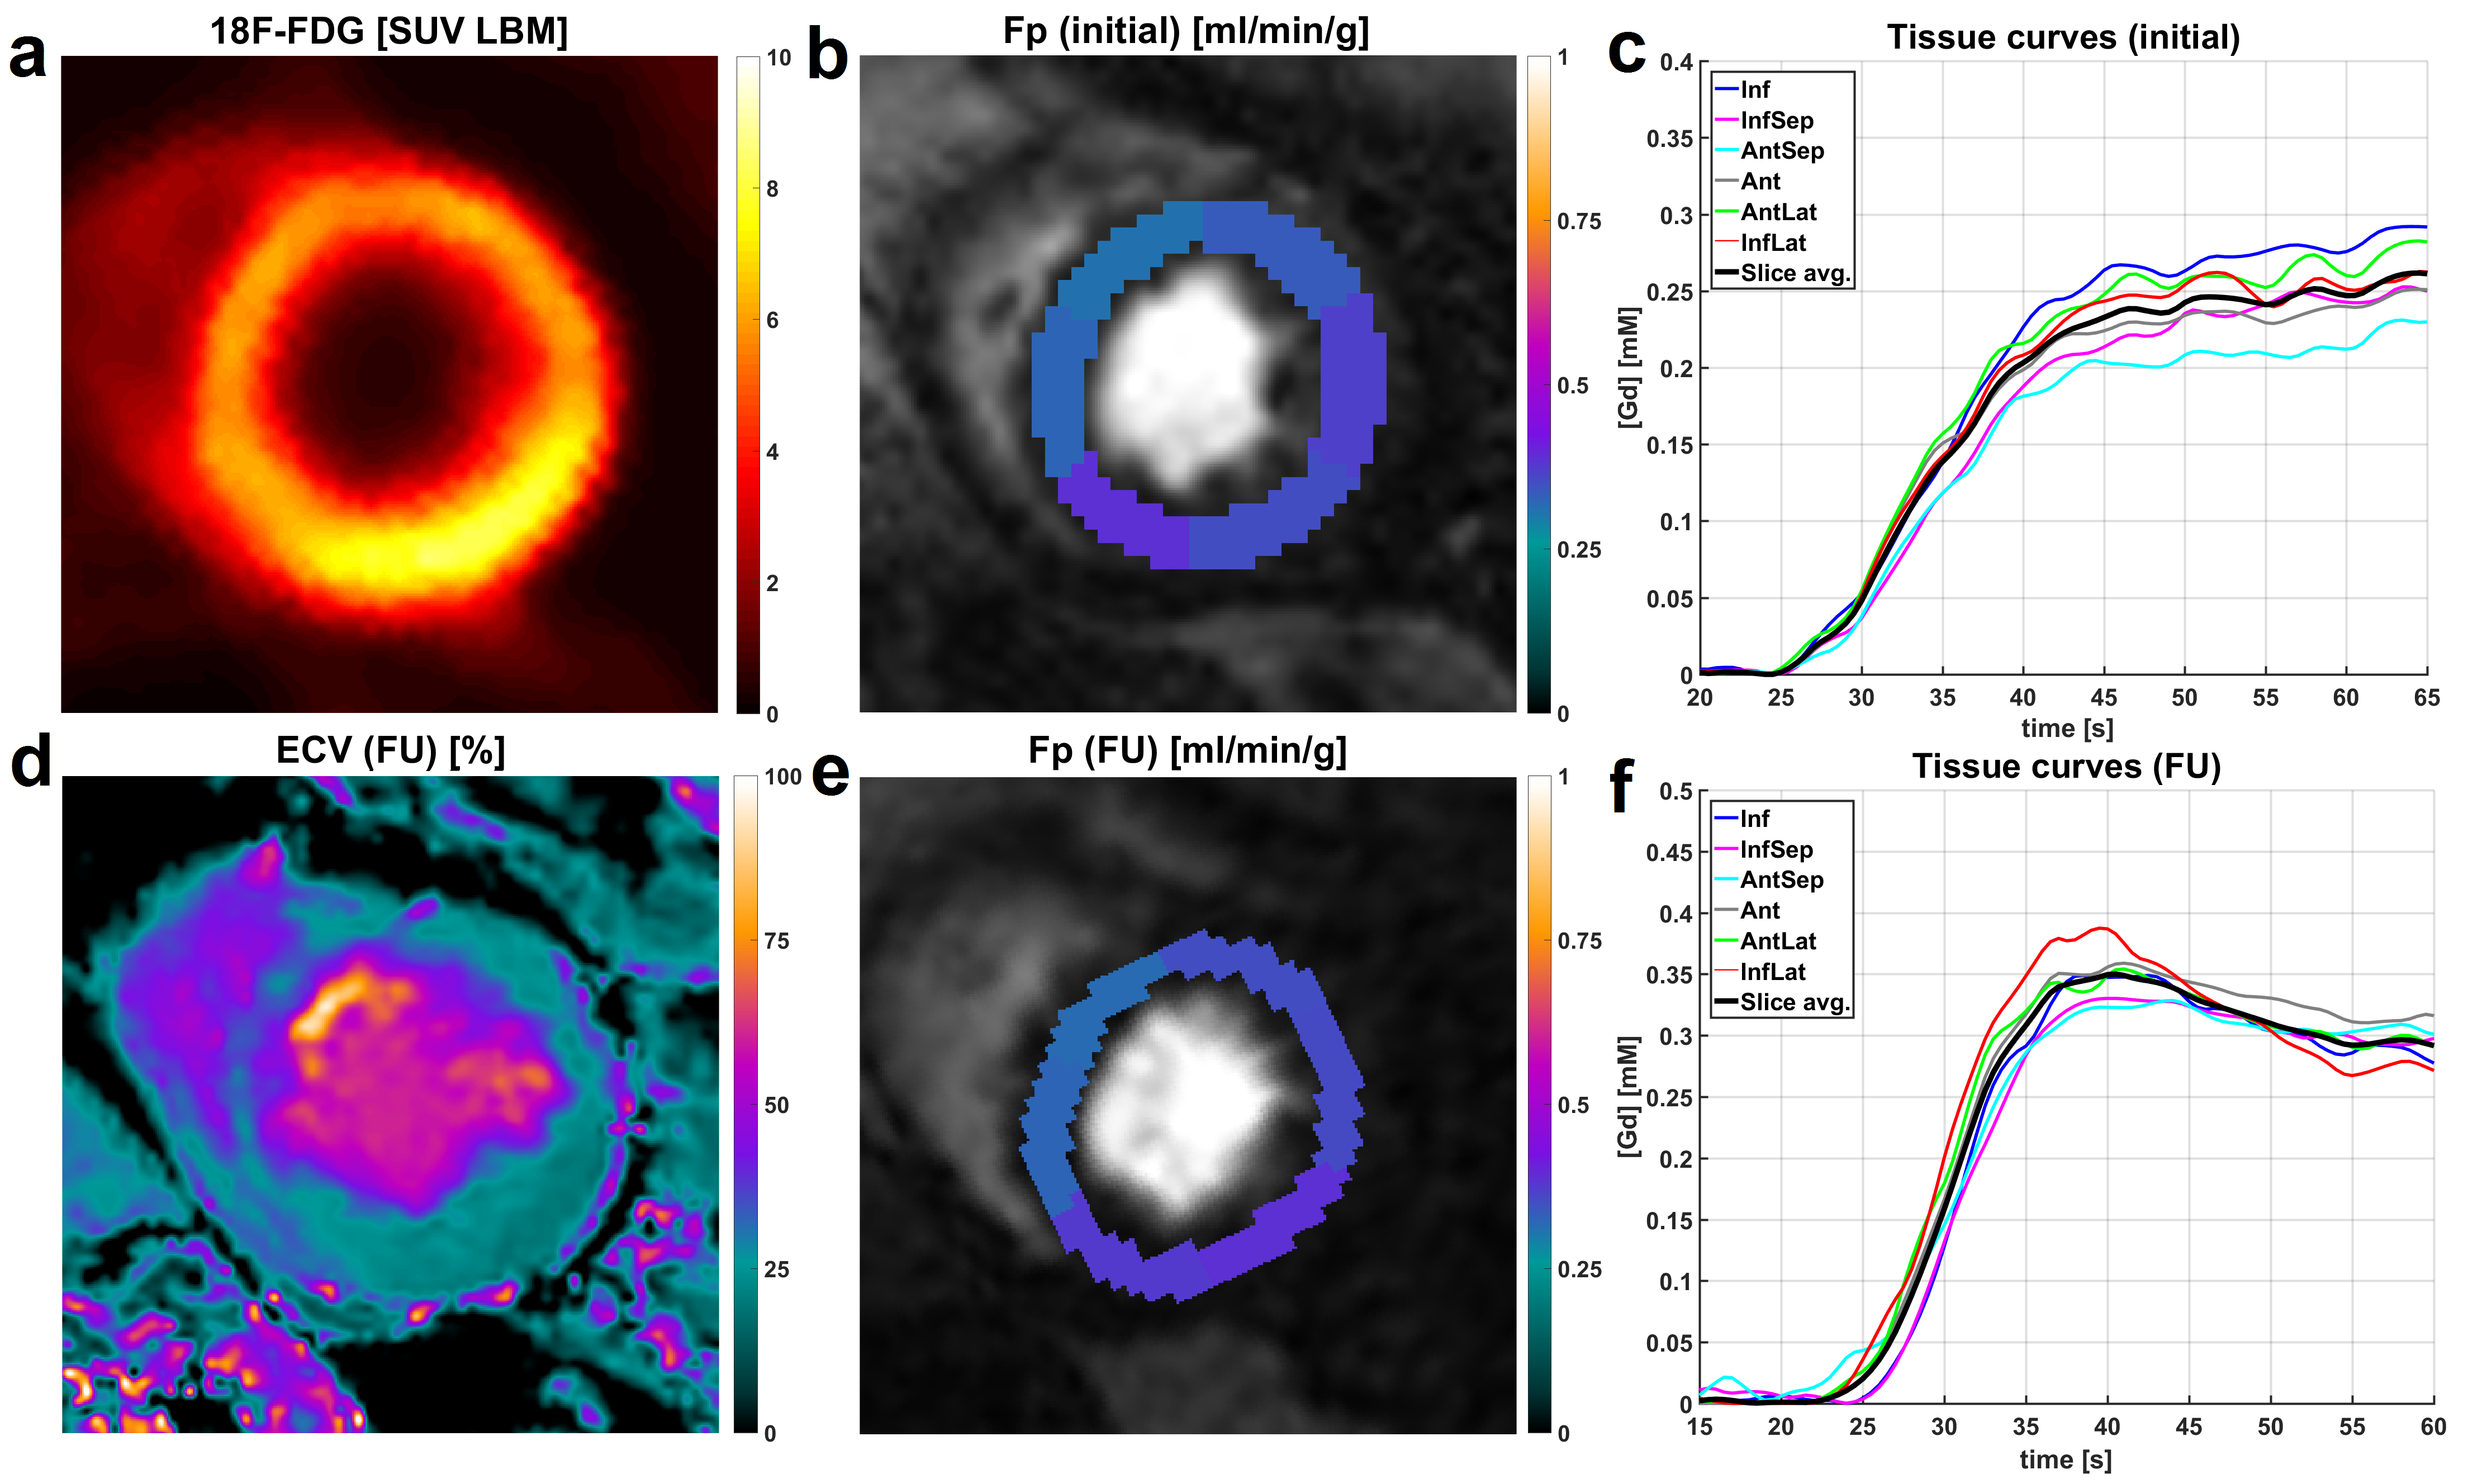
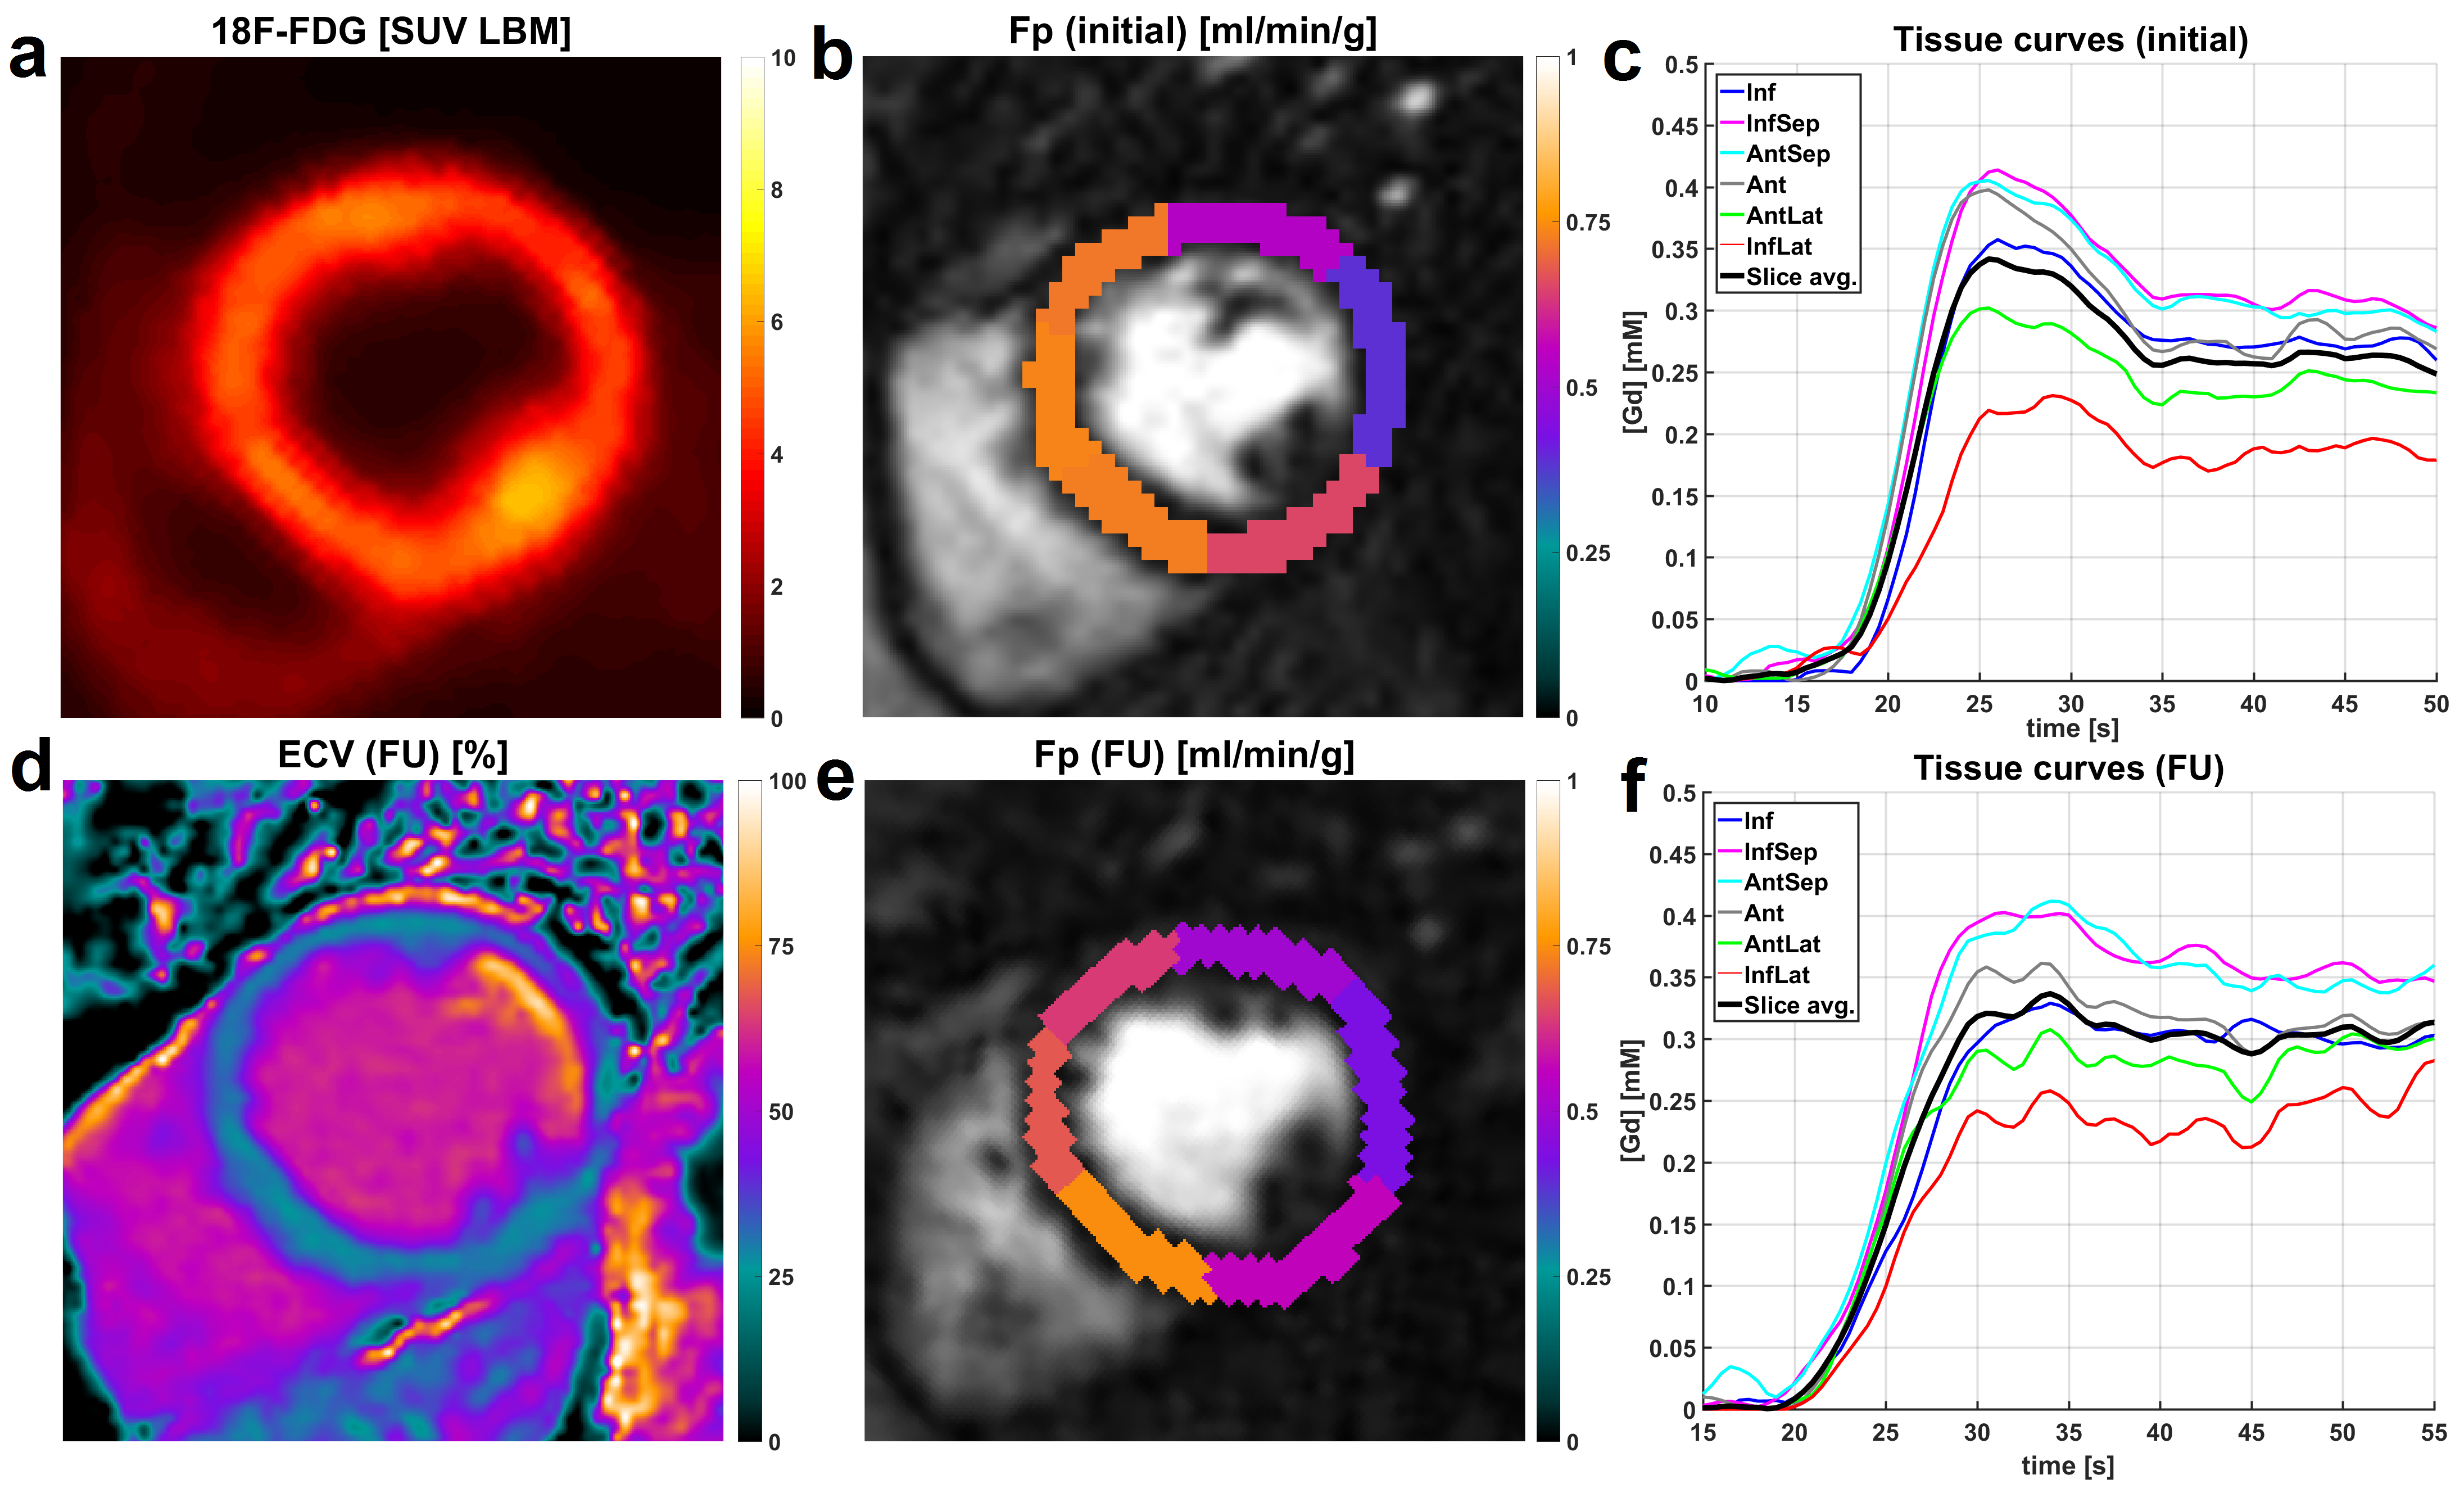
After fusion of 18F-FDG images with the initial perfusion segmentation, relative differences were compared between 18F-FDG PET as well as pre- and post-intervention Fp values. For all patients, the location of the segment exhibiting the smallest Fp estimate was located in the territory of the initially occluded coronary artery and did not change between pre- and post-intervention scans. This was the case despite newly developed high-grade stenosis in vessels different from the initially occluded and reopened one in two of four cases (Patients 1/4 in Fig. 2). For the control group, dFp was on average 5.4% with a standard deviation of 1.7%. Thus, relative flow differences in the CTO patient group were significant, i.e. attributable to physiology, if dFp was larger than 9% (>5.4%+2SD) . For the patient group, average dFp for the occluded territories was virtually the same between initial (19.3%) and follow-up scans (21.1%). The analogous sector-wise FDG analysis yielded an average dFDG of 19.7% with a much smaller inter-patient variability than dFp results. Individual differences between dFp and dFDG however varied across a large range, two examples for this variation are given in Figures 3 and 4. Qualitative analysis of the ECV maps ((d) in Figs. 3 and 4) yielded a greater concordance between ECV and FDG images than between ECV and Fp results (Fig. 3).Conclusion
Combining quantitative pre- and post-intervention DCE-MRI perfusion results with the findings of invasive angiography, data from this study suggest that perfusion deficits at rest represent the state of micro- rather than macrovascular coronary integrity. Large differences were found in the intra-patient relationships between DCE-MRI perfusion results and metabolic integrity as indicated by 18F-FDG PET, suggesting further potential for PET/MRI to quantitatively differentiate patterns of metabolic and functional interactions in cardiac disease.Acknowledgements
This work was funded DFG Grant 8810001759References
1. Kunze KP, Rischpler C, Hayes C, et al. Measurement of extracellular volume and transit time heterogeneity using contrast-enhanced myocardial perfusion MRI in patients after acute myocardial infarction. Magn Reson Med. in press DOI:10.1002/mrm.26320.
2. Broadbent DA, Biglands JD, Ripley DP, et al. Sensitivity of quantitative myocardial contrast-enhanced MRI to saturation pulse efficiency, noise and T1 measurement error: Comparison of nonlinearity correction methods. Magn Reson Med. 2016;75:1290-1300.
Figures