0530
Quantification of Perfusion in Hypertrophic Cardiomyopathy using 3D Contrast Agent Flow Simulation1Berlin Ultrahigh Field Facility (B.U.F.F.), Max-Delbrueck Center for Molecular Medicine, Berlin, Germany, 2Technical University Berlin, Berlin, Germany, 3Medical Physics and Metrological Information Technology, Physikalisch-Technische Bundesanstalt, Berlin, Germany, 4Working Group on Cardiovascular Magnetic Resonance, Experimental and Clinical Research Center (ECRC), Berlin, Germany, 5Department of Cardiology and Nephrology, HELIOS Klinikum Berlin Buch, Berlin, Germany
Synopsis
Hypertrophic Cardiomyopathy (HCM) is a common cause of sudden heart death in young adults. MRI is a powerful tool for the diagnosis and surveillance of this myocardial morphology as well as tissue injury. In clinical routine the assessment is mainly based on visual assessment or semi-quantification is increasingly used. Quantification of perfusion defect should be nowadays assessed with computational tools. We aim at quantifying differences in perfusion with a computational flow model that incorporates the vascular, as well as extracellular compartment, using the Damköhler Number $$$Da$$$. Areas of different perfusion in N=5 patients with HCM were fitted in $$$Da$$$ with model-derived curves with an overall error of 10.48%.
Purpose
Hypertrophic Cardiomyopathy (HCM) is a common cause of sudden heart death in young adults[1]. MRI is a powerful tool for the diagnosis and surveillance of this myocardial morphology as well as tissue injury. In clinical routine the assessment is mainly based on visual assessment or semi-quantification is increasingly used such as signal intensity upslope, area-under-curve or time-to-max approaches. However, these approaches lack of inter-patient comparability. Recently, quantitative analysis methods of first-pass perfusion have been proposed, such as uptake/Patlak-plot[4] one-compartment models [3] or (Fermi-)deconvolution[2]. However, most of the models address only the first pass and assume no exchange of contrast agent between vascular and extracellular space. We aim at quantifying differences in perfusion with a computational flow model that incorporates both compartments.Methods
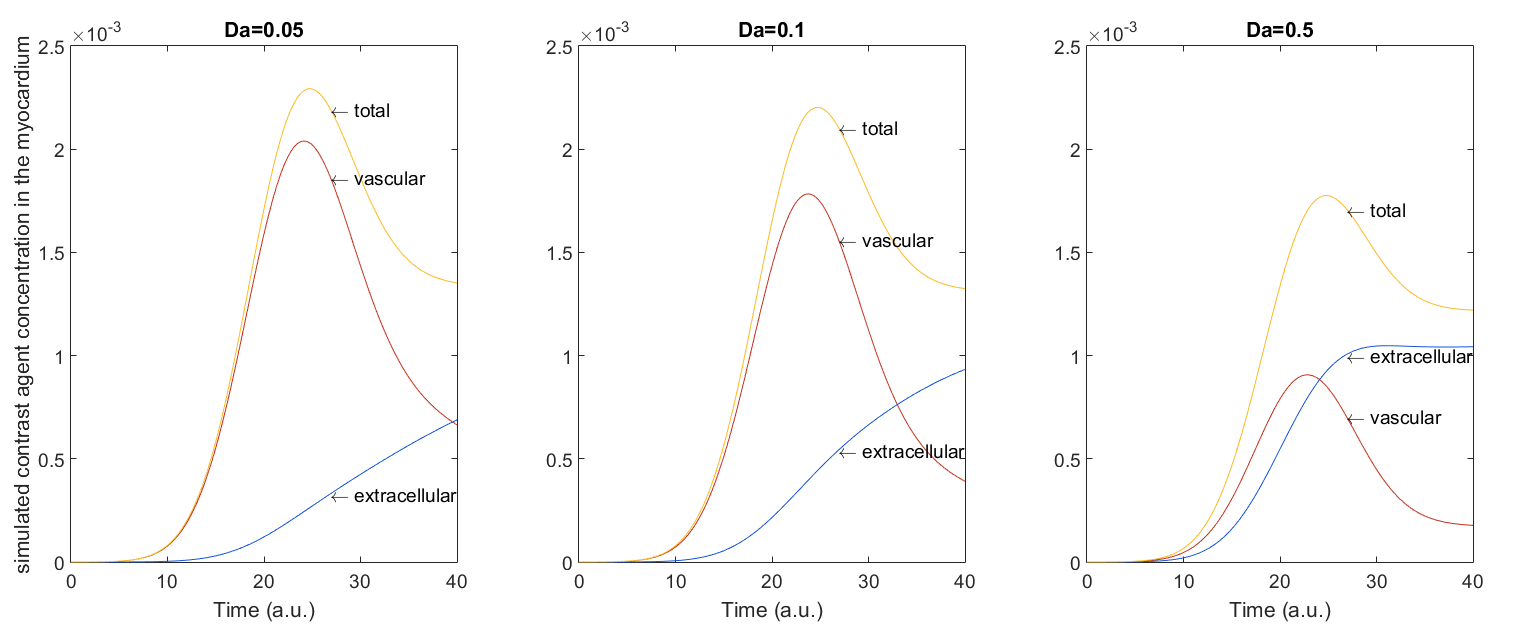
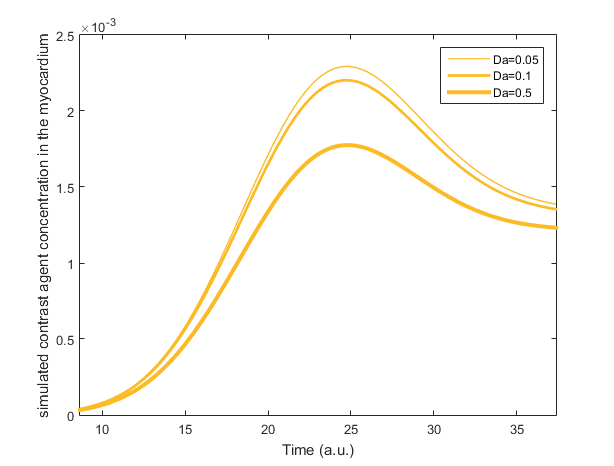
A 3D virtual phantom was implemented in MATLAB (The Mathworks, Natick, USA) using the “threed” toolbox for the finite element method provided by [5]. For the computational modeling of contrast agent flow, a 3D convection-diffusion partial differential equation was used[6]. It determines the amount of contrast agent $$$c$$$ in the vascular space $$$c^v$$$ and the extracellular space $$$c^e$$$ by $$ \frac{\partial c^v}{\partial t} + u^v \cdot \nabla c^v - \alpha\nabla^2 c^v + Da(1-\phi)(c^v-c^e)=\frac{AIF}{\phi} $$ $$ \frac{\partial c^e}{\partial t} - \beta\nabla^2 c^e - Da\phi(c^v-c^e)=0 $$ where $$$\alpha, \beta \in \mathbb{R}$$$ are diffusion weights, $$$Da \in \mathbb{R}$$$ is the Damköhler Number and together with $$$ \phi \in \mathbb{R}$$$ describe the exchange between vascular and extracellular space, $$$u^v:\mathbb{R}^3\rightarrow \mathbb{R}$$$ is the blood flow velocity and $$$AIF:\mathbb{R}^3\times\mathbb{R}\rightarrow \mathbb{R}$$$ is the arterial input function, which is assumed to be given by the Gaussian $$ \frac{1}{\sigma \sqrt{2 \pi}} e^{-\frac{1}{2}\left(\frac{t-T_{peak}}{\sigma}\right)^2} ,\, \sigma \in \mathbb{R}_{+}, T_{peak}\in\mathbb{R}\,.$$ All parameters and functions are extensively discussed in [6]. The solution $$$c=(c^v,c^e)$$$ was numerically estimated for different Damköhler Numbers $$$Da \in \mathbb{R}$$$ using the finite element method on 3D tetrahedrons with a Hat-Function basis. A cube $$$[0, 10]^3$$$ was discretized $$$11 \times 11 \times 11$$$ with inflow node at $$$(2, 5, 5)$$$ and sampling point $$$(5, 5, 5)$$$.
N=5 patients
with HCM were scanned at 3.0T (MAGNETOM Verio, Siemens Healthcare, Erlangen,
Germany) using stress perfusion imaging (Saturation Recovery Sequence, Gradient Echo, TR=2.05 ms, TE=0.98 ms, FA=17°, FOV= (272×340)
mm2, matrix=160×128, slice thickness=6mm) with contrast-agent
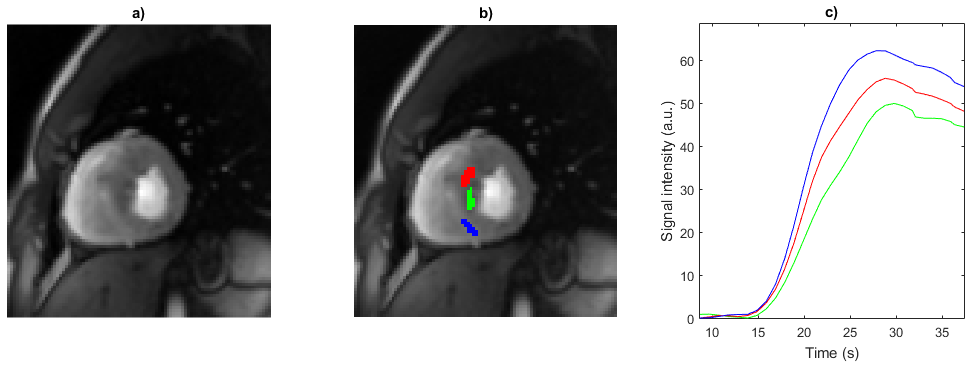
application (0.2 mmol/kg body weight, Gadobutrolum). Three areas (as shown in figure
1)) with differences in perfusion were selected by an MR-experienced
cardiologist and their signal intensity-time curves were analyzed. The measured
perfusion curves are fitted with the numerically simulated ones using a
least-squares approach to determine the Damköhler
Numbers as a quantitative measure for
the exchange between the two compartments. Parameters ($$$ \alpha=1, \beta=2,
\sigma=5, \phi=0.14$$$) were assumed, as well as a unit blood flow velocity in
x-direction. Contrast agent concentrations for $$$Da \in [0.01, 1.5]$$$ were
calculated into a large database and used for fitting to the curves shown in
figure 1. The simulation data is given in arbitrary units and is therefore
uniformly scaled and shifted at the signal intensity peak to fit the measured
data. The central curves, i.e. the simulation for $$$Da=0.5$$$ and the red
measurement curve were used for this alignment.
Results
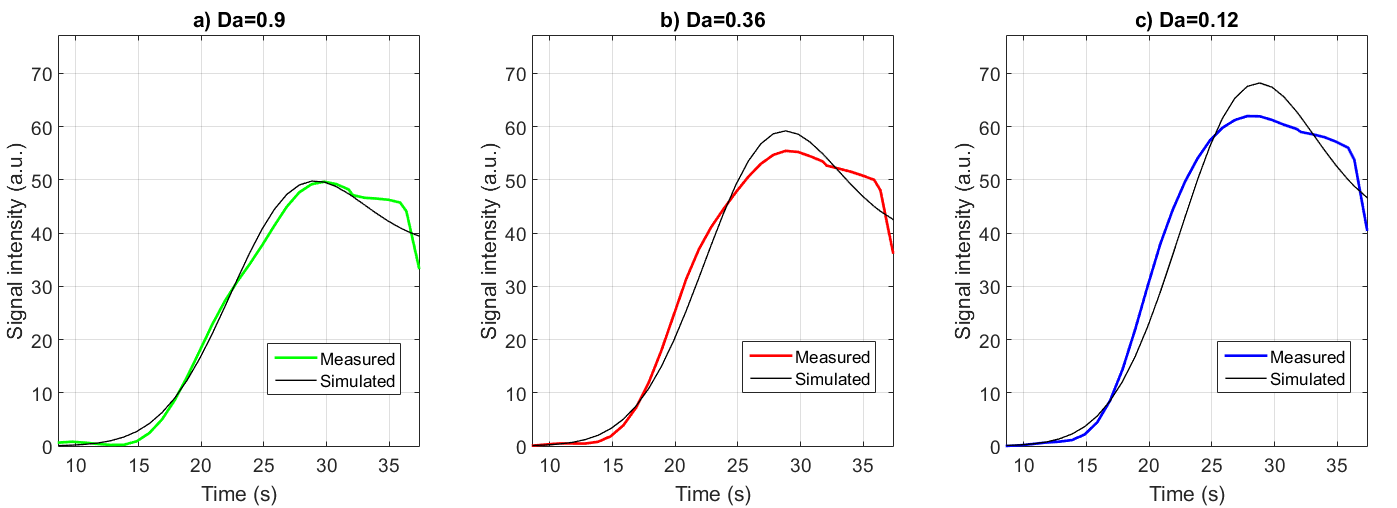
Fitting of measured signal intensity against the simulation was possible in all patients with a mean error of all curves of 10.48%. The results of specific patient are shown in figure 3, with a root mean as 2.2, 3.1 and 4.5. In comparison to the maximum of the corresponding measured signal intensity, these errors are 3.9%, 5.6% and 8.2% respectively. In our sample of 5 HCM patients we have observed a mean value of $$$Da=1.33\pm 0.33$$$ for low, $$$Da=0.35\pm 0.1$$$ for medium and $$$Da=0.09 \pm 0.08 $$$ for high signal intensity ROIs.Thus, the Damköhler Numbers show different values for the different ROI indicating a good measure for pathology.Discussion
In the future, patient-specific arterial input functions may improve the quality of the fitting to our simulations, as well as a more sophisticated fitting algorithm, allowing for a wider range of $$$Da$$$. Additionally, the simulated curves appear to be steeper than measured ones. A possible reason for this is saturation effects, which take place at high concentration of contrast agent [7].Conclusion
Our preliminary results suggest the feasibility of perfusion quantification in HCM, using convection-diffusion flow modeling. In particular, the Damköhler Number $$$Da$$$, which controls the flow to and from the extracellular space, could be used as a fitting parameter for signal intensity curves of different perfusion ROIs. Thus, the fitting parameter $$$Da$$$ can be considered as a potential measure for pathology in perfusion imaging.Acknowledgements
Supported by the DZHK (German Centre for Cardiovascular Research) and by the BMBF (German Ministry of Education and Research).References
[1] Maron et al., Cardiology patient pages. Hypertrophic cardiomyopathy. (2002) Circulation
[2] Jerosch-Herold et al., Magnetic resonance quantification of the myocardial perfusion reserve with a Fermi function model for constrained deconvolution. (1998) Med. Phys.
[3] Vallée et al., Quantification of myocardial perfusion by MRI after coronary occlusion. (1998) MRM
[4] Ishida et al., Quantification of myocardial blood flow using model based analysis of first-pass perfusion MRI: extraction fraction of Gd-DTPA varies with myocardial blood flow in human myocardium. (2011) MRM
[5] Jeff Borggaard, https://people.sc.fsu.edu/~jburkardt/m_src/threed/threed.html
[6] Cookson et al., A spatially-distributed computational model to quantify behaviour of contrast agents in MR perfusion imaging. (2014) Medical Image Analysis
[7] Utz et al., Contrast-dose relation in first-pass myocardial MR perfusion imaging. (2007) JMRI
Figures