0529
Coronary Relaxation Mapping for Multi-fold Amplification in Myocardial BOLD Sensitivity1Cedars Sinai Medical Center, Los Angeles, CA, United States, 2Lawson Health Research Institute, 3IMT School for Advanced Studies Lucca
Synopsis
Over the past two decades cardiac BOLD MRI has seen major technical advances. However, its reliability for detecting ischemic heart disease remains poor. We hypothesized that the reliability of cardiac BOLD MRI can be improved by repeatedly acquiring BOLD images following regadenoson injection. We found that repeatedly acquired myocardial BOLD imaging following regadenoson administration can be used to significantly amplify the BOLD sensitivity and improve the reliability of myocardial BOLD MRI in health and disease.
Introduction
Over the past two decades cardiac BOLD MRI has seen major technical advances. However, its reliability for detecting ischemic heart disease remains poor, which has limited its widespread clinical adoption. A key unresolved obstacle with cardiac BOLD MRI is the artifactual signal changes that are typically observed during vasodilator stress, which originate from unstable cardiac activity in conjunction with narrow acquisition windows. Recently, ‘regadenoson’, a new coronary vasodilator has become the market leader in the US due to many of its clinical attributes. One of the interesting features of regadenoson is its prolonged duration of vasodilatory action on the coronary arteries. We hypothesized that the reliability of cardiac BOLD MRI can be improved by repeatedly acquiring BOLD images following regadenoson injection. We tested our hypothesis by (i) acquiring multiple BOLD images following regadenoson injection; (ii) registering them across acquisitions; (iii) deriving coronary relaxation estimates using an exponential model representative of the pharmacokinetics of regadenoson; and (iv) validating our findings with simultaneously acquired ammonia PET perfusion images.Methods
Image Acquisition:
Intact (n=7) and infarcted (n=2) dogs were studied in a clinical hybrid PET/MR system (Siemens, Germany). 2D BOLD (T2 maps), LGE and 13N-NH3 PET images were acquired pre- and post-regadenoson administration (p.r.a). Free-breathing T2 maps p.r.a were repeatedly acquired over 30 mins to sample the temporal dynamic of BOLD response after regadenoson injection. Motion-Corrected Image Registration: The series of BOLD images acquired post regadenoson administration were registered using the advanced normalization tools (ANTS) software. Rest images were used as the reference for registration.
Image Analysis:
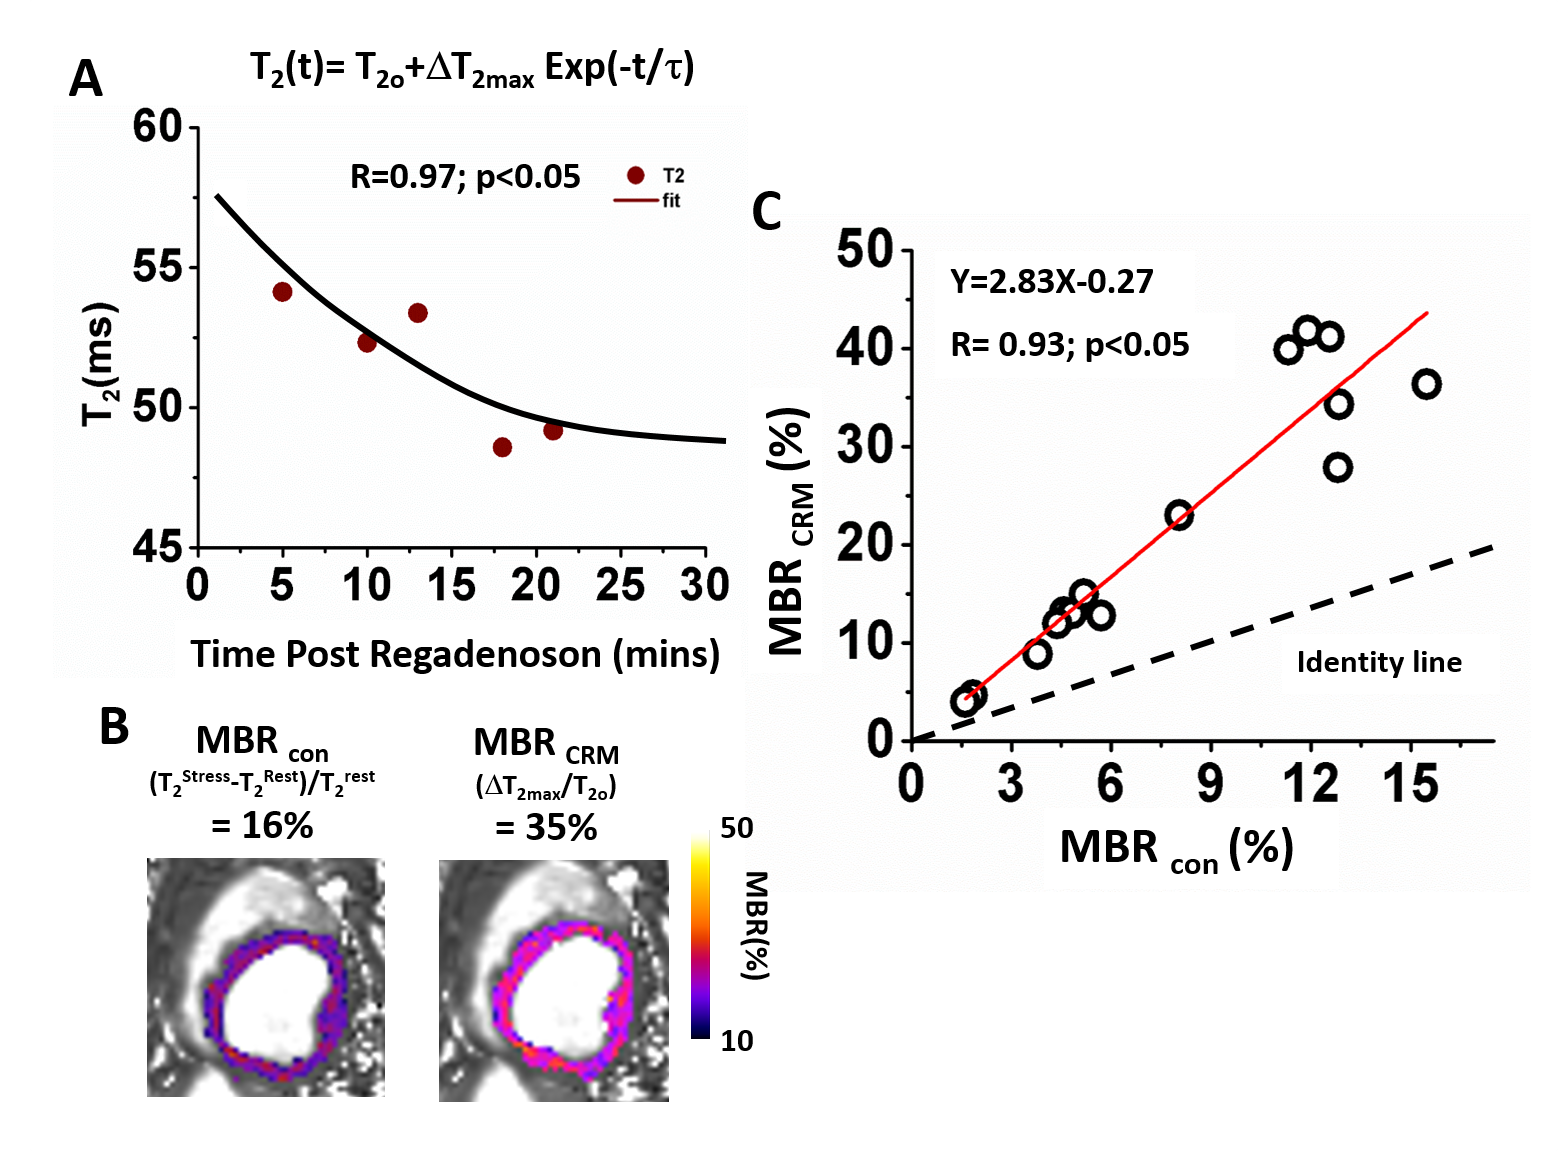
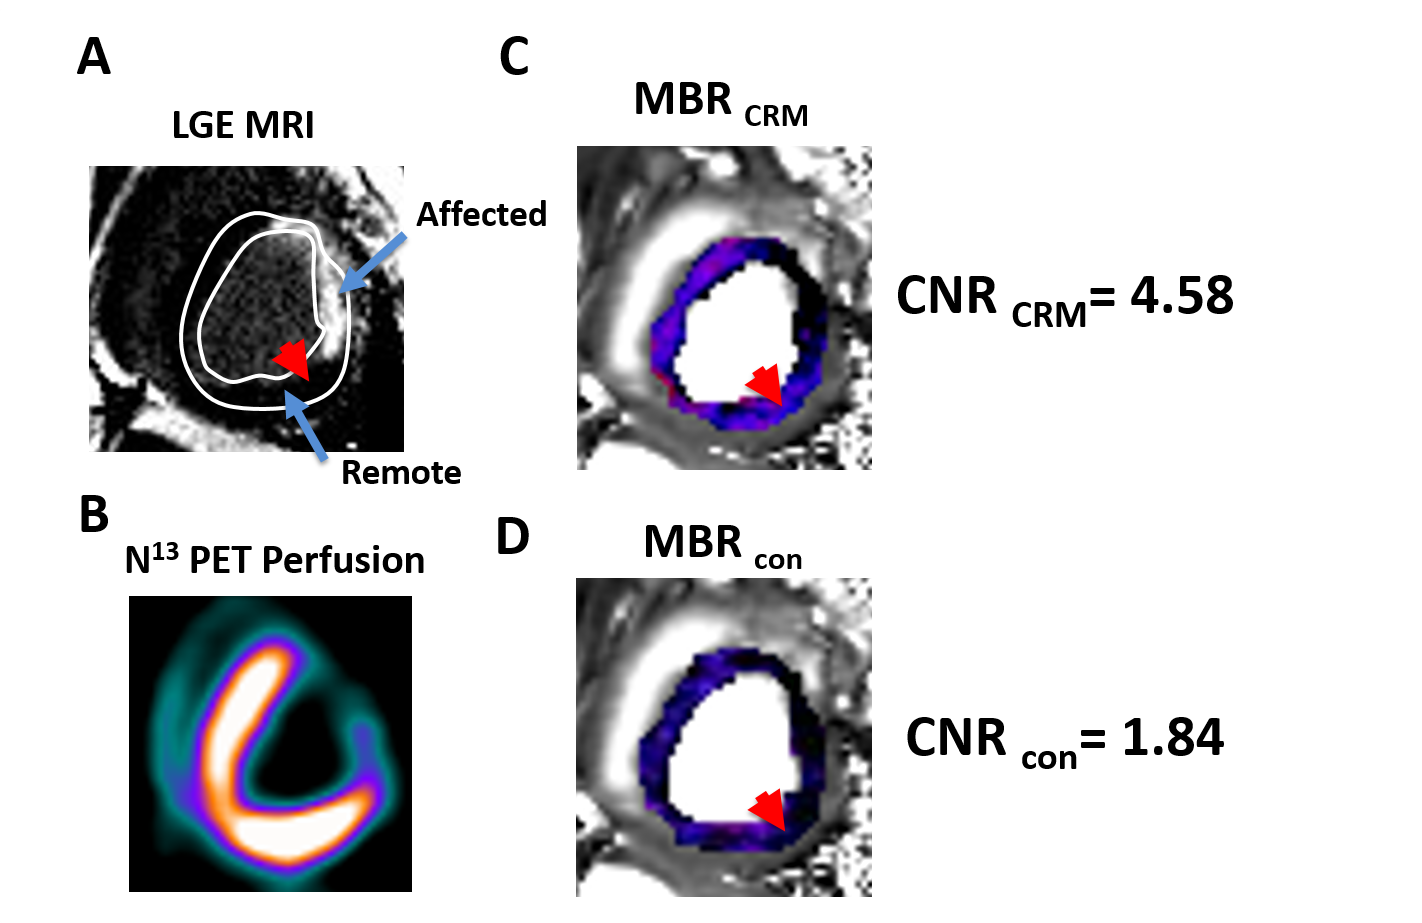
The time-dependent T2 maps were used to model the coronary relaxation as T2(t)=T2o+ΔT2max exp(-t/τ), where T2o=T2 at rest; ΔT2max=maximal T2 change from rest; and τ = time constant of coronary relaxation. Maximum BOLD response from coronary relaxation model (CRM) was estimated as MBRCRM=ΔT2max/T2o x 100% and compared to conventional myocardial BOLD response defined as MBRcon= (T22min - T2Rest)/ T2Rest x 100%, where T22min = myocardial T2 at 2 min p.r.a and T2Rest=T2 prior to regadenoson injection, using a regression model. In infarcted animals, affected zones were identified using LGE. BOLD contrast-to-noise ratio between remote and affected zones was defined as CNR= (mean(MBRRemote) - mean(MBRAffected))/(standard deviation of MBRRemote). This was determined for the proposed (CNRCRM) and conventional (CNRcon) methods and compared. MBRs were validated with perfusion reserve (MPR) from PET.
Results
In intact dogs, myocardial T2 dynamics tightly fitted the coronary relaxation model (R=0.92 ±0.06). Parameters estimated from CRM (T2o:44.2±6.7ms; ΔT2max:14.7±5.8ms; τ:35.5±26.8min) were in agreement with previous reports. Both MBRs (MBRCRM=27±16% and MBRcon=12±6%) were consistent with p.r.a PET (MPR=3.0±0.6). MBRCRM and MBRcon were highly correlated (R=0.93; p<0.05) with MBRCRM=2.83 MBRcon – 0.27, indicating that MBRCRM was approximately 2.8-fold greater than the MBRcon. In infarcted dogs, significantly higher MBRs in the remote and lower MBRs in the affected regions were observed with both methods (Remote: MBRCRM=27±6%, MBRcon=15±5%; Affected: MBRCRM=1±10%, MBRcon=5±7%; both p<0.05), and were in agreement with PET (MPRremote=3.7±0.6; MPRaffected=1.9±0.7;). Mean CNR based on CRM were nearly 2-fold larger than the conventional approach (CNRCRM=3.7±0.6; CNRcon=1.9±0.7).
Conclusion
This study showed that repeatedly acquired myocardial BOLD MRI following regadenoson administration can be used to significantly amplify the BOLD sensitivity and improve the reliability of current myocardial BOLD MRI. Further studies are required to determine the capability of the proposed approach for identifying territories of the myocardium subtended by non-flow limiting but clinically significant coronary artery stenosis.Acknowledgements
No acknowledgement found.References
No reference found.Figures