0528
Clinical Evaluation of Whole-Heart Quantitative Adenosine Stress CMR with Motion-compensated L1-SPIRIT1Department of Medicine, University of Virginia, Charlottesville, VA, United States, 2Department of Biomedical Engineering, University of Virginia, Charlottesville, VA, United States, 3Department of Radiology and Medical Imaging, University of Virginia, Charlottesville, VA, United States
Synopsis
Adenosine stress CMR has potential advantages over competing modalities for diagnosing coronary artery disease (CAD) including the ability to quantify myocardial perfusion, however current CMR techniques have limited spatial coverage. We perform a clinical assessment of the diagnostic performance of whole-heart spiral perfusion imaging using motion compensated compressed sensing for detection of CAD and demonstrate good image quality, minimal motion artifacts, and high diagnostic accuracy for both visual and quantitative evaluation.
Introduction
Adenosine stress CMR has potential advantages over competing modalities for diagnosing coronary artery disease (CAD) including the ability to quantify myocardial perfusion. Absolute quantification of myocardial perfusion detects a greater burden of ischemia in multi-vessel CAD1, which is important for determining the need for revascularization. Positron emission tomography (PET) can provide whole-heart quantitative assessment of perfusion with high diagnostic accuracy but requires a cyclotron and ionizing radiation exposure. Clinically available CMR perfusion techniques are limited by dark-rim artifact, have limited spatiotemporal resolution, and incomplete ventricular coverage. We have recently demonstrated a variable density (VD) spiral pulse sequence with an integrated arterial input function (AIF) which can acquire 8 short-axis slices with 2mm in-plane resolution at heart rates up to 125 bpm providing whole-heart quantitative assessment of perfusion.2,3 The purpose of this study was to assess the clinical performance of this new technique to detect obstructive CAD using both quantitative and visual analysis.Methods
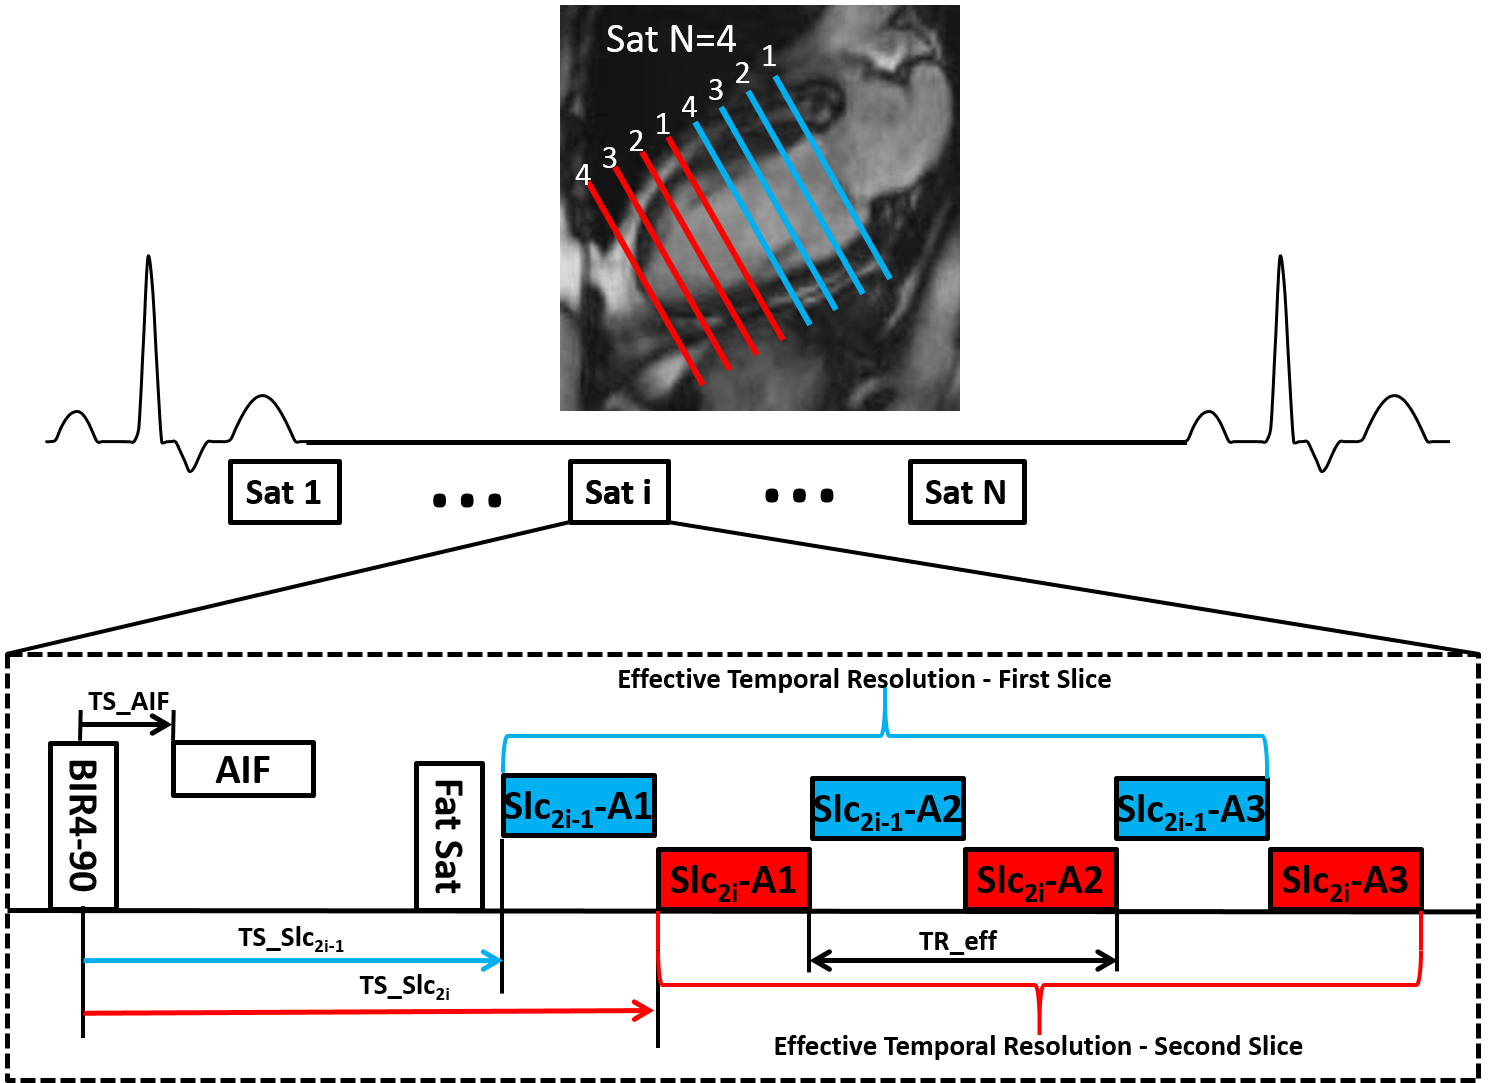
CMR perfusion imaging was performed during adenosine stress (140µg/kg-min) and at rest on a Siemens 1.5T Avanto scanner in 20 patients with chest pain scheduled for coronary angiography (CA) and 8 normal subjects. Images were acquired during injection of 0.075 mmol/kg Gd-DTPA at 8 short-axis locations using a 2D saturation recovery (SR) accelerated VD spiral pulse sequence. Sequence parameters included: 3 interleaves/slice, 5.12ms readout per interleaf, TE 1 ms, effective TR 14ms, FA 300, saturation time (SRT) 80ms, FOV 340mm2, in-plane resolution 2 mm2, 2 interleaved slices per saturation.(Fig 1) AIF images were acquired during the SRT of the first perfusion image with a 2x accelerated single-shot spiral acquisition using a 900 FA, in-plane resolution 6.95mm2, SRT 10ms. Proton-density (PD) weighted images were acquired during the first 4 heart beats. Images were reconstructed using rigid-motion compensated L1-SPIRIT.4,5 Prior to pixel-wise quantification of perfusion, images were aligned using non-rigid registration. Signal intensity was converted to [Gd] using Bloch simulation, and quantification was performed using Fermi-function deconvolution. A significant stenosis was defined as >50% by quantitative CA (QCA). Two blinded reviewers evaluated the spiral perfusion images for the presence of adenosine-induced perfusion abnormalities and assessed image quality using a 5 point scale (1-poor to 5-excellent).Results
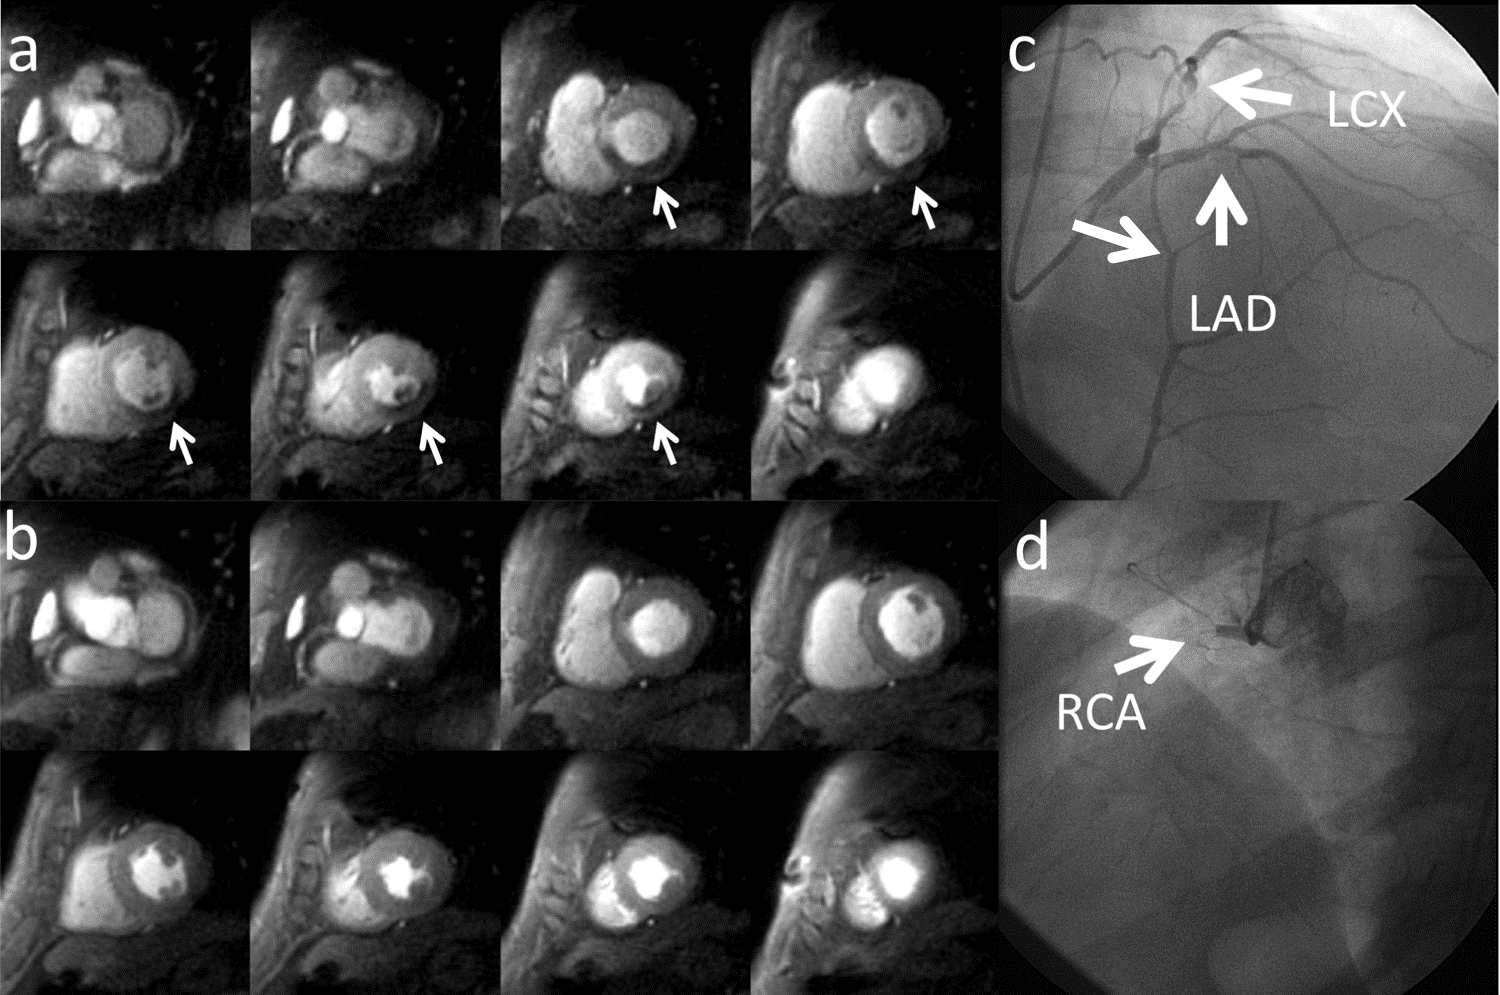
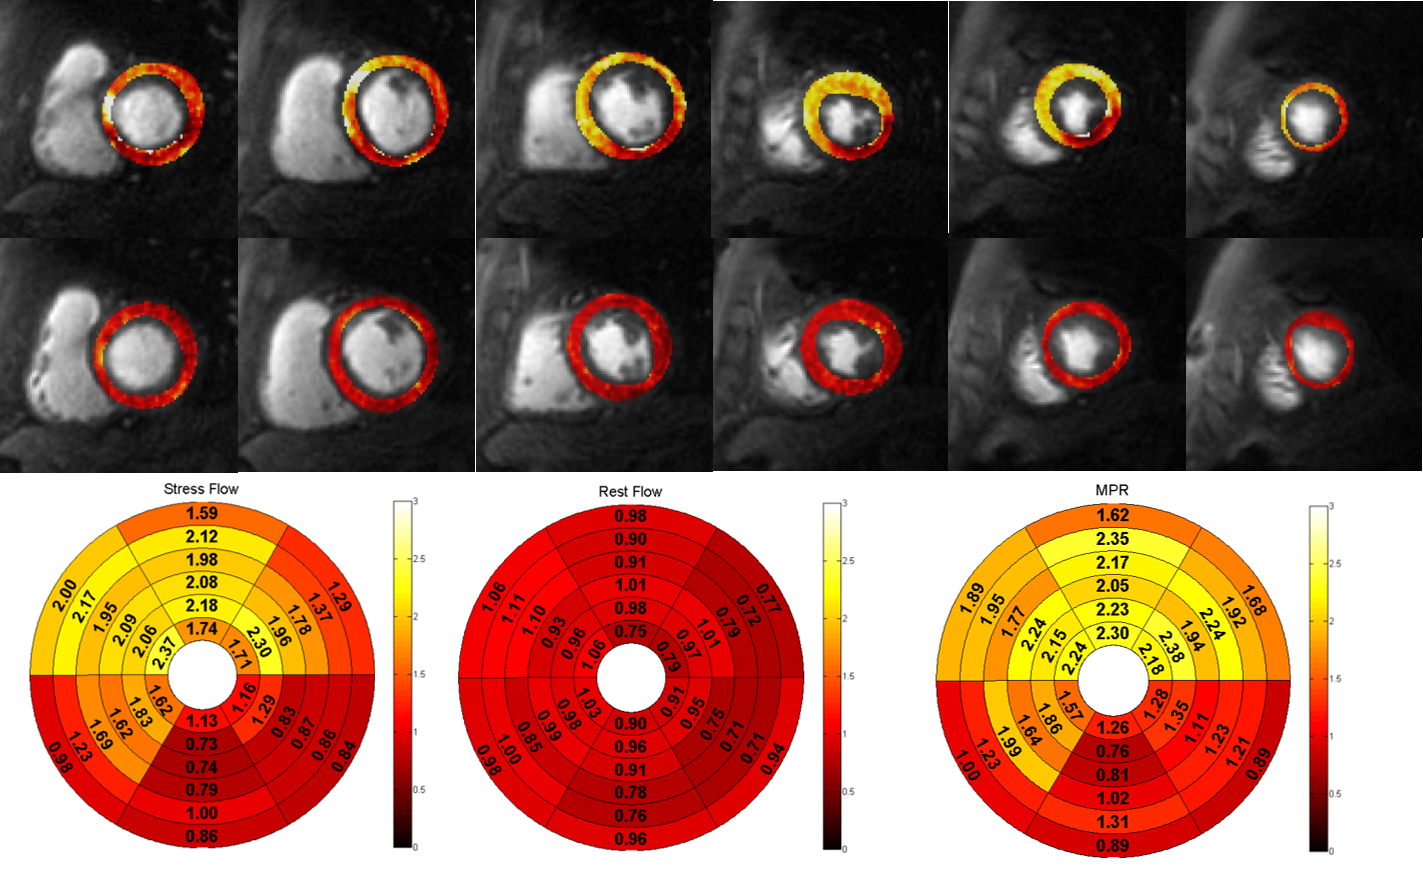
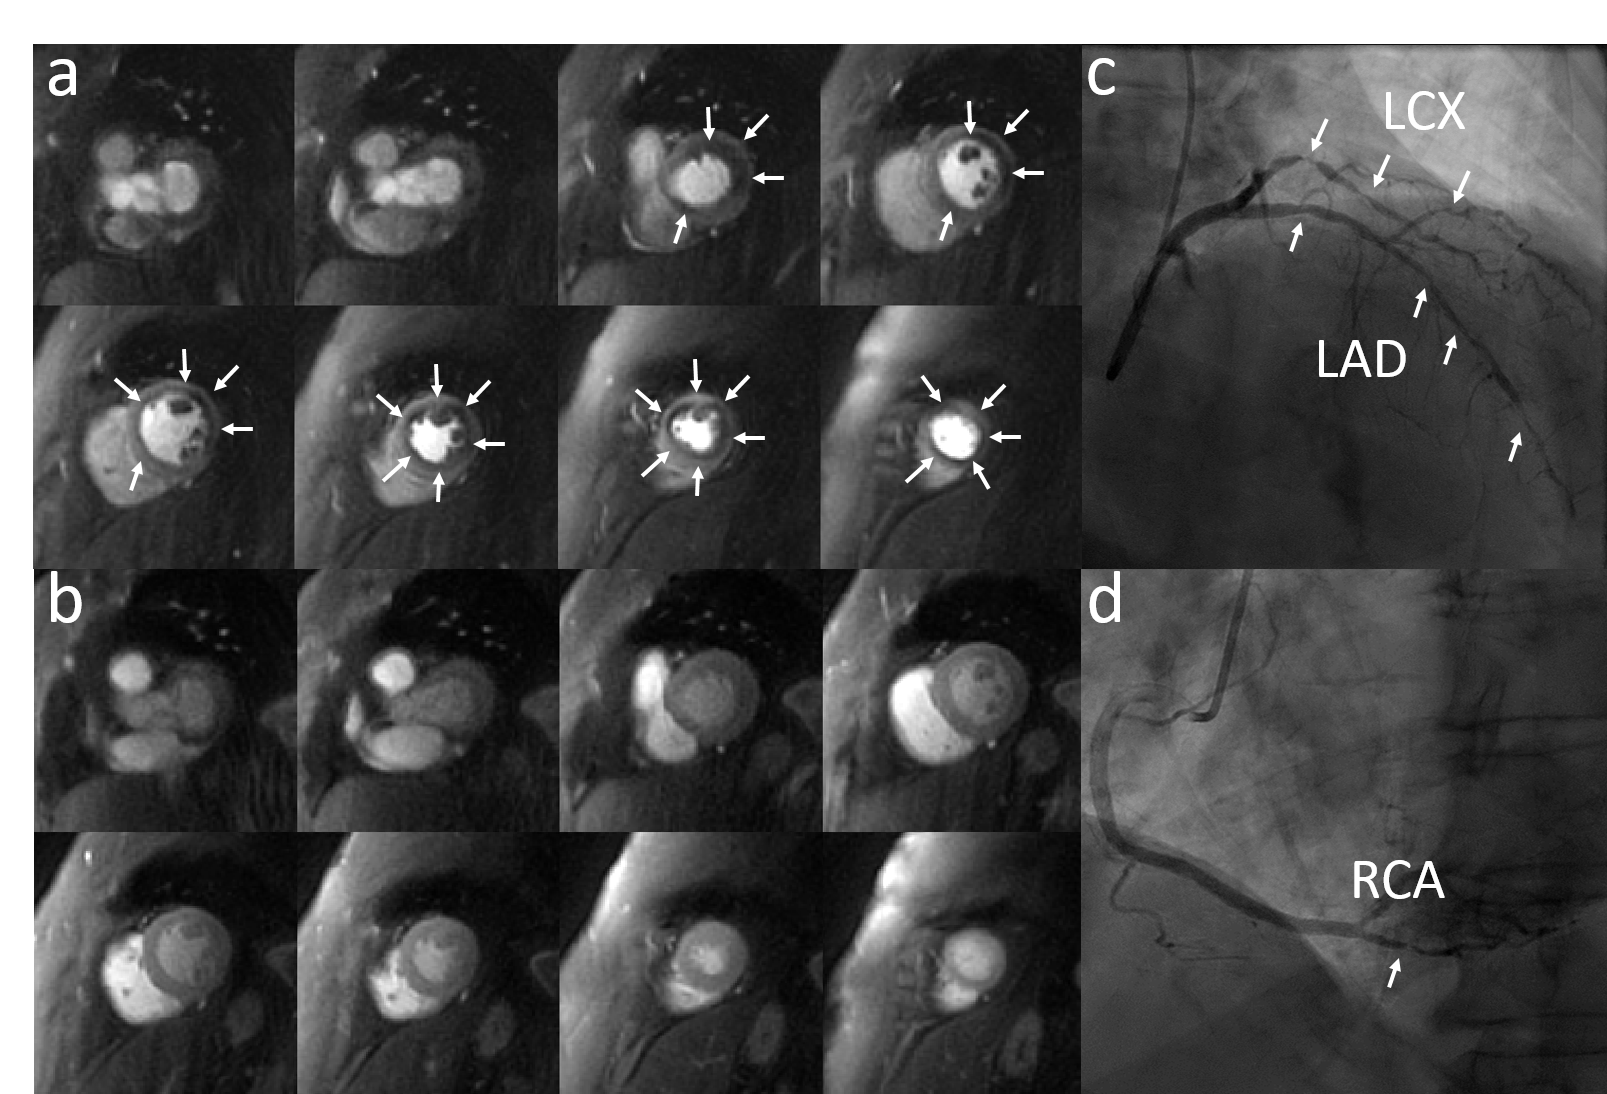
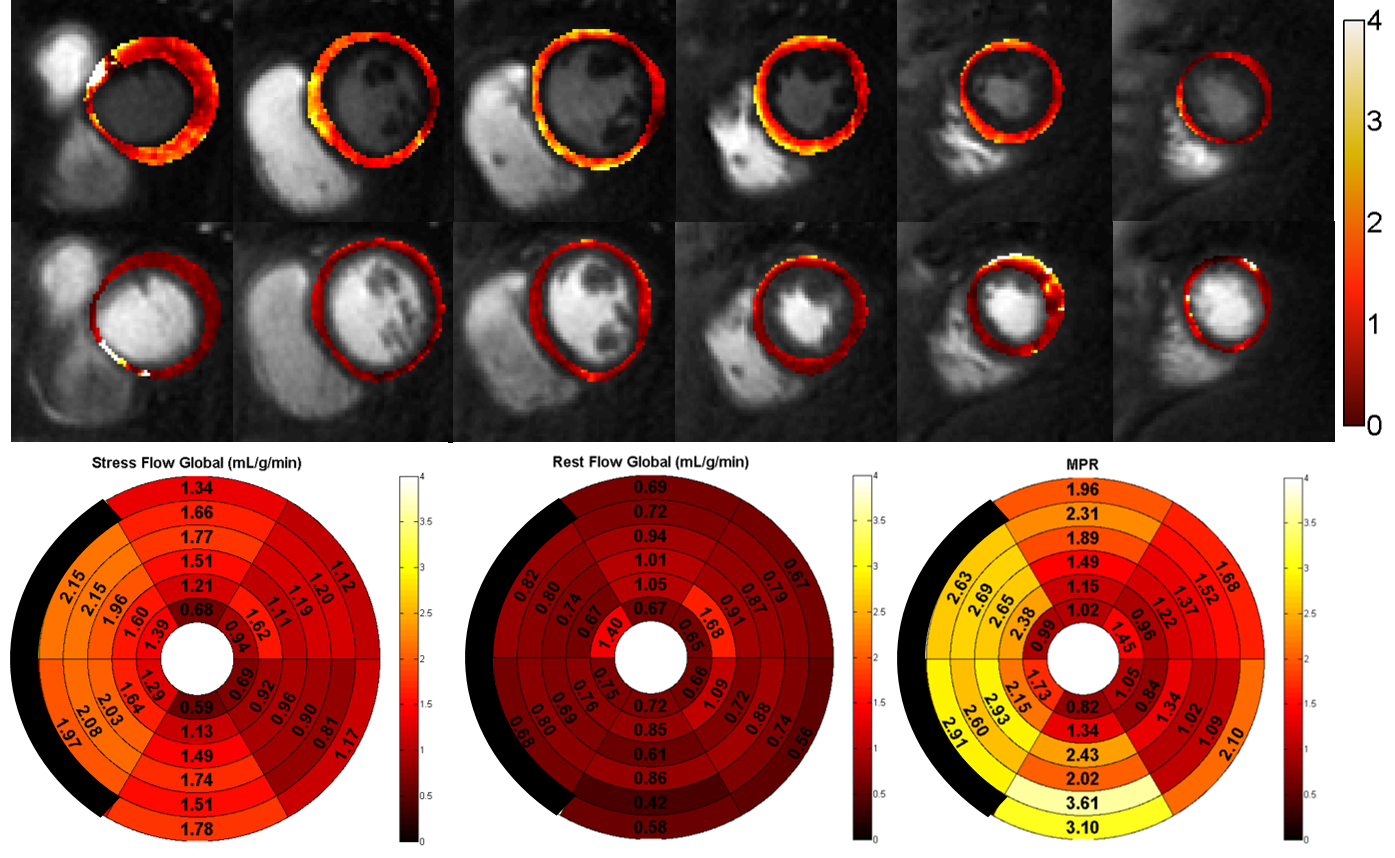
Patients had a mean age of 62±11, 80% were male, 45% had a smoking history, 30% had diabetes, 60% had hypertension, and 85% had hyperlipidemia. 30% of the patients had known CAD. QCA demonstrated obstructive CAD in 12 patients (60%). Figure 2 shows (a) stress and (b) rest spiral perfusion images from a subject who had normal cardiac function and no LGE. A visual perfusion defect is seen in the inferior wall, corresponding to the occlusion of the RCA on CA (Fig 2d). Notably, pixel-wise quantification of perfusion (Fig 3) demonstrated reduced stress flow in all territories in this subject consistent with 3 vessel disease, as seen in Fig 2c. Figure 4 shows (a) stress and (b) rest spiral perfusion images from another subject who had normal cardiac function and no LGE. Perfusion defects are seen in all territories consistent with 3 vessel disease at CA (Fig 4 c-d). Pixel-wise quantification of perfusion (Fig 5) demonstrated reduced stress flow in all territories in this subject. Mean stress perfusion was higher in the normal subjects as compared to the patients without CAD (3.10±0.57 mL/g/min vs 2.51±0.41 mL/g/min p<0.05) suggesting the possibility of microvascular disease in these patients.6 Among the patients there was a step-wise decrease in mean stress perfusion with severity of CAD (no-obstruction, 1 vessel, 2 vessel, 3 vessel disease, 2.51±0.41, 1.89±0.48 mL/g/min,1.80±0.52 mL/g/min, and 1.49±0.29 mL/g/min, respectively p<0.01). For the detection of a 50% stenosis by QCA the average sensitivity, specificity, and accuracy of the two readers were 88%, 86%, and 87% respectively, with a positive predictive value (PPV) and negative predictive value (NPV) of 91% and 80% respectively. The overall image quality score was 4.5±0.8. Global quantitative stress perfusion performed similarly to visual analysis on a per-patient basis with a sensitivity, specificity, and accuracy of 83%, 86%, and 81%. PPV and NPV were 91% and 75% respectively.Conclusions
Clinical assessment of the diagnostic performance of whole-heart spiral perfusion imaging using motion compensated compressed sensing for detection of CAD demonstrated good image quality, minimal motion artifacts, and high diagnostic accuracy for both visual and quantitative evaluation.Acknowledgements
The authors would like to acknowledge Jayne Missel, RN for her excellent work as our study coordinator and procedure nurse.References
1. Patel AR, Antkowiak PF, Nandalur KR, West AM, Salerno M, Arora V, Christopher J, Epstein FH, Kramer CM. Assessment of Advanced Coronary Artery Disease: Advantages of Quantitative Cardiac Magnetic Resonance Perfusion Analysis. J Am Coll Cardiol. 2010 Aug 10;56(7):561-9.
2. Yang Y, Kuruvilla S, Kramer C, Meyer C, Salerno M. “Whole-Heart Quantification of Myocardial Perfusion with Spiral Pulse Sequences” Proc. Intl. Soc. Mag. Reson. Med. 21. 2013. (94)
3. Yang Y, Kramer CM, Shaw P, Meyer CH, Salerno M. First-pass myocardial perfusion imaging with whole-heart coverage using L1-SPIRiT accelerated variable density spiral trajectories. Magn Reson Med. 2015 Nov 5.
4. Huang W, Yang Y, Chen X, Salerno M. “Simple motion correction strategy reduces respiratory-induced motion artifacts for k-t-accelerated cmr perfusion imaging.” Proceedings of the 23rd ISMRM. 2015:5943.
5. Lustig M, Alley M, Vasanawala S, Donoho D, Pauly J. l1-SPIRiT: Autocalibrating parallel imaging compressed sensing. Proceedings of the 17th Annual Meeting of ISMRM; Honolulu, Hawaii. 2009. p. 379.
6. Shaw PW, Yang Y, Chow K, Gonzalez JA, Balfour P, Meyer CM, Epstein FH, Bourque J, Salerno M, Kramer CM. Quantitative CMR perfusion imaging identifies reduced flow reserve in microvascular coronary artery disease.” Journal of Cardiovascular Magnetic Resonance 18 (S1), 1-2.2016
Figures