0526
Magnetization Transfer-weighted Cardiac MRI in End Stage Renal Disease Quantifies Fibrosis and Identifies Biochemical Markers of Fibrosis without Gadolinium1Physiology, University of Kentucky, Lexington, KY, United States, 2Cardiovascular Research Center, University of Kentucky, Lexington, KY, United States, 3College of Medicine, University of Kentucky, KY, United States, 4Gill Heart Institute, University of Kentucky, KY, United States, 5Biomedical Engineering, University of Kentucky, KY, United States, 6Bioengineering, University of California Berkeley, Berkeley, CA
Synopsis
Cardiac fibrosis is prevalent in end stage renal disease (ESRD). Contraindication to late gadolinium enhancement (LGE) cardiac MRI (CMR) obstructs diagnosis, treatment selection, and potential therapeutic target identification. Currently, ventricular hypertrophy and function are used as surrogate measures of fibrosis and correlates of biomarkers. We used magnetization transfer (MT) weighted CMR to quantify fibrosis, comparing to structure, function, and blood biomarkers. We recapitulated prevalent fibrosis found previously by LGE. Results suggest hypertrophy or strains may be inappropriate fibrosis measures in ESRD. Extracellular matrix turnover markers, e.g. TIMPs, may represent more specific biomarkers of fibrosis and molecular targets for therapeutics development.
Purpose
Cardiac fibrosis is a substrate for fatal arrhythmias and is highly prevalent in patients with end stage renal disease (ESRD). However, contraindication to late gadolinium enhancement (LGE) cardiac MRI (CMR) presents a barrier to diagnosis, treatment selection, and identification of potential therapeutic targets for fibrosis attenuation. Currently, ventricular hypertrophy and reduced contractile function are used as surrogate, quantitative measures of fibrosis and correlates of blood based biomarkers, however these are not specific to fibrosis. The reduction in magnetization transfer (MT) due to expansion of extracellular volume that occurs concurrently with fibrosis development allows for tissue characterization by non-contrast, MT-weighted CMR. We previously developed an MT-weighted CMR technique (2-point bSSFP) and demonstrated that the normalized signal difference between high and low MT-weighted images yields heightened values in strong agreement with LGE-CMR measurement of fibrosis and edema.1 Here we present visualization and quantification of ventricular fibrosis in patients with ESRD using MT-weighted CMR, and compare fibrotic burden to alterations in structure, function, and biochemical blood biomarker correlates.Methods
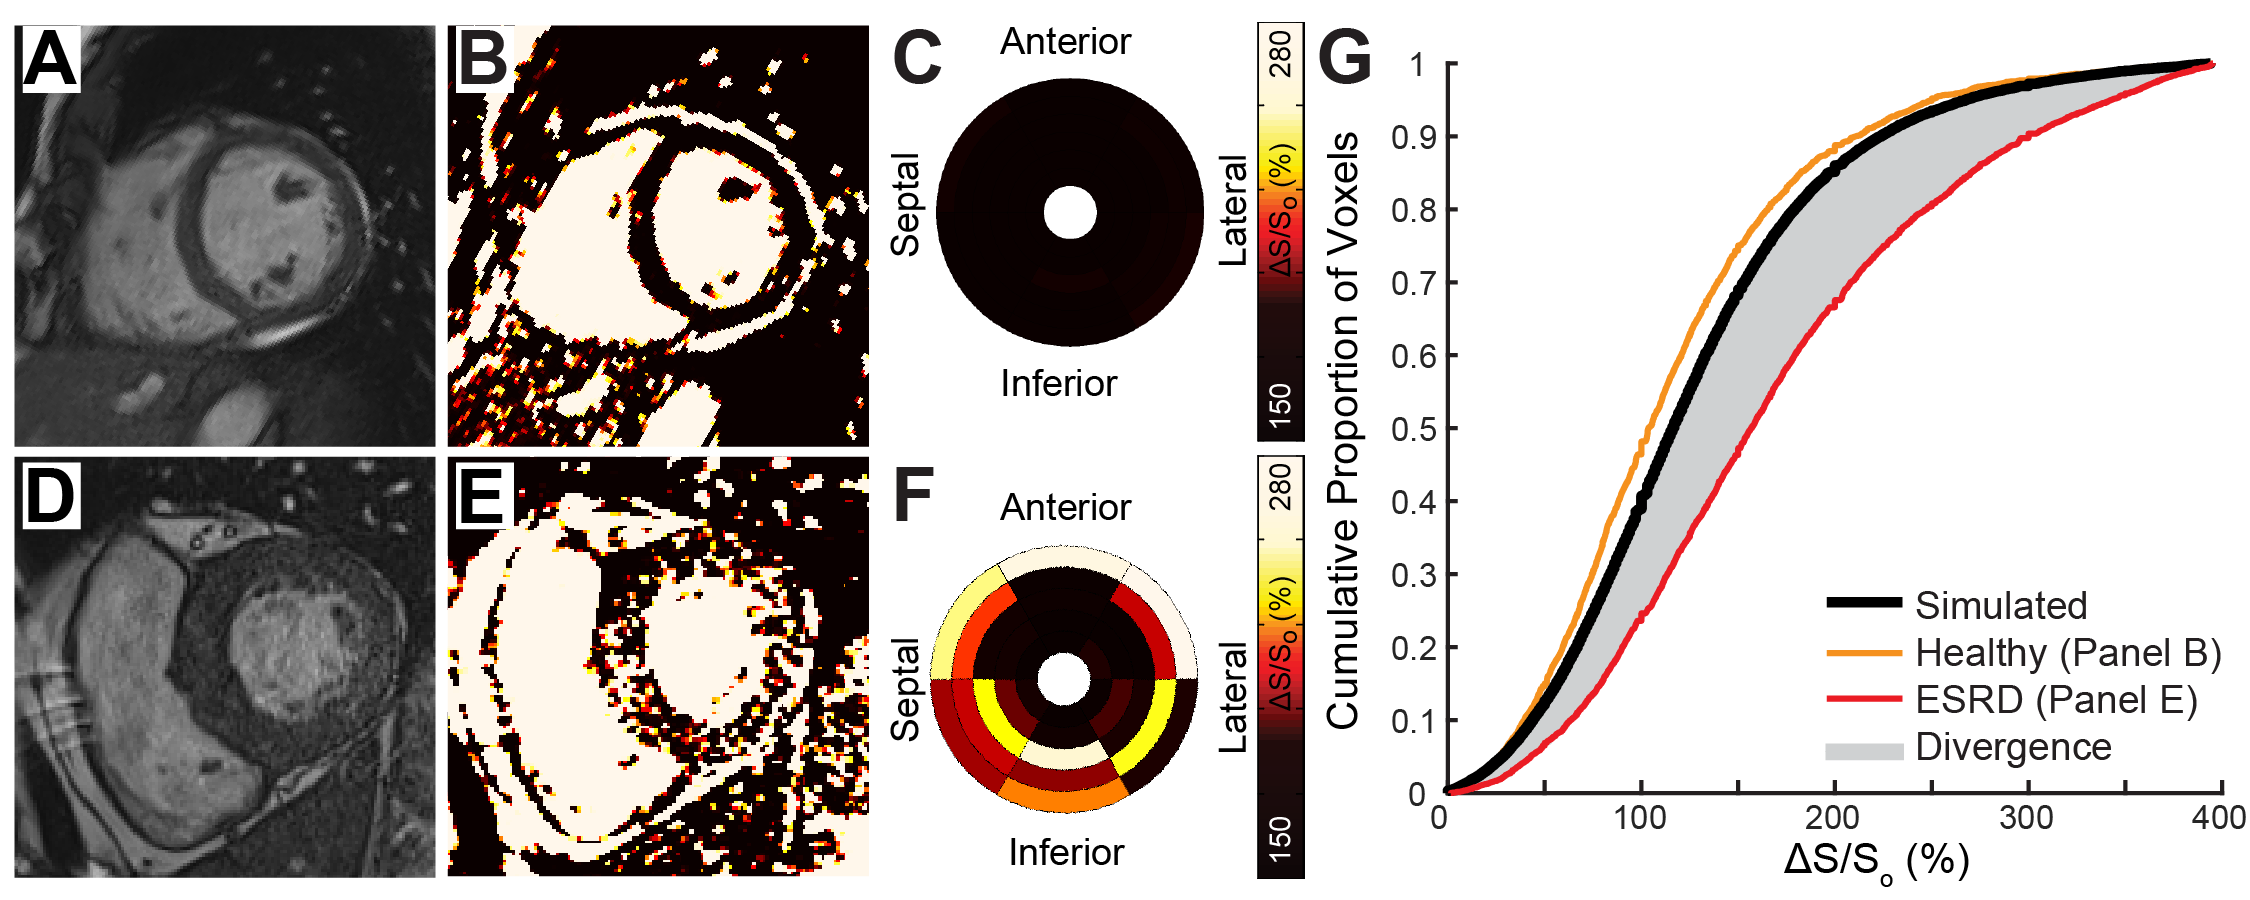
Patients on hemodialysis for ESRD (n=29) and age equivalent healthy controls (n=33) were recruited for CMR at 1.5T (Siemens Aera). Pairs of cine bSSFP images were acquired at flip angles of 45° and 5° in a short axis stack spanning the left ventricle. Maps of ΔS/So were calculated as ΔS/So=(S45-S5)/S5*100 (%), where Si is signal intensity per voxel at flip angle i. Myocardial voxels from all controls were used to plot a standard reference cumulative distribution function of ΔS/So (Figure 1). Fibrotic burden was quantified by integrating the difference between the standard reference and each participant’s cumulative distribution of ΔS/So, to yield a divergence value which indicates the degree of myocardial signal elevation due to reduced MT (Figure 1). Ventricular strains were measured by a custom feature tracking algorithm2 in circumferential and longitudinal planes. Serum troponin T (TnT), fibroblast growth factor 23 (FGF23), parathyroid hormone (PTH), matrix metalloproteinases (MMP) 2 and 9, and tissue inhibitor of MMP (TIMP) 1 and 2 were measured with ELISA or multiplex assay. Divergence was compared to structural, functional, and biomarker correlates using Spearman correlations.Results
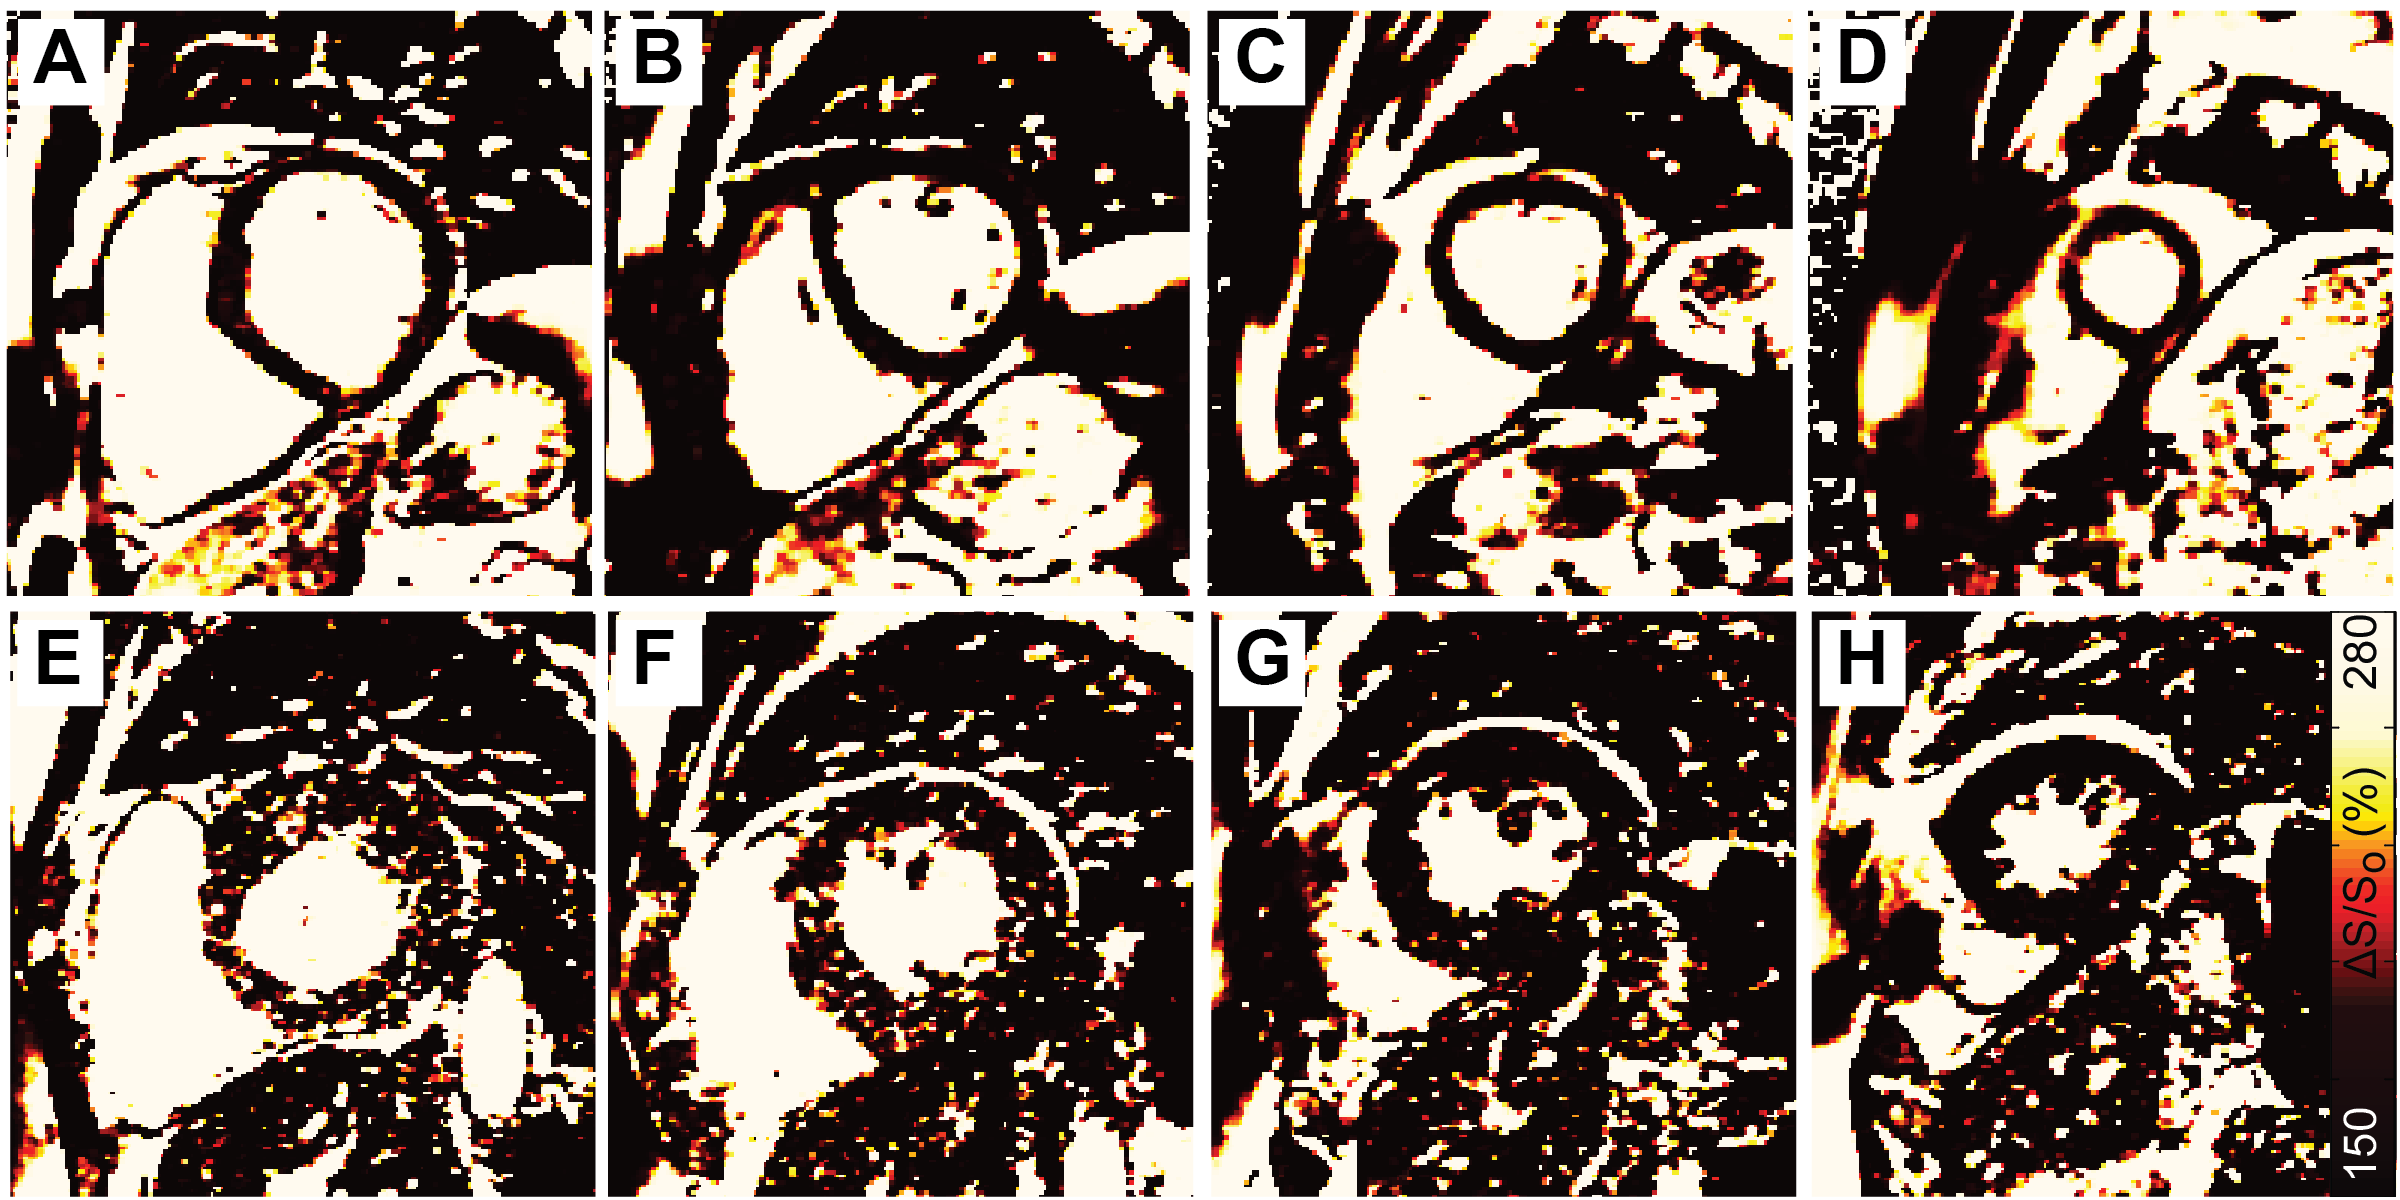
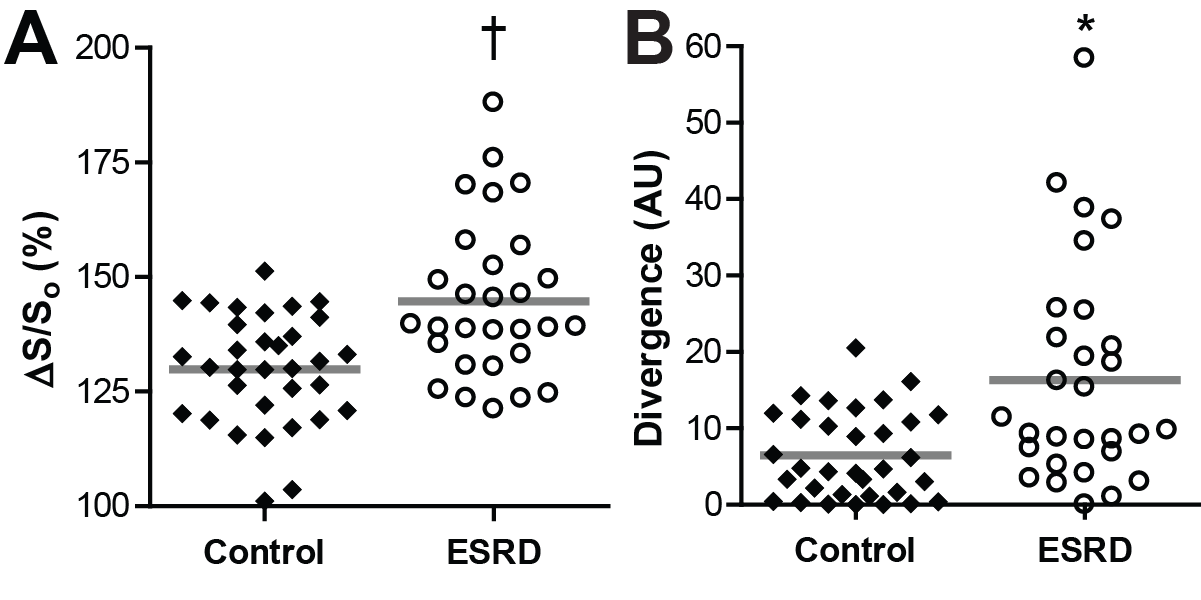
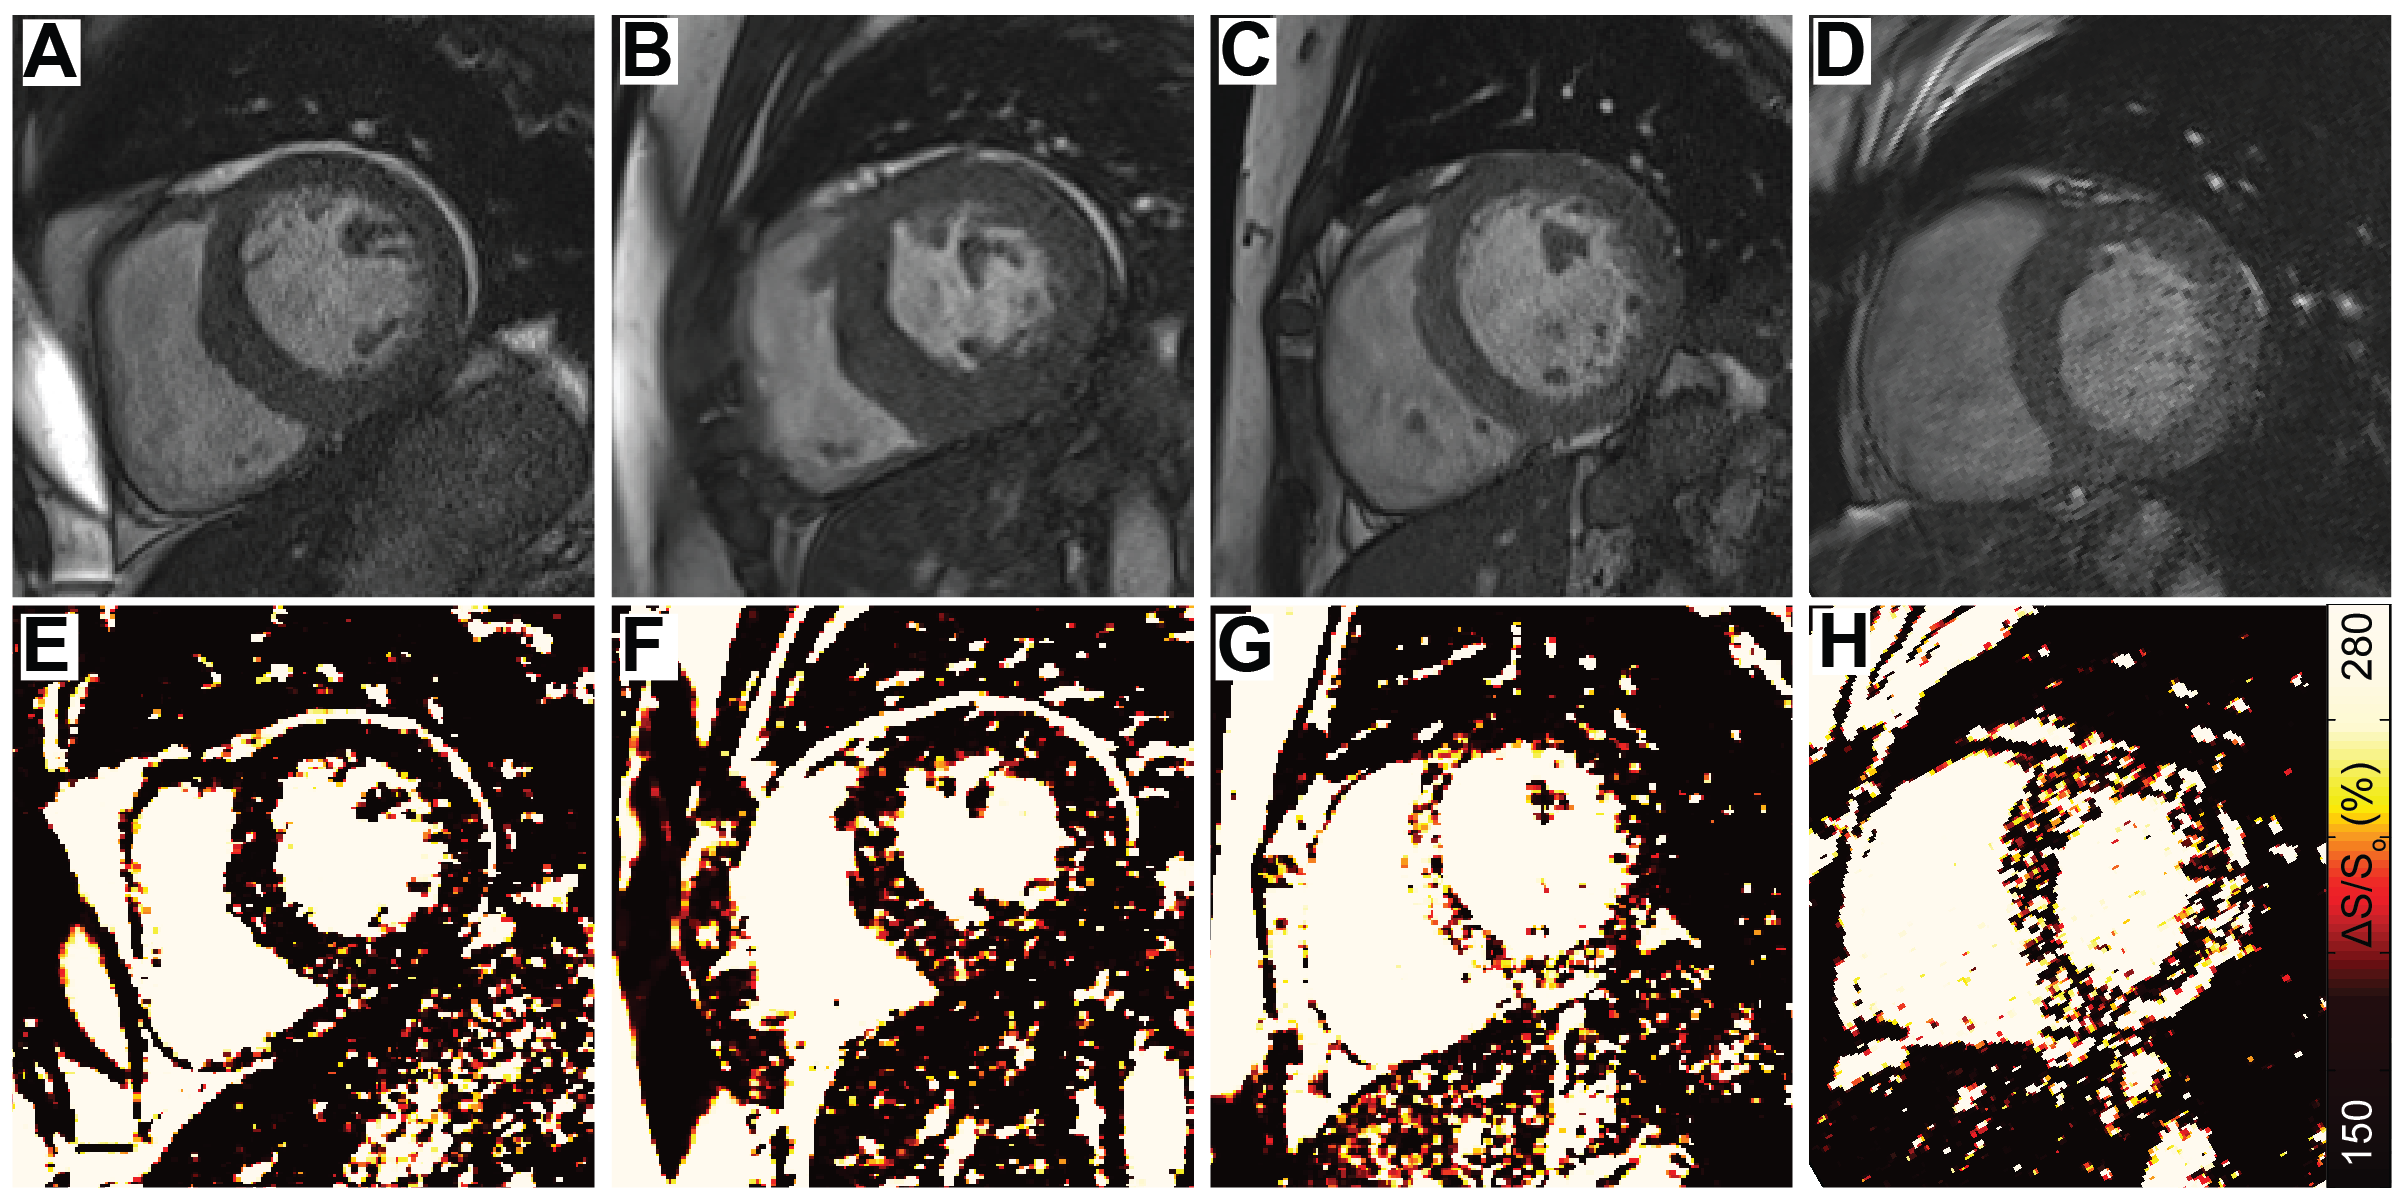
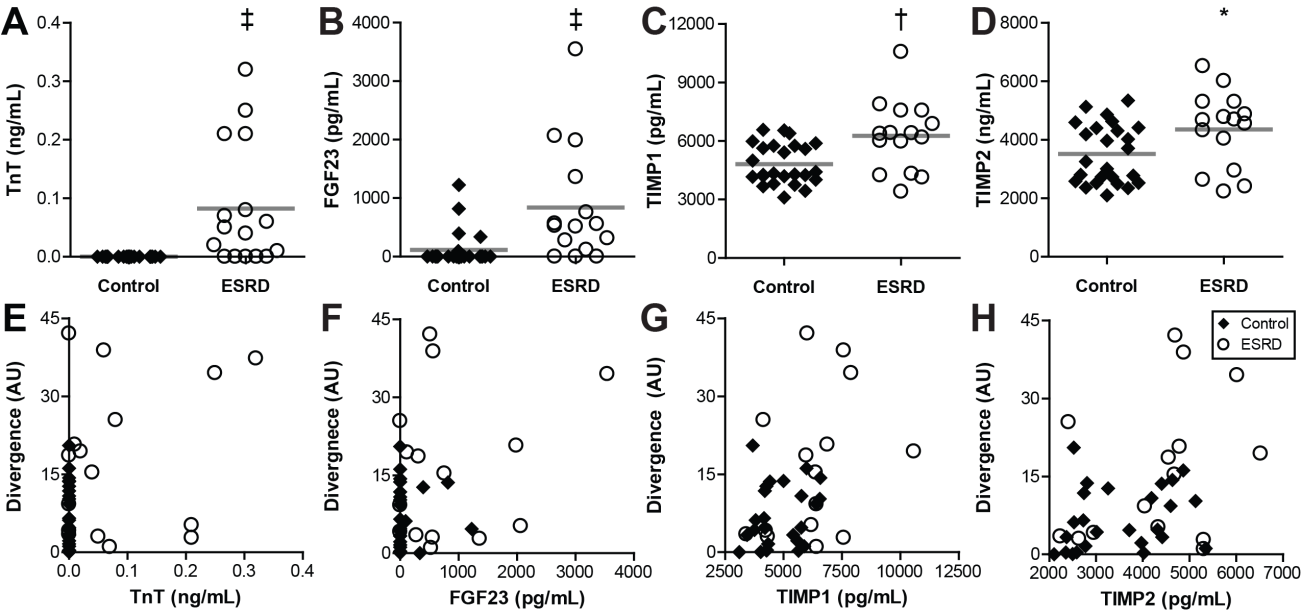
Patients with ESRD displayed prevalent ventricular hypertrophy (septal thickness = 1.3 ± 0.3 cm) compared to controls (0.9 ± 0.2 cm, p<0.01) but preserved ejection fraction (61.5 ± 10.6% vs 61.5 ± 6.9% in controls, p=NS). Global longitudinal strain was slightly reduced compared to age-equivalent controls (-20.5 ± 4% vs -22.9 ± 3.5% respectively, p<0.05), with no difference in diastolic strain rates (162.8 ± 41.7% and 174.1 ± 33.9%, p=NS). Controls demonstrated uniformly low ΔS/So, while elevations in ΔS/So were present in many patients with ESRD (Figure 2). ΔS/So and divergence were significantly elevated in the ESRD group compared to controls (Figure 3). No association was observed between divergence and strain measures. Only a moderate correlation between divergence and hypertrophy (left ventricular mass index) was observed (rho = .31, p<0.05) as illustrated in Figure 4. TnT, FGF23, PTH, TIMPs were elevated in ESRD patients (Figure 5). MMP9 was reduced in ESRD compared to controls (682.1 ± 475.8 ng vs 1254.8 ± 1399.3 ng, p<0.05). Correlation analysis with divergence revealed moderate associations between fibrosis and TnT (rho = 0.32, p = 0.043), PTH (rho = 0.33, p = 0.035), TIMP1 (rho = 0.39, p = 0.013), and TIMP2 (rho = 0.40, p = 0.011) but not FGF23 nor MMPs. Importantly, TnT (rho = 0.59, p <0.001), FGF23 (0.343, p = 0.030), and PTH (rho = 0.37, p = 0.019) correlated with left ventricular mass index, indicating that they may be unsuitable for fibrosis detection in patients with ESRD.Discussion
We have recapitulated the findings of prevalent interstitial fibrosis previously measured by LGE3,4 with a gadolinium-free, MT-weighted CMR technique. Our results suggest that hypertrophy or measures of total ventricular strains may be inappropriate surrogates for measurement of tissue fibrosis in ESRD patients. Further, markers of extracellular matrix turnover, such as TIMPs, may represent more specific biomarkers of fibrosis than the common measures of ischemia (TnT) and remodeling (FGF23) and could offer molecular targets for development of anti-fibrotic therapeutics.Conclusion
While ventricular hypertrophy and fibrosis are prevalent and related in ESRD, they must be approached as distinct phenotypes of disease. The noninvasive measurement of fibrosis with MT-weighted CMR could improve diagnostic and therapeutic decisions in patients with ESRD who cannot undergo gadolinium enhancement CMR.Acknowledgements
This work was supported by CCTS KL2TR000116, NHLBI 1R01HL128592 & American Heart Association National Affiliate 14CRP20380071 to MHV, TL1RR000115 to TAS, and NIH CTSA UL1TR000117 to the University of Kentucky.References
1. Stromp TA, Leung SW, Andres KN, et al. Gadolinium free cardiovascular magnetic resonance with 2-point Cine balanced steady state free precession. J Cardiovasc Magn Reson. 2015;17(1):90
2. Jing L, Haggerty CM, Suever JD, et al. Patients with repaired tetralogy of Fallot suffer from intra- and inter-ventricular cardiac dyssynchrony: a cardiac magnetic resonance study. Eur Heart J Cardiovasc Imaging. 2014;15(12):1333-43.
3. Schietinger BJ, Brammer GM, Wang H, et al. Patterns of late gadolinium enhancement in chronic hemodialysis patients. JACC Cardiovasc Imaging. 2008;1(4):450-6.
4. Mark PB, Johnston N, Groenning BA, et al. Redefinition of uremic cardiomyopathy by contrast-enhanced cardiac magnetic resonance imaging. Kidney Int. 2006;69(10):1839-45.
Figures