0513
The Cerebellum and Brainstem Together Increase Classification Accuracy for Autism Spectrum Disorder over the Whole Brain1Centre for Neuroimaging Sciences, Institute of Psychiatry, Psychology and Neuroscience, King's College London, London, United Kingdom, 2Department of Cognitive Neuroscience, Donders Institute for Brain, Cognition and Behaviour, Radboud University Medical Center, Nijmegen, Netherlands, 3Centre for Neuroimaging Sciences, Institute of Psychiatry, Psychology and Neuroscience, King's College London; Cambridge University; Oxford University, London; Cambridge; Oxford, United Kingdom, 4Radboud University Medical Center; King's College London; University Medical Center Utrecht; Central Institute of Mental Health Mannheim, Nijmegen; London; Utrecht; Mannheim, Netherlands, 5Sackler Institute of Translational Neuroimaging, Department of Forensics and Neurodevelopmental Sciences, Institute of Psychiatry, Psychology and Neuroscience, King's College London, London, United Kingdom
Synopsis
Autism spectrum disorder (ASD) has been linked to cerebellar and brainstem dysfunction and abnormal development, but it remains unclear whether these regional abnormalities can help classify the disorder. Performing machine learning based classification using Jacobian determinant based features on two independent male ASD cohorts (adult and paediatric) of different sizes and age range, we demonstrated a consistently higher classification accuracy by up to 15% using the cerebellum and brainstem as regions of interest classifiers over the whole brain. In both cohorts, classification was driven by regional differences in the posterior lateral cerebellum.
Purpose
Autism spectrum disorder (ASD) is a life-long neurodevelopmental condition affecting approximately 1% of the population in the UK1. It is characterized by repetitive and stereotypic behaviour, a pattern shown to occur with cerebellar2 and brainstem dysfunction3 as reflected in reduced grey matter volume and Purkinje cell density4 in the lateral posterior cerebellar lobe and pons5. Accumulating evidence suggests that these differences are due to disruptions during key developmental ‘sensitive periods’ of shared cerebellum and brainstem development, leading to abnormal synaptogenesis in the developing ASD brain6. Thus, if the cerebellum and brainstem develop abnormally, these should be reflected not only in volume differences but also changes in deeper tissue properties. Such tissue constrictions and expansions within brain structure can be detected by weighted Jacobian images7. Here, we chose machine learning based classification using Jacobian determinant features as an unbiased method to derive images weighted on differences within the cerebellum and brainstem as well as the whole brain between ASD and controls.Methods
Sample. One hundred and forty participants (70 control: 70 ASD) aged 18 to 44 years for the adult cohort and 47 participants (23:24) aged 8 to 12 years for the paediatric cohort were included. All participants were male, right-handed, with total IQ≥70, and were free of any major physical or neurological disorders. For the ASD group, a DSM-IV-TR or ICD-10 diagnosis for ASD had to be present. MRI acquisition. MR data was acquired for each cohort across two sites (adult: King's College London and University of Cambridge; paediatric: Donders Institute and Mannheim Central Institute of Mental Health) on 3 Tesla MRI scanners (adult: GE Medical Systems HDx; paediatric: Siemens Trio and Siemens Prisma). Scanning sequences were based on standardised ADNI GO8 and DESPOT9 protocols. MRI analysis. For the whole brain, we used the following steps for analysis: DARTEL registration10 to a common inter-subject space, a DARTEL utility to create Jacobian images. For the cerebellum and brainstem, we used the following steps for analysis: SPM12's SUIT toolbox11 was used to isolate both structures; DARTEL registration to SUIT space, a DARTEL utility to create Jacobian images. After applying a thresholded mask created in Matlab to fit whole brain or cerebellum and brainstem to exclude extracerebral or extracerebellar voxels, we used a linear support vector machine (SVM) learning algorithm, implementing the C cost support vector classifier (SVC) at a fixed value of C=1 throughout all classifications. Using freely available Matlab code (https://github.com/leonaksman/lpr), we created Jacobian weighted images, forward maps, as well as p and t thresholded maps at p≤.005.Results
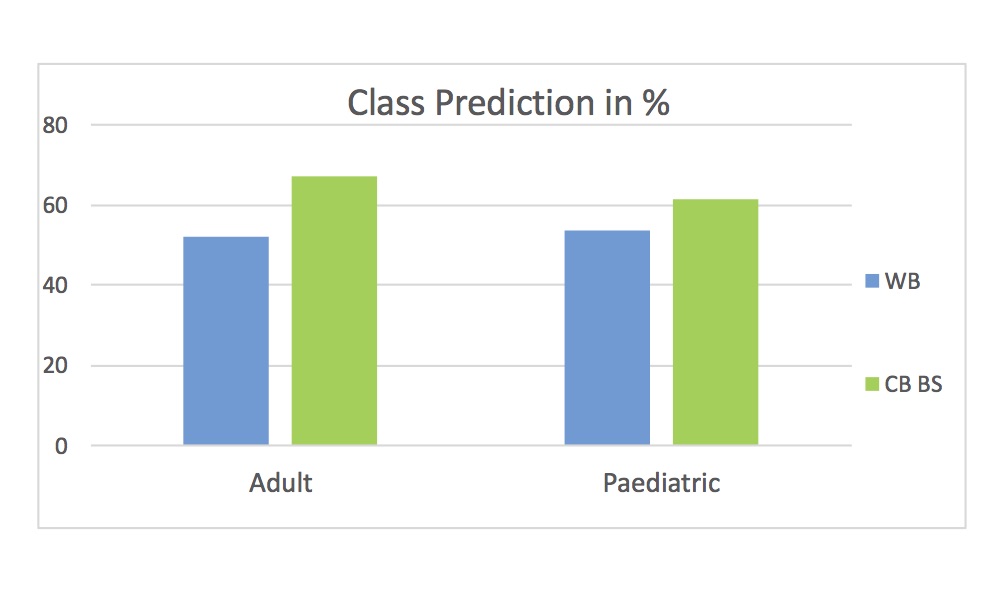
The cerebellum and brainstem displayed 67% classification accuracy in discriminating ASD subjects from controls in the adults and 61.5% in the paediatric cohort. The whole brain reached 52% classification accuracy in the adults and 53.8% in the paediatric sample. All results were thresholded at p≤.005.Discussion
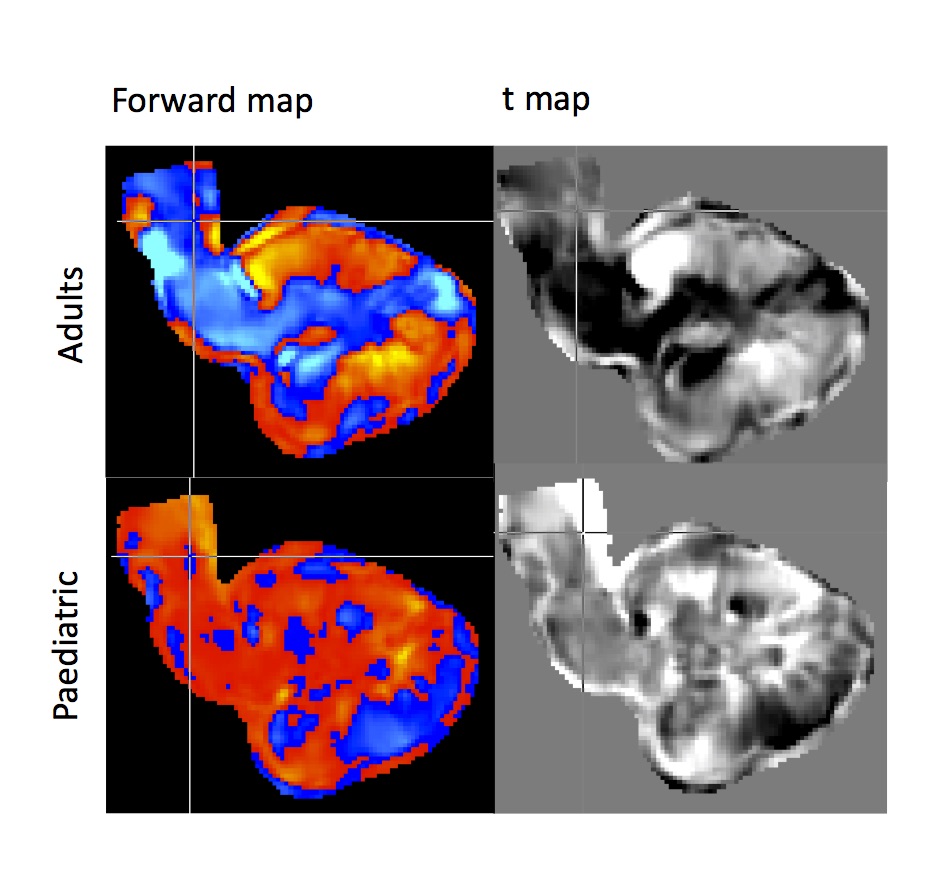
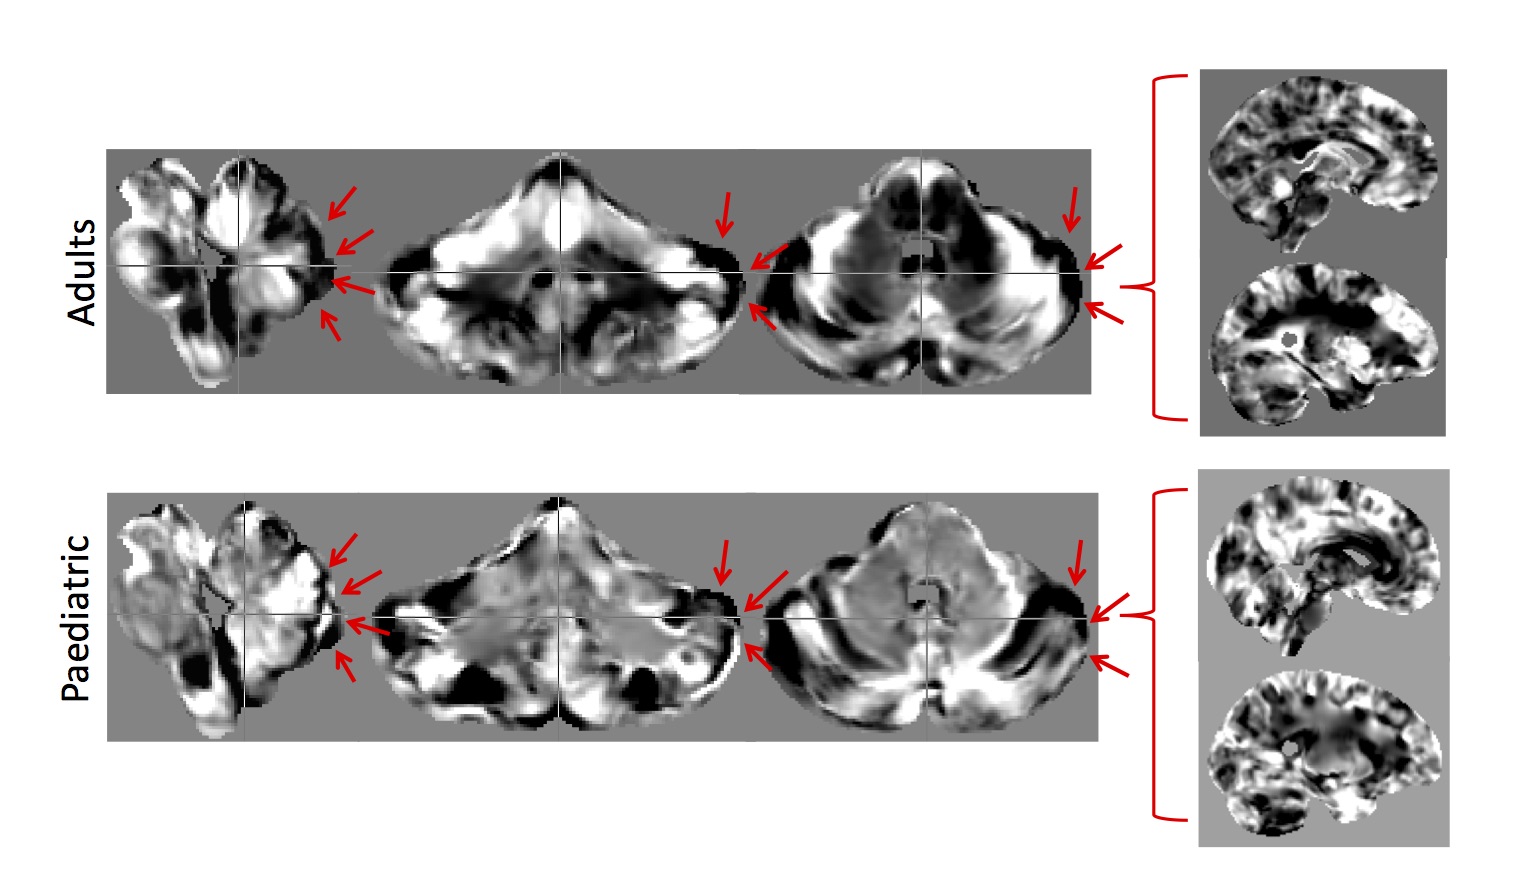
The cerebellum and brainstem displayed a consistently higher classification accuracy ranging from 8-15% higher over the whole brain (Figure 1). From the linear disease classifier, we formed a forward map where stronger positive values indicate a stronger region-disease association while negative values indicate a stronger region-control association7,12 (Figure 2). In both cohorts, disease classification was driven by differences in the lateral cerebellum and pons (Figure 2). Specifically, a ring-like pattern of posterior lateral tissue expansion followed by tissue restriction of the cerebellar cortex was notable in both age groups (Figure 3). The cerebellum grows posterior-laterally throughout its development and post mortem studies of ASD have consistently shown reduced Purkinje cell density in these regions4 as well as differences in the pons5. The tissue classifier differences we found across both age ranges which might indicate such microstructural abnormalities in ASD. Furthermore, previous studies have found abnormal synaptogenesis and pruning during brain development in ASD6, suggesting that the ring-like patterns found might reflect these autism specific abnormalities in brain development.Conclusion
The cerebellum and brainstem together show higher classification accuracy over the whole brain across two different age ranges and width, cohort size and possibly onset of disorder. Furthermore, both cohorts showed a similar ring-like expansion-constriction pattern in the lateral cerebellum, suggesting a possible structural feature of autism present already in childhood ASD. However, it remains unclear whether this pattern corresponds to microtissue changes and should be followed up by post mortem histology. Furthermore, next steps will include integrating our findings with the proven strength of cortical measures to add value to our efforts to classify ASD patients throughout the lifespan.Acknowledgements
No acknowledgement found.References
1. Baio, J. Prevalence of Autism Spectrum Disorders: Autism and Developmental Disabilities Monitoring Network, 14 Sites, United States, 2008. Morbidity and Mortality Weekly Report. Surveillance Summaries. Vol 61, Nr 3. Centers for Disease Control and Prevention (2012).
2. D'Mello, A. M., Crocetti, D., Mostofsky, S. H. & Stoodley, C. J. Cerebellar gray matter and lobular volumes correlate with core autism symptoms. YNICL 7, 631–639 (2015).
3. Rodier, P. M. Converging evidence for brain stem injury in autism. Development and Psychopathology 14, 537–557 (2002).
4. Skefos, J. et al. Regional Alterations in Purkinje Cell Density in Patients with Autism. PLoS ONE 9, e81255 (2014).
5. Hashimoto, T. et al. Development of the brainstem and cerebellum in autistic patients. Journal of Autism and Developmental Disorders 25, 1–18 (1995). 6. Wang, S. S. H., Kloth, A. D. & Badura, A. The Cerebellum, Sensitive Periods, and Autism. Neuron 83, 518–532 (2014).
7. Aksman, L. M. et al. Making use of longitudinal information in pattern recognition. Hum. Brain Mapp. (2016). doi:10.1002/hbm.23317
8. Jack, C. R. et al. The Alzheimer's disease neuroimaging initiative (ADNI): MRI methods. Journal of Magnetic Resonance Imaging 27, 685–691 (2008).
9. Deoni, S. C. L. et al. Standardized structural magnetic resonance imaging in multicentre studies using quantitative T1 and T2 imaging at 1.5 T. NeuroImage 40, 662–671 (2008).
10. Ashburner, J. A fast diffeomorphic image registration algorithm. NeuroImage 38, 95–113 (2007).
11. Diedrichsen, J., Balsters, J. H., Flavell, J., Cussans, E. & Ramnani, N. A probabilistic MR atlas of the human cerebellum. NeuroImage 46, 39–46 (2009).
12. Haufe, S. et al. On the interpretation of weight vectors of linear models in multivariate neuroimaging. NeuroImage 87, 96–110 (2014).
Figures