0509
“Brain Rust” in Schizophrenia Revealed by in vivo Redox (NAD+/NADH) Measurement1McLean Hospital, Harvard Medical School, Belmont, MA, United States, 2West China Hospital, Sichuan University, Chengdu, People's Republic of China
Synopsis
A growing body of evidence suggests that an “immuno-oxidative” pathway including redox dysregulation associated with oxidative stress, mitochondrial dysfunction, neuroinflammation, and cell-mediated immune response may contribute to disruptions in brain activity in schizophrenia (SZ). The aim of this study is to assess possible redox imbalance in SZ patients by using a novel in vivo 31P-MRS technique to measure NAD+ and NADH. Our results revealed a ~40% decrease of NAD+/NADH ratio compared to healthy individuals of similar age, indicating higher levels of oxidative stress in patients with schizophrenia. This work may lead to new strategies to protect the brain from oxidative stress and improve brain function in schizophrenia or the other brain disorders.
Purpose
Schizophrenia (SZ) is a common and severe psychiatric disorder characterized by abnormal cognition and perception. Despite its public health impact and a century of biological research, the pathophysiology of SZ remains poorly understood. A growing body of evidence suggests that an “immuno-oxidative” pathway including oxidative stress, mitochondrial dysfunction, and neuroinflammation may contribute to disruptions in brain circuits in schizophrenia (SZ) (1-3). Nicotinamide adenine dinucleotide (NAD+) and its reduced form NADH have long been implicated in energy metabolism, reductive biosynthesis, and antioxidant activity. While the major biological function of NAD+ is to modulate cellular energy metabolism, mounting evidence indicates that NAD+ is also involved in biological activities such as cell death, calcium homeostasis, gene expression, aging, and immunological functions (4). Despite the crucial roles of NAD+ and NADH in cellular metabolism and physiology, its noninvasive in vivo detection is extremely challenging. Here we demonstrate the feasibility of 31P MRS-based NAD quantification at 4 T MRI scanner and apply this novel method in patients with SZ.Method
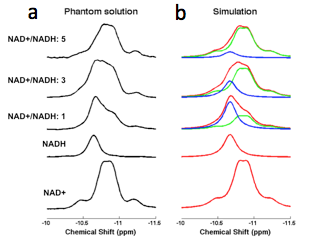
We investigate the brain’s redox state (i.e., NAD+/NADH ratio, RR) in SZ patients with chronic, well-established illness as well as first-episode SZ patients who have not been exposed to the confounding effects of chronic medication treatment and chronic psychosis. We also present data from a first-episode bipolar disorder (BD) cohort, as a psychiatric control group. The participants included 40 healthy controls, 21 chronic SZ, 13 first-episode SZ, and 18 first-episode BD patients. All participants initially underwent structural imaging at a 3 T and 31P MRS measurements were performed on a 4 T MR scanner. NAD+ and NADH concentrations were determined by nonlinear least-square fitting of the model simulated spectra incorporating prior chemical shift and coupling constant information to in vivo resonances obtained from 31P-MRS experiments (5). We validated 31P-MRS based NAD detection method at 4 T with phantom and healthy human subjects as well as Monte-Carlo simulations.Result and Discussion
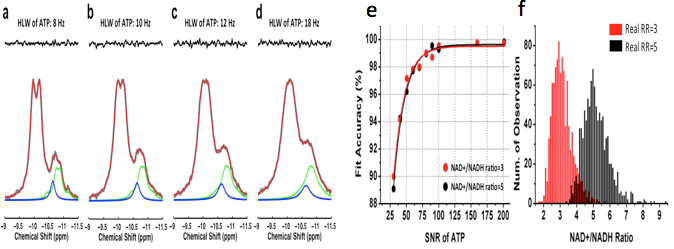
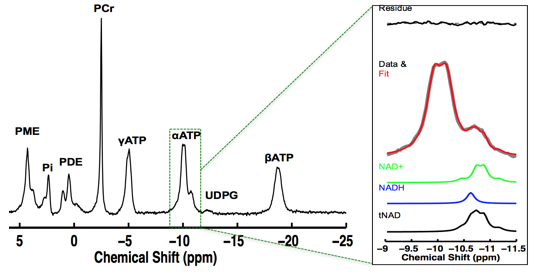
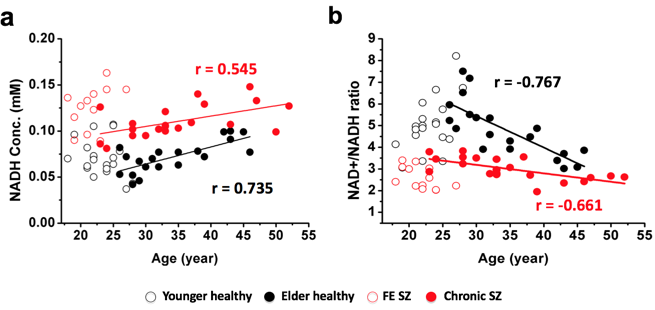
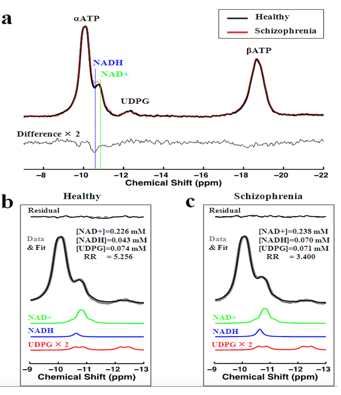
We demonstrated (5) excellent agreement between simulated and experimentally measured 31P spectra (Figure 1), and Monte Carlo simulations with different line width and a-ATP SNR values (Figure 2) suggest excellent fitting accuracy for SNR (>40), which was used as a cut off for our in vivo data processing. Figure 3 presents in vivo 31P spectra from media prefrontal cortex of a healthy control participant, showing excellent spectral quality and high SNR. Figure 4 shows in vivo RR data in chronic and first episode SZ patients and matched healthy participants as well as age-dependence. NAD measures and RR show strong age-dependence in healthy individuals, demonstrating replication of RR decline in healthy participants (3) and an extension of this finding to SZ patients. In addition, the youngest participants (age<25) have lower RR than older ones, apparently reversing the age-dependent trend. This finding requires further investigation in children and adolescents. We found RR was significantly reduced by 35% in chronic SZ. This finding was driven by a 47% NADH elevation in chronic SZ with no significant change in NAD+. In addition, first-episode SZ patients had a highly significant 46% reduction in RR compared with healthy controls as well as a more modest 23% reduction compared with first-episode BD patients. To provide a demonstration of NAD abnormalities independent of the fitting procedures and without the other metabolite contributions (e.g. UDPG), Figure 5 shows summed patient and control spectra and the difference between them, clearly demonstrating an elevated NADH signal at -10.63 ppm in chronic SZ compared to controls, without an apparent difference in NAD+ and UDPG. These findings provide an evidence for redox imbalance in the brain in all phases of SZ, potentially reflecting oxidative stress, and suggest that RR may become a biomarker for treatment response and for screening of new therapeutic approaches targeting oxidative stress in SZ.Conclusion
By applying this novel method to patients with SZ, we found a significant reduction in the NAD+/NADH ratio (RR) in chronically ill SZ patients compared to a matched healthy control group, and in first-episode SZ patients compared to both a matched first-episode BD patient group and a matched healthy control group. Intracellular RR is influenced by multiple cellular signaling events and may constitute a metabolic integrator for local metabolic status within cells. Therefore, our work provides new insights into the pathophysiology of SZ, as well as a biomarker for tracking the impact of treatment interventions. This work will lead to new strategies to protect the brain from oxidative stress and improve brain function in schizophrenia.Acknowledgements
This work was supported by grants from MH092704 (F.D.); NARSAD (F.D.); NARSAD (D.O.); MH094594 (D.O.); MH104449 (D.O.); Program for Neuropsychiatric Research (B.M.C.).References
1. Giles E. Hardingham, et al. Nature Rev. Neuroscience 2016
2. Du F, et al. JAMA Psychiatry 2014
3. Lu M, et al. Magn Reson Med 2014;
4. Zhu XH, et al. Proc Natl Acad Sci USA 2015;
5. Kim S, et al. Schizophrenial Bull 2016 (in press)
Figures