0508
Relationship Between Prefrontal GABA Levels and Hippocampal Resting Activity in Subjects at Ultra High Risk of Psychosis: A Combined MRS-pCASL study1Institute of Psychiatry, Psychology & Neuroscience, King's College London, London, United Kingdom, 2University Medical Center Utrecht, Utrecht, Netherlands, 3University of Surrey, Guildford, United Kingdom, 4CAMEO, Cambridgeshire and Peterborough Mental Health Partnership NHS Trust, Cambridge, United Kingdom, 5University of Roehampton, London, United Kingdom
Synopsis
Converging evidence from preclinical studies indicates that dysfunction of the gamma-aminobutyric acidergic (GABAergic) neurotransmitter system plays a major role in the pathophysiology of schizophrenia. Despite the improved methods and reliability of neuroimaging measurements, which have recently facilitated testing predictions from animal models in humans, the extent to which GABAergic neurotransmission is altered in patients with psychosis is less clear. Furthermore, although preclinical evidence suggests that decreased cortical interneuron function leads to hippocampal activity overdrive, no study has explicitly investigated the relationship between neurotransmission and neurophysiology in humans. Here we show that prefrontal GABA function is reduced in individuals at ultra high risk of developing psychosis and that this reduction is related to hippocampal (and nominally to prefrontal) resting activity. These findings shed light on the pathophysiology of vulnerability for schizophrenia by showing that alterations in GABAergic systems have downstream effects on hippocampus before the onset of psychosis.
Purpose
Preclinical and postmortem evidence suggests that altered function of gamma-aminobutyric acidergic (GABAergic) fast-spiking interneurons is central to the pathophysiology of schizophrenia1. In particular, failure from cortical GABAergic interneurons to inhibit excitatory glutamatergic activity is proposed to increase hippocampal activity and consequently drive the elevated subcortical dopamine signaling widely observed in schizophrenia2-5. This study examined whether abnormalities in prefrontal GABA levels are present in subjects at ultra high risk of developing psychosis (UHR), and whether these abnormalities are related to resting neural activity in prefrontal and hippocampal regions.Methods
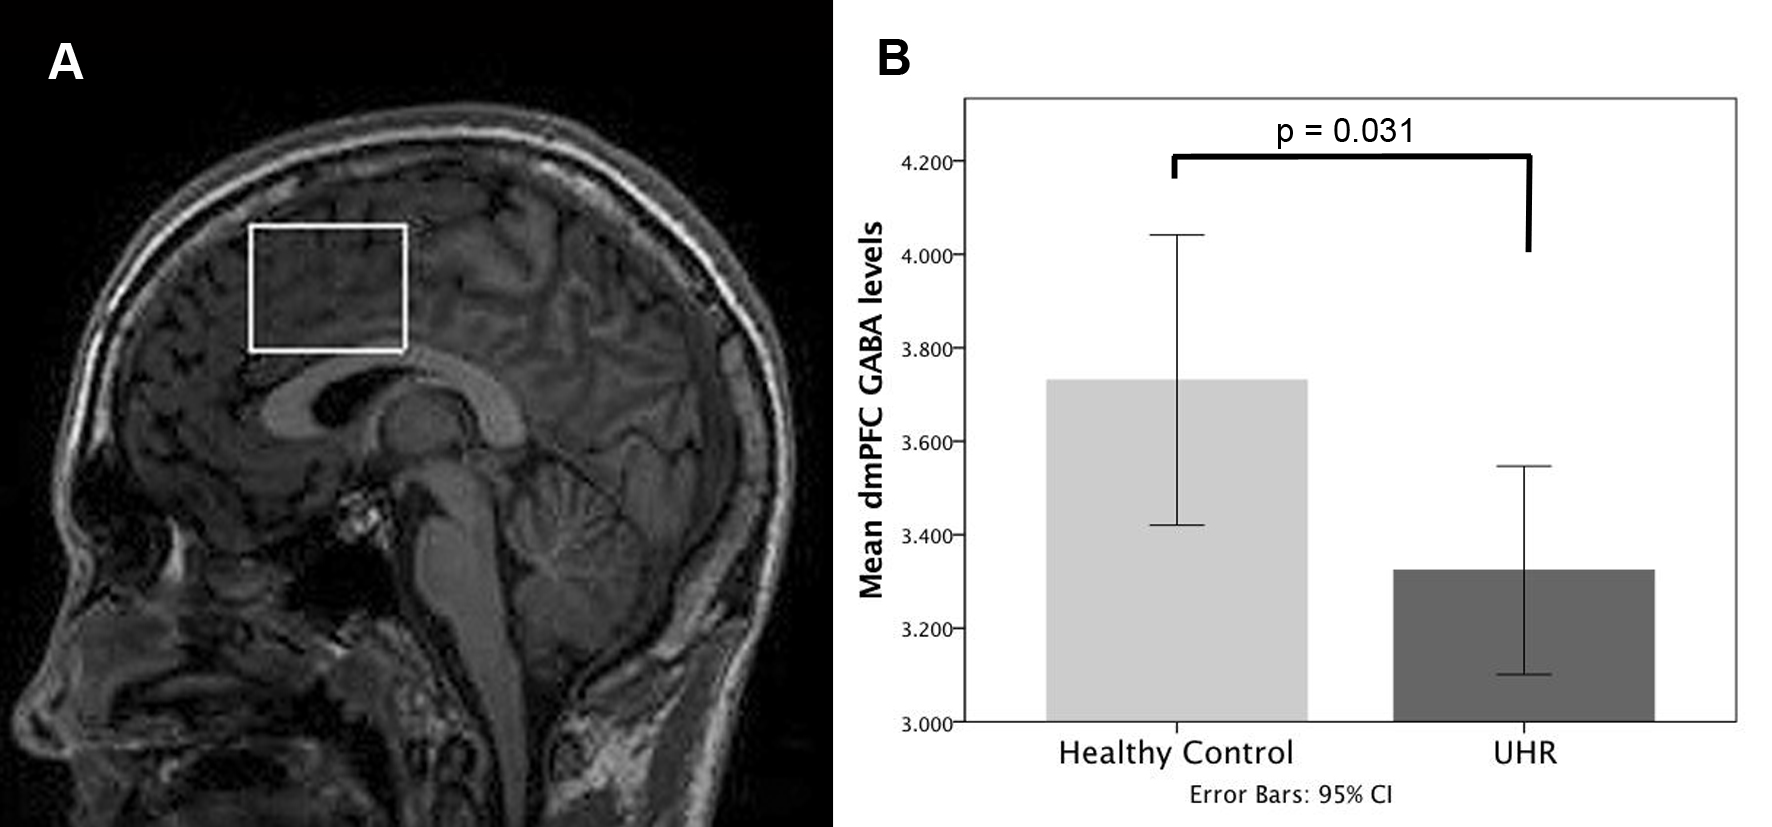
GABA levels in the dorsomedial prefrontal cortex (dmPFC) were measured using proton magnetic resonance spectroscopy (1H-MRS), and resting regional cerebral blood flow (rCBF) using pseudo-continuous arterial spin labeling (pCASL) in 21 antipsychotic-naïve UHR subjects and 20 age-matched healthy males, using a GE MR750 3T scanner (General Electric Healthcare, Chicago, USA). Severity of psychotic symptoms was assessed using the Comprehensive Assessment of At-Risk Mental States6. 1H-MRS was acquired using a MEGA-PRESS sequence, which incorporates a standardized chemically selective suppression (CHESS) water suppression routine (TE = 68ms, TR = 2000ms, field of view = 240 mm, flip angle = 90). The region of interest (ROI) in the dmPFC was prescribed from the midline sagittal localizer, and the center of the 40×35×20mm ROI was placed above the middle section of corpus callosum (Figure 1A). Structural scanning used a 3D inversion recovery prepared spoiled gradient echo (IR-SPGR; TE=3.0ms, TR=7.3ms TI=400; flip angle 11o; matrix size 256x256 over a 270x270mm field of view; 196 1.2mm slices). Spectra were analyzed using LCModel version 6.3-1 L7. Water-scaled GABA, glutamate, Glx (glutamate + glutamine), glutathione, and N-acetylaspartate (NAA) values were corrected for the cerebrospinal fluid (CSF) content of the voxel using the formula: Metabolite Corrected = Metabolite Concentration * [proportion WM + proportion GM + (1.55 * proportion CSF)] / (proportion WM + proportion GM). We determined the voxel CSF content for each subject by extracting the location of the voxel from the spectra file headers, and using an in-house program to calculate the percentage GM, WM, and CSF content using the segmented T1-weighted images, to correct the spectroscopy results for partial volume CSF contamination. For pCASL acquisition, as in a previous study by our group in healthy controls and subjects at ultra high risk of psychosis (UHR)8, we acquired a 3D Fast Spin Echo (FSE) spiral multi-shot readout, following a post-labeling delay of 1.5s (TE = 32.256ms; TR = 5500ms; field of view = 240; flip angle = 90; thickness = 3mm, gap = 3mm, matrix = 64 x 64 mm). For image registration, a high-resolution T2-weighted Fast-Relaxation Fast Spin Echo (FR-FSE) image (TE = 65.28ms, TR = 4380ms, Flip angle = 90, FoV = 240, slice thickness = 2mm, slice gap = 2mm, matrix = 320 x 320mm) was also acquired. pCASL images were preprocessed using FMRIB Software Library (FSL) software applications (http://www.fmrib.ox.a.c.uk/fsl) and Statistical Parametric Mapping (SPM8; http://www.fil.ion.ucl.ac.uk/spm/). A multi-step approach was performed as follows: (1) The “Brain Extraction Tool” (BET) of FSL 7 was used to eliminate extra-cerebral signal from the T2 scan. The skull-stripped T2 volume and its corresponding T2 binary mask were then coregistered to the CASL scan. (2) The CASL scan (rCBF map) was multiplied with the coregistered extracted binary mask using ImCalc to remove extra-cerebral signal from this scan. (3) The coregistered extracted T2 (step 1) and the multiplied CASL image (step 2) were then coregistered back to the space of the original T2 scan (returned to their original frame of reference). (4) The subject’s T2 and multiplied CASL (step 2) were normalized with the T2 template (SPM). (5) The normalized subject’s T2 (step 4) and normalized multiplied CASL (step 4) were smoothed using a 6mm Gaussian smoothing kernel. Between-group differences in dmPFC GABA concentrations were examined with an independent samples t-test in SPSS. In UHR subjects, the relationship between GABA levels and rCBF was investigated by entering the individual GABA values as regressors in a multiple regression design with the rCBF images in SPM8. Based on the evidence of deficient interneuron function in prefrontal cortex and hippocampus in schizophrenia9-11, and findings of altered rCBF in hippocampus in subjects at UHR of psychosis8, we restricted our analyses to dmPFC and bilateral hippocampus using a region of interest (ROI) approach, with a mask created using the Automated Anatomical Labeling as implemented in the WFU_Pickatlas toolbox in SPM. GABA × rCBF interactions were assessed at an initial search threshold of p < .005 uncorrected, to then consider significant regions surviving voxel-wise correction at p < .05 FWE.Results
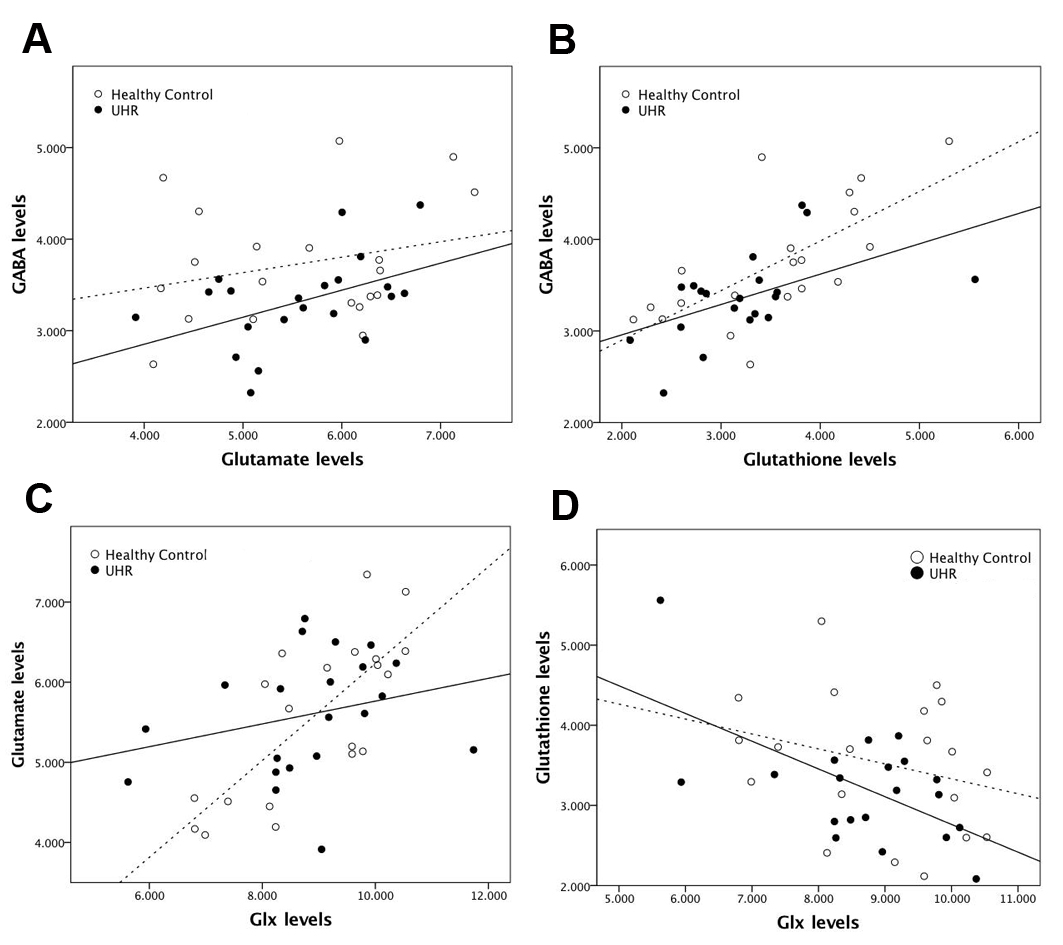
Spectra obtained were of good quality, with LCModel reporting mean ± SD signal-to-noise ratio of 21.63 ± 2.8 and line width of 6.28 ± 1.6 Hz. UHR subjects had significantly lower levels of GABA in the dmPFC than healthy controls (11% decrease; t = 2.243; p = .031; Figure 1B). The GABA reduction was not confounded by use of antidepressant medication (p = .136), cigarette smoking (p = .621), or lifetime exposure to cannabis (p = .834). UHR subjects, levels of GABA in the dmPFC were directly correlated with resting-state perfusion in the right hippocampus (p = .017 FWE, k = 26, T = 5.13, Z = 3.98) (Figure 2A). There were no negative associations with GABA levels surviving p < .05 FWE. At a more lenient threshold (p < .001 uncorrected), there was an association between dmPFC GABA and local resting-state activity (Figure 2B). Pearson correlation analysis between extracted rCBF parameter estimates from the hippocampus and the dmPFC revealed a significant association between these regions (r = -.750, p < .001). GABA levels were positively correlated with glutamate levels in UHR subjects (r = .457; p = .034) (Figure 3A), but not in healthy controls (r = .256, p = .276). Both UHR and healthy controls showed a positive correlation between GABA and glutathione levels (r = .514, p = .020; and r = .693, p = .001, respectively) (Figure 3B). Healthy controls also showed a strong positive correlation between glutamate and Glx (r = .752, p < .001), which significantly differed from UHR subjects (z = 2.1, p = .036) (Figure 3C). Finally, there was a negative association between glutathione and Glx in UHR subjects (r = -.593, p = .006), but not in healthy controls (r = -.275, p = 240) (Figure 3D).Conclusion
To our knowledge, this is the first multimodal imaging study to report that decreased GABAergic levels are associated with hippocampal activity before the onset of psychosis. These findings provide novel evidence for local and downstream effects of altered prefrontal GABAergic function on basal activity of the hippocampus in the UHR state.Acknowledgements
This work was supported by a Wellcome Trust Programme Grant to P.M. (#091667, 2011). The authors wish to thank Prof. Gareth J Barker and Dr. Dave Lythgoe for invaluable help on MRS data acquisition and quantification, the MRI radiographers for their expert assistance, and the study volunteers for their participation. We also gratefully thank the clinical staff at the OASIS, CAMEO, and Warwick & Coventry teams who were involved in the recruitment and management of the UHR subjects in this study.References
1. Marin O. Interneuron dysfunction in psychiatric disorders. Nature reviews Neuroscience. 2012;13(2):107-120.
2. Grace AA. Gating of information flow within the limbic system and the pathophysiology of schizophrenia. Brain research Brain research reviews. 2000;31(2-3):330-341.
3. Grace AA. Ventral Hippocampus, Interneurons, and Schizophrenia: A New Understanding of the Pathophysiology of Schizophrenia and Its Implications for Treatment and Prevention. Current directions in psychological science. 2010;19(4):232-237.
4. Lisman JE, Coyle JT, Green RW, et al. Circuit-based framework for understanding neurotransmitter and risk gene interactions in schizophrenia. Trends in neurosciences. 2008;31(5):234-242.
5. Modinos G, Allen P, Grace AA, McGuire P. Translating the MAM model of psychosis to humans. Trends in neurosciences. 2015;38(3):129-138.
6. Yung AR, Yuen HP, McGorry PD, et al. Mapping the onset of psychosis: the Comprehensive Assessment of At-Risk Mental States. The Australian and New Zealand journal of psychiatry. 2005;39(11-12):964-971.
7. Provencher SW. Estimation of metabolite concentrations from localized in vivo proton NMR spectra. Magn Reson Med. 1993;30(6):672-679.
8. Allen P, Chaddock CA, Egerton A, et al. Resting Hyperperfusion of the Hippocampus, Midbrain, and Basal Ganglia in People at High Risk for Psychosis. The American journal of psychiatry. 2016;173(4):392-399.
9. Benes FM, McSparren J, Bird ED, SanGiovanni JP, Vincent SL. Deficits in small interneurons in prefrontal and cingulate cortices of schizophrenic and schizoaffective patients. Archives of general psychiatry. 1991;48(11):996-1001.
10. Benes FM. Amygdalocortical circuitry in schizophrenia: from circuits to molecules. Neuropsychopharmacology : official publication of the American College of Neuropsychopharmacology. 2010;35(1):239-257.
11. Lewis DA, Hashimoto T, Volk DW. Cortical inhibitory neurons and schizophrenia. Nature reviews Neuroscience. 2005;6(4):312-324.
Figures