0507
Dose-dependent effects of citalopram on serotonergic function assessed with SPECT and pharmacological MRI1Department of Radiology, Academic Medical Center, University of Amsterdam, Amsterdam, Netherlands, 2Sunnybrook Research Institute, University of Toronto, Toronto, Canada, 3Department of Nuclear Medicine, Academic Medical Center, University of Amsterdam, Amsterdam, Netherlands
Synopsis
Serotonin transporter (SERT) imbalances are involved in the pathogenesis of a wide range of neuropsychiatric diseases, including depression. SERT blockers, like citalopram, decrease radioligand binding to the SERT in a dose-dependent manner, as measured with SPECT. In addition to replicating this finding, we show that pharmacological MRI (phMRI) can also detect differences in SERT occupancy with different oral doses of citalopram; higher citalopram plasma levels are associated with lower subsequent changes in the phMRI signal upon an intravenous citalopram challenge. This is important as this non-ionizing technique allows longitudinal assessment of the serotonin system.
Purpose
The serotonin transporter (SERT) has been implicated in a number of psychiatric disorders and is an important target for psychotropic medication, e.g. anti-depressants. Molecular imaging techniques, such as single photon emission computed tomography (SPECT), can visualize SERT occupancy and its blockade by serotonergic medication, such as selective serotonin reuptake inhibitors (SSRIs)1,2. However, to investigate the role of the SERT in psychiatric disorders longitudinally, pharmacological MRI (phMRI) could provide a non-ionizing alternative. Previous studies have shown that SSRIs induce hemodynamic changes in brain areas rich in SERT, e.g. the thalamus3–6. However, it is currently unclear whether phMRI can also detect dose-dependent blockade of SERT. Therefore, the purpose of the current study is to characterize the relationship between hemodynamic responses and different levels of SERT occupancy.Methods
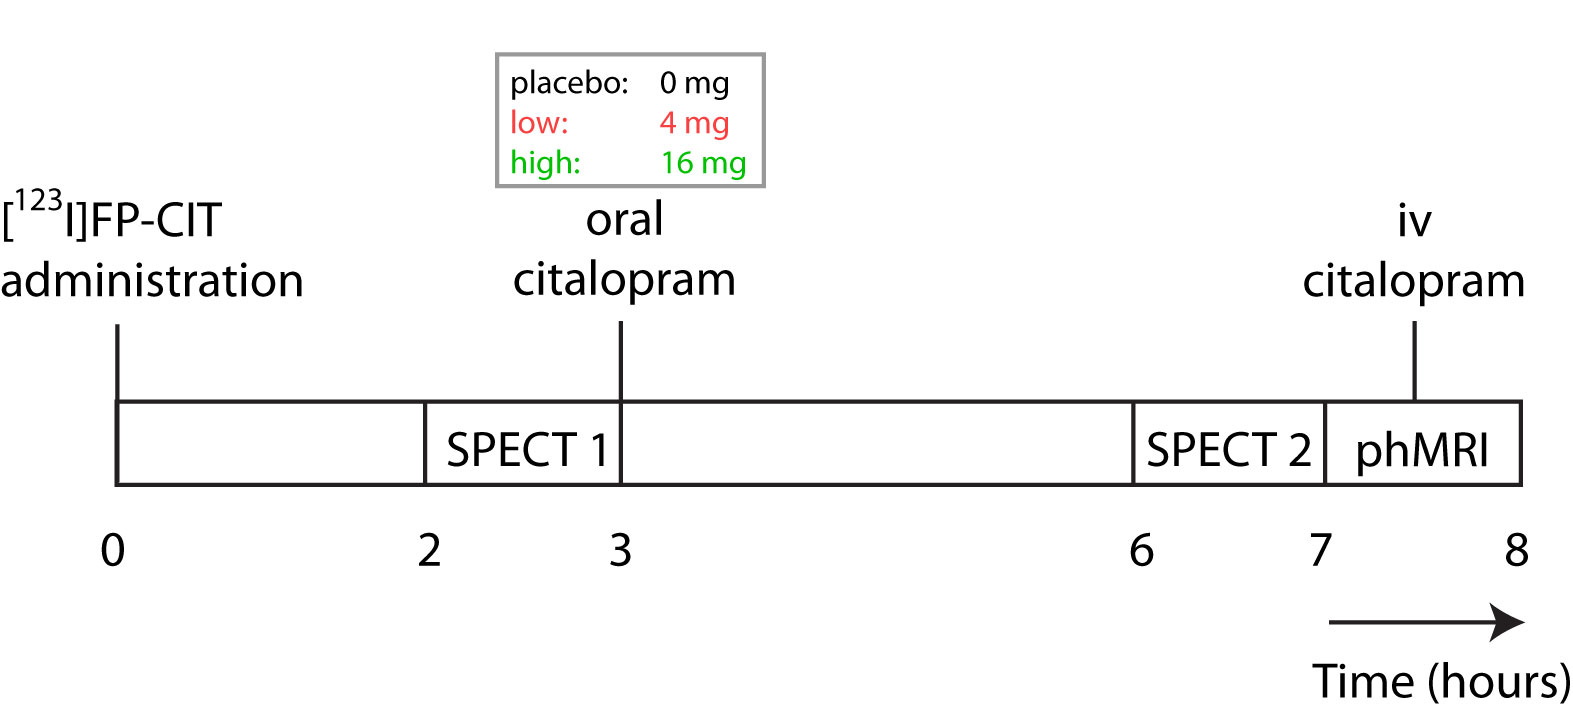
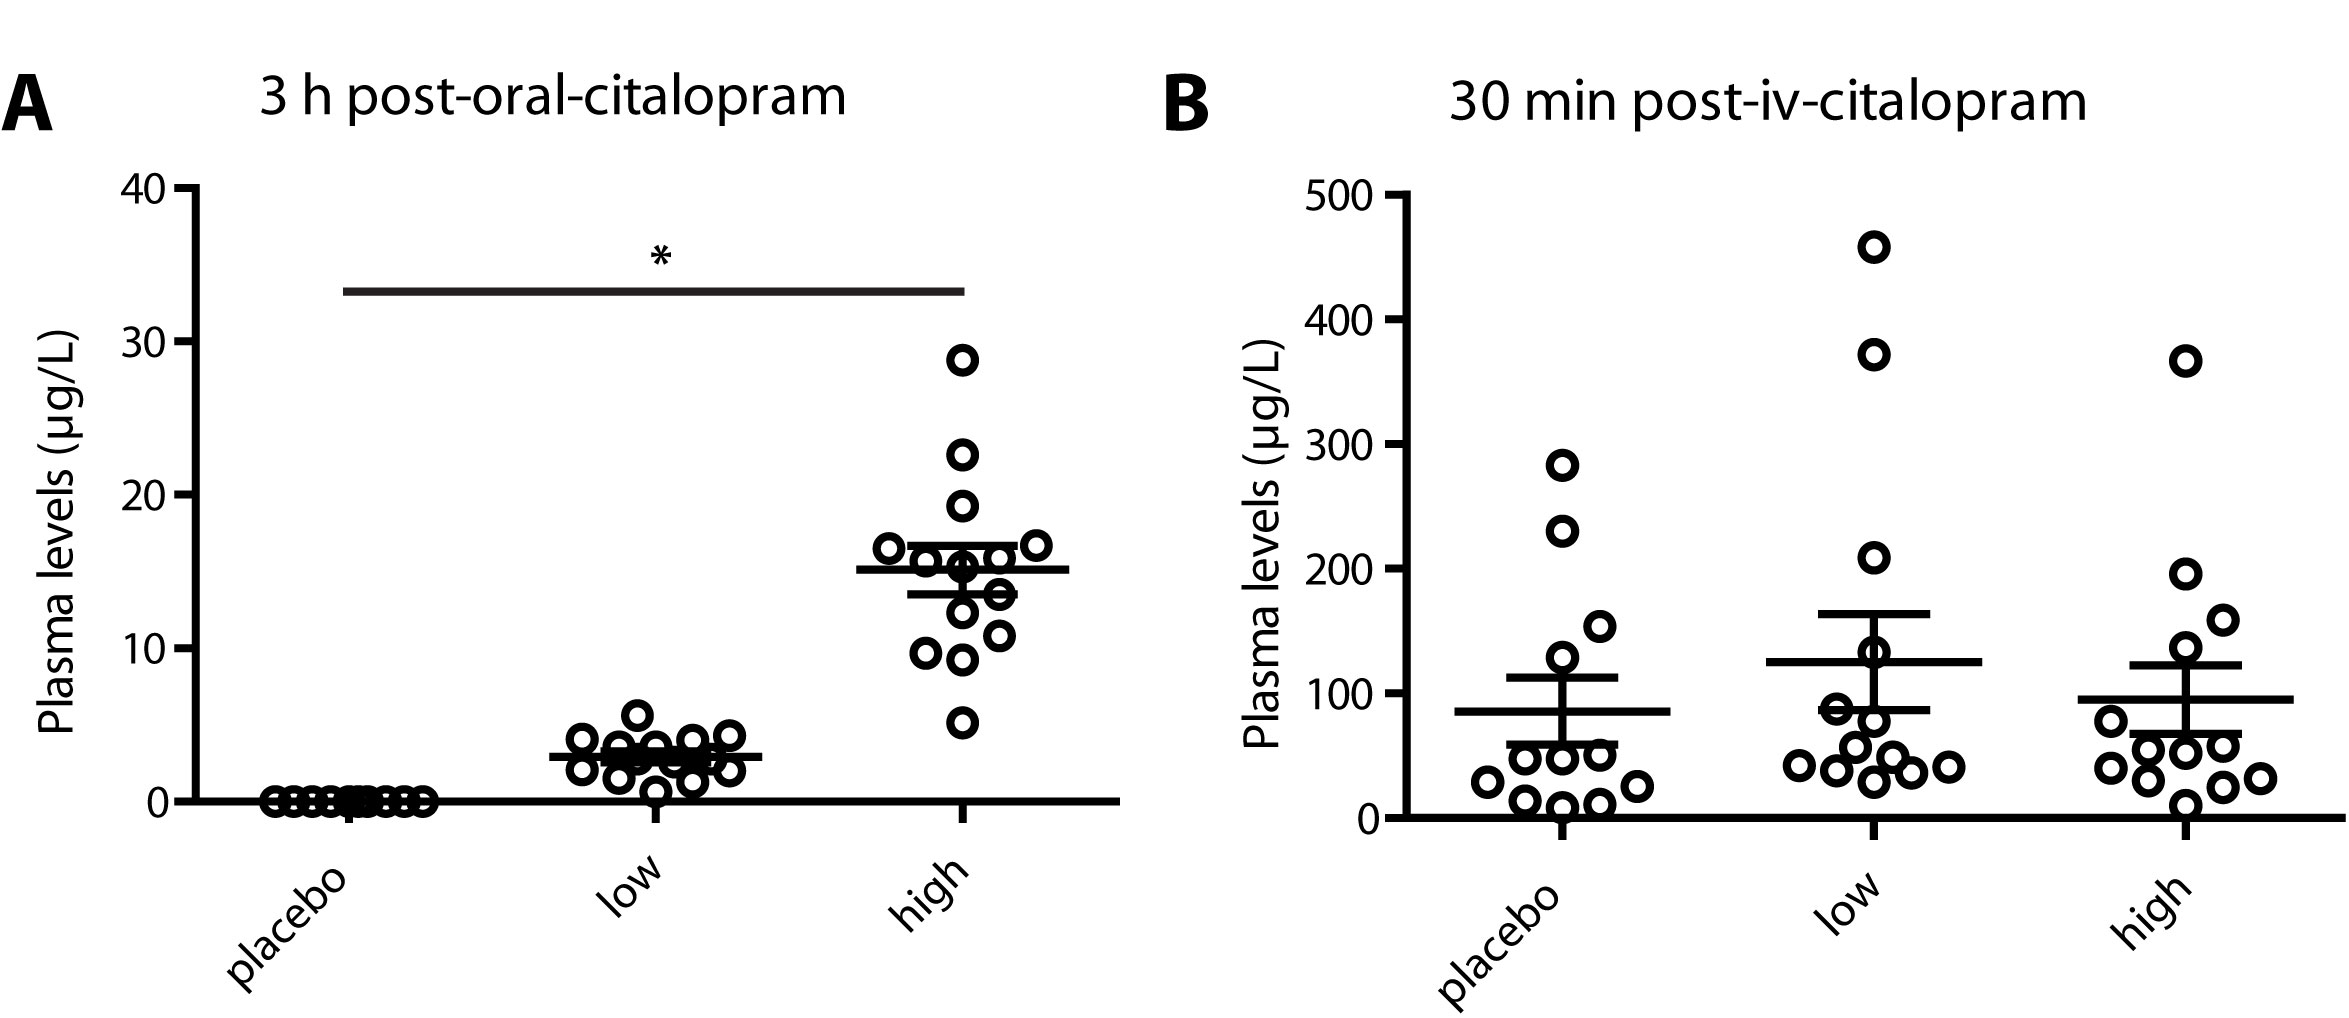
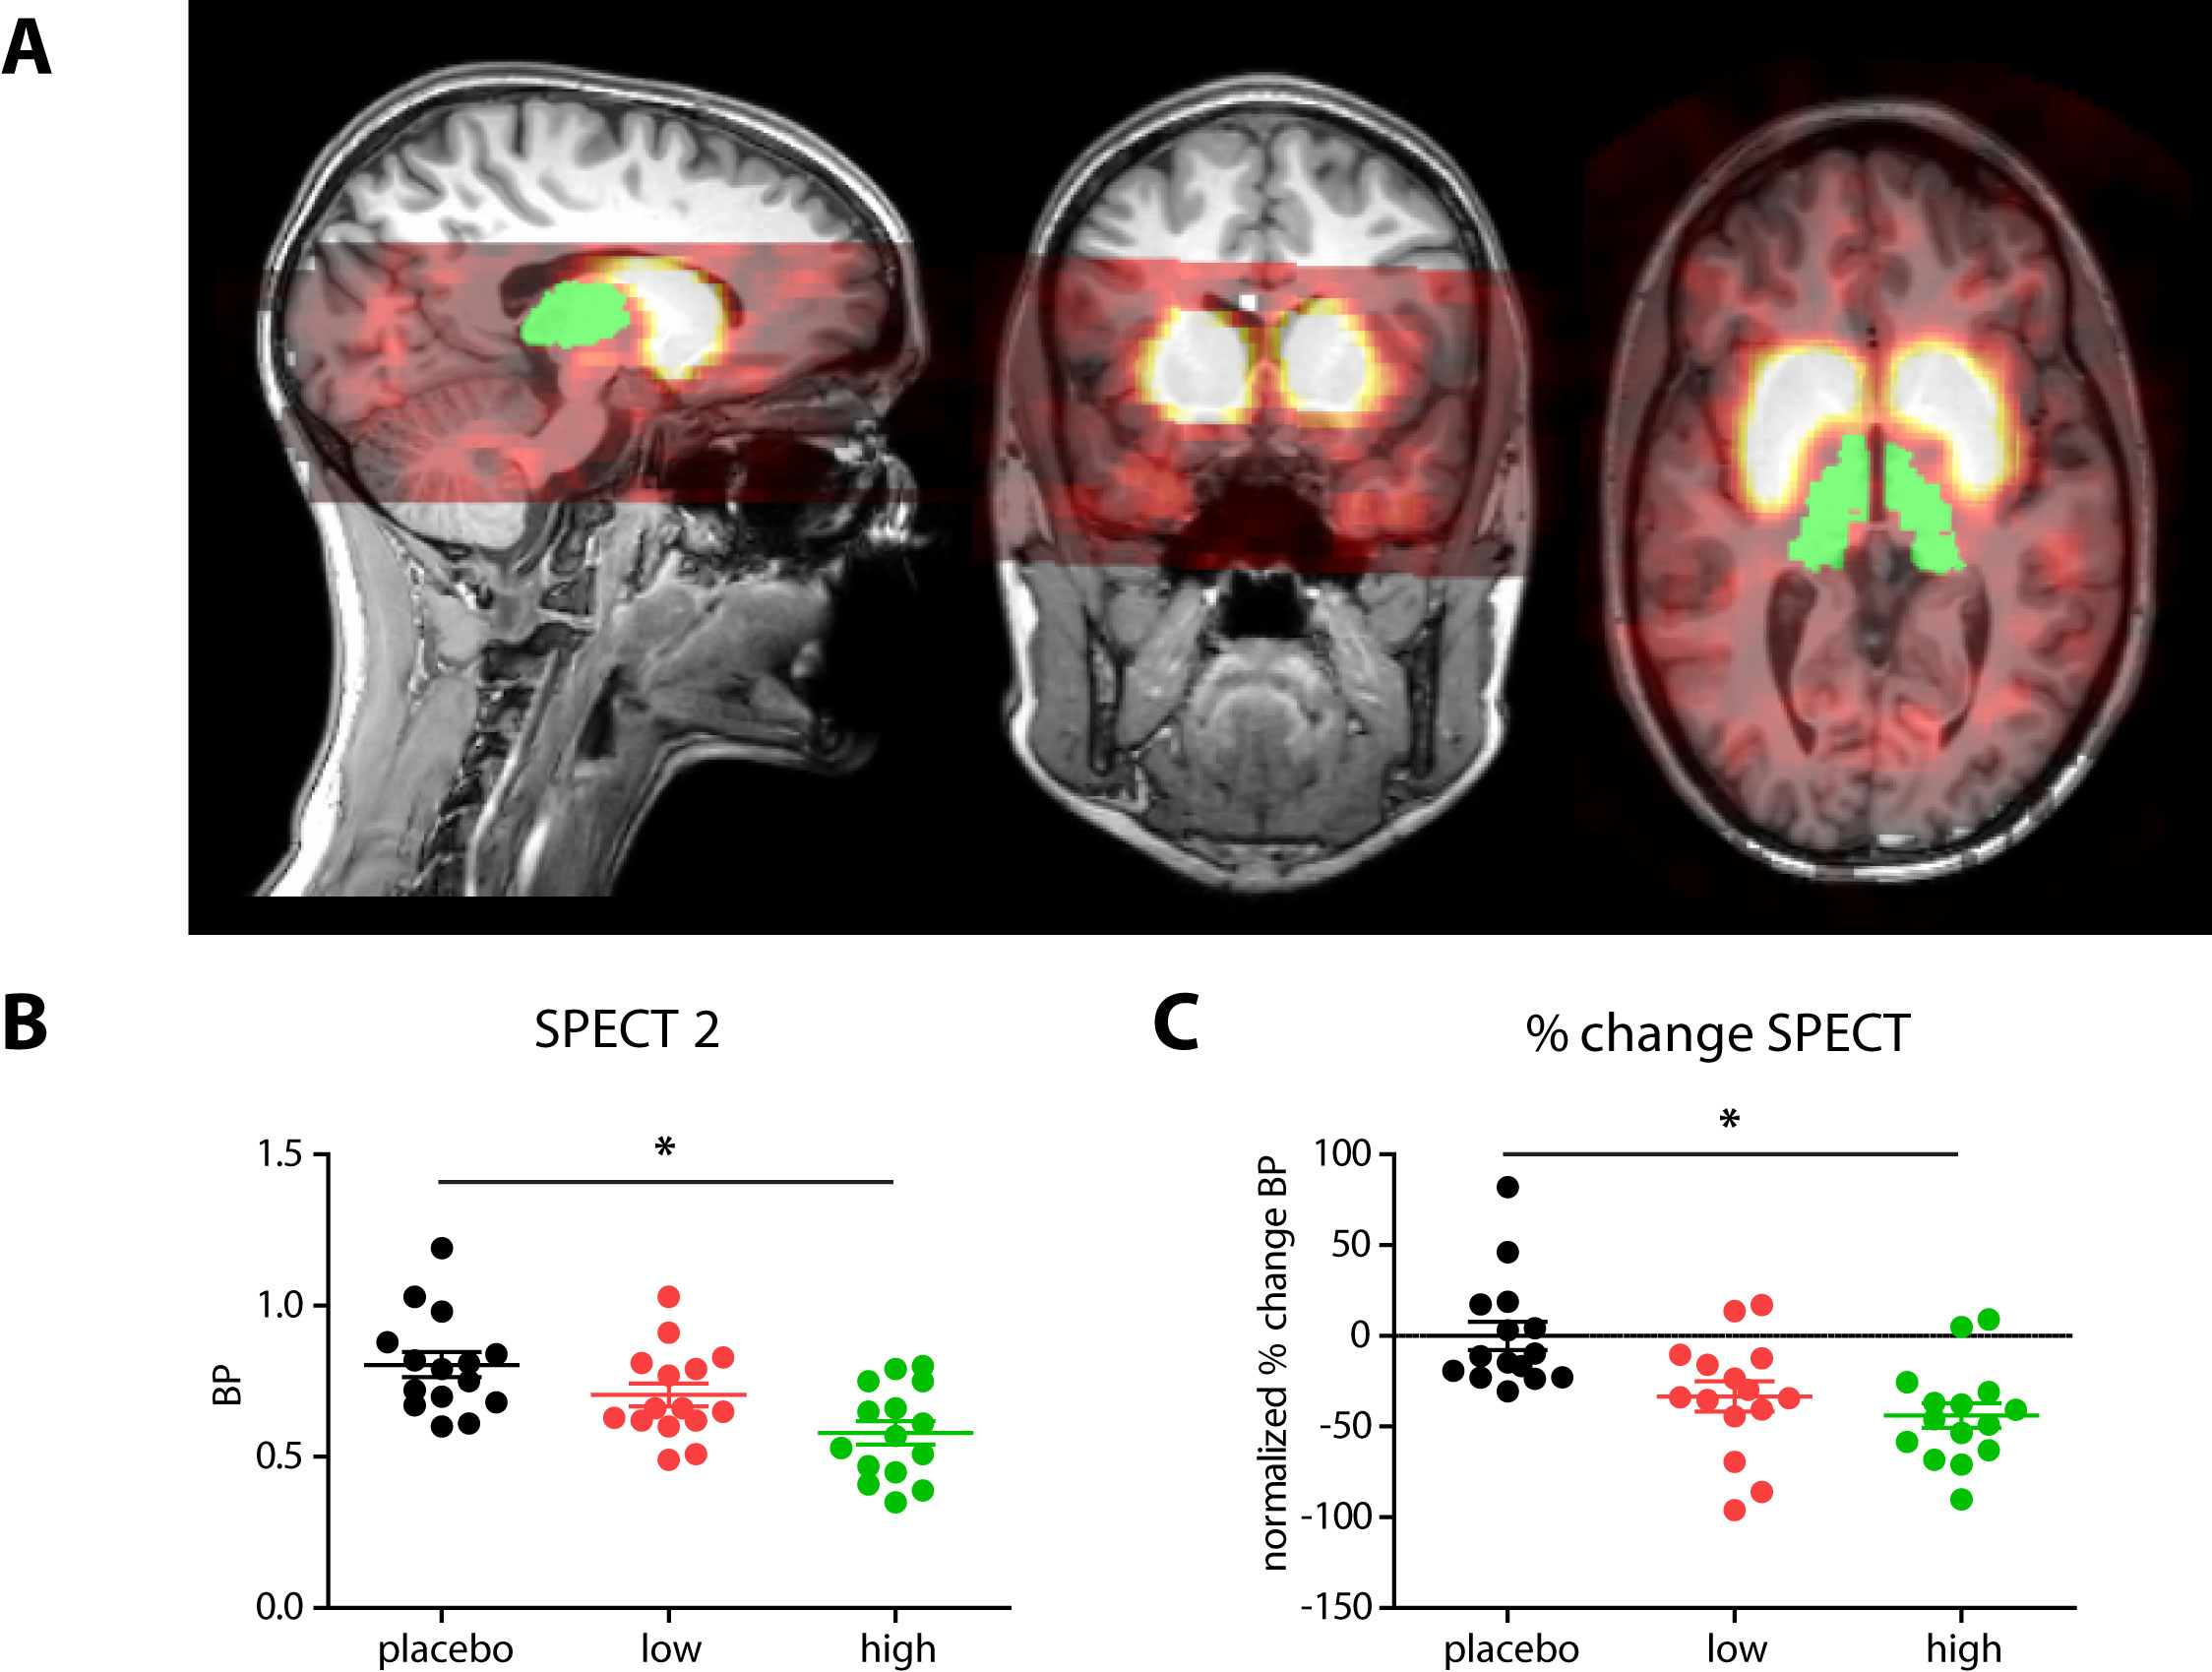
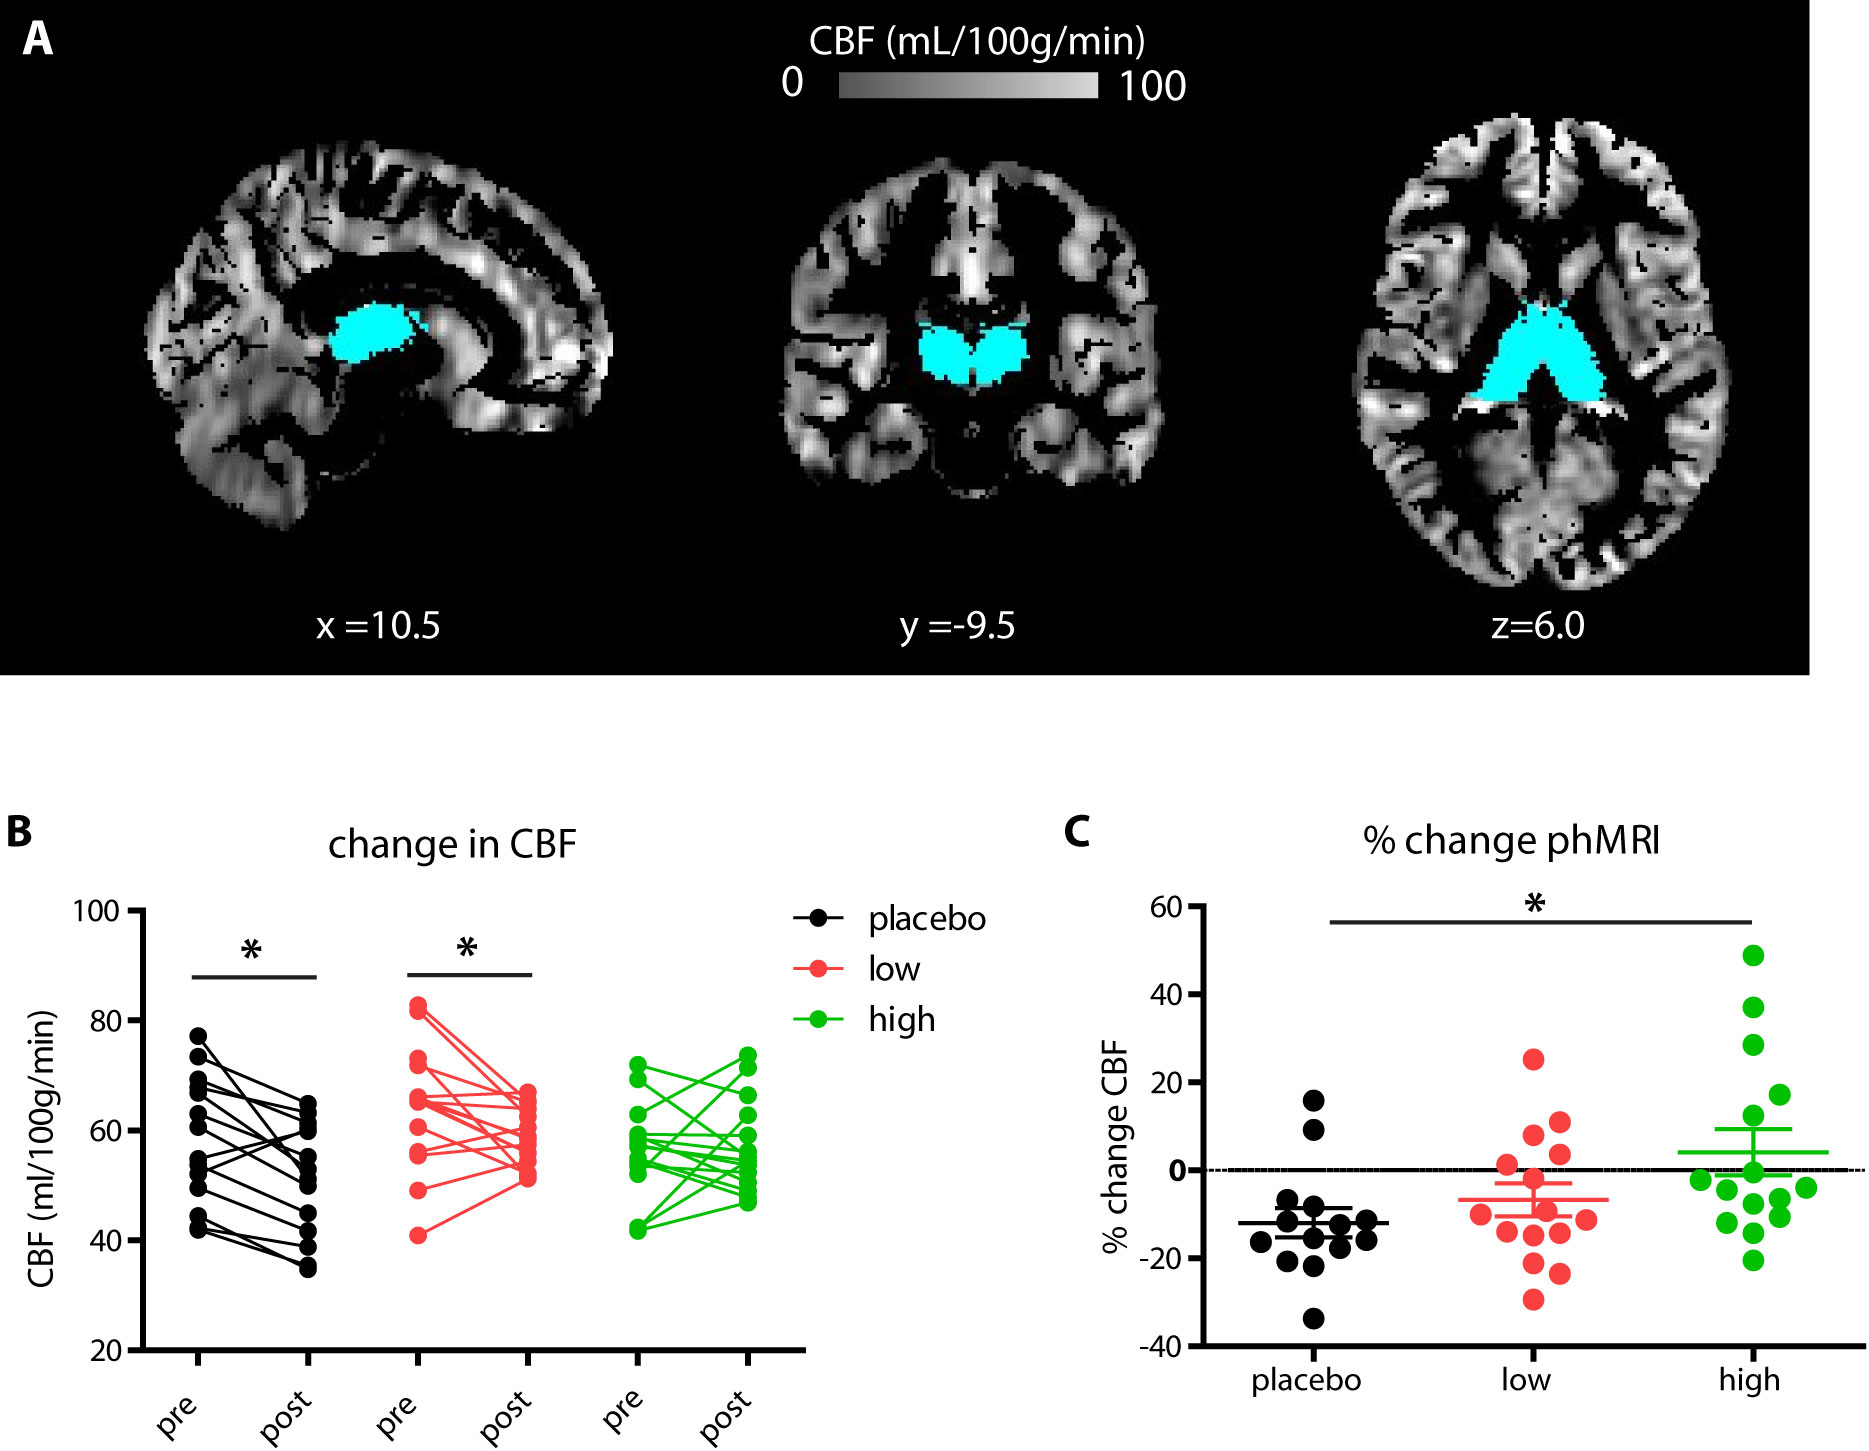
Forty-five healthy female volunteers (mean age=21.6y) participated in a double-blind study investigating SERT occupancy (SPECT) and hemodynamic response (phMRI) to citalopram. Subjects underwent two SPECT scans 2 and 6 hours following an intravenous bolus with the radioligand [123I]FP-CIT which binds predominantly to the SERT in the thalamus (Figure 1). After SPECT scan 1, volunteers received pre-treatment with placebo, low (4 mg; ‘low group’) or clinically standard (16 mg; ‘high group’ ) oral citalopram dose (corresponding to 0%, ~40% and ~80% SERT occupancy respectively1). After SPECT scan 2, subjects underwent a phMRI scan, during which 7.5mg citalopram was administered intravenously. Blood plasma levels were also measured (Figure 2). SPECT scans were acquired using an InSPira-HD SPECT camera (Neurologica, Boston, USA) with the following parameters: matrix: 121x121; slice thickness: 4mm, acquisition time per slice: 180s. They were reconstructed in 3D mode, attenuation-corrected and spatially smoothed (3mm). SPECT images were coregistered with the individual 3DT1-weighted (T1w) MR image using SPM (Wellcome Trust Centre for Neuroimaging, London, UK) (Figure 3). ROI analysis was performed to determine SERT binding in the thalamus. Thalamic masks were extracted from individual T1w scans using Freesurfer. The cerebellum was used as a reference region to assess non-specific binding. Specific to non-specific binding ratios (binding potential: BPND) were calculated as follows: (mean thalamic binding - mean cerebellum binding/ mean cerebellum binding). Citalopram-induced decrease in BPND (occupancy) was expressed as a percentage of the pre-citalopram BPND. Pseudo-continuous arterial spin labeling (pCASL) data were acquired using a 3.0T Ingenia (Philips, Best, the Netherlands) with a 2D echo-planar imaging readout and the following parameters: TR/TE=4100/14ms; post-label delay=1525ms; label duration=1650ms; FOV=240x240mm; 17 slices, voxel size=3x3x7mm3; no. dynamics=183. In addition, an M0 and high resolution T1w scan were obtained. ASL post-processing was performed with the ExploreASL toolbox7, to obtain pre- and post-citalopram cerebral blood flow (CBF) images (Figure 4). In short, T1w images were segmented into gray matter (pGM) and white matter (pWM) probability maps. Motion was estimated and motion spikes were excluded. Perfusion-weighted images were rigid-body registered to the pGM images. CBF was quantified using a single compartment model8. The pGM and pWM maps were spatially normalized using DARTEL9, and all transformations were combined into a single interpolation to transform the CBF maps to MNI space. Statistical significance was assessed by testing post-citalopram volumes and against baseline using paired t-tests.Results
The oral dosage of citalopram dose-dependently correlated with blood plasma levels of citalopram (Figure 2). As expected, citalopram displaced [123I]FP-CIT binding in the low and high group compared to placebo (Figure 3), resulting in lower thalamic binding. The different occupancy of the SERT by the citalopram did not reduce thalamic CBF during the ASL baseline scan (p=0.09). However, SERT occupancy did affect the phMRI response to intravenous citalopram; whereas the high group did not show a significant decrease in CBF (+4.1% p=0.67), thalamic CBF was reduced in the low group (-6.71% p=0.03) and the placebo group (-11.92% p=0.005). Furthermore, citalopram plasma levels prior to the second SPECT scan correlated with the percent change in thalamic BP (r=-0.32 p=0.047) as well as thalamic CBF (r=0.40 p=0.02). However, percentage change in thalamic BP did not correlate with percentage change in CBF (p=0.11).Discussion and conclusions
In addition to replicating dose-dependent SERT occupancy with SPECT, we additionally demonstrate that phMRI can also detect these differences; higher citalopram plasma levels are associated with lower subsequent changes in the phMRI signal upon an intravenous citalopram challenge. The fact that phMRI signal changes did not correlate with changes in SPECT measurements, suggests that these techniques partially assess different functional aspects of the serotonin synapse. Importantly, phMRI assessment of SERT occupancy allows us to study the effect of serotonergic medication over time in more detail.Acknowledgements
No acknowledgement found.References
1. Klein N, Sacher J, Geiss-Granadia T, et al. (2006). In vivo imaging of serotonin transporter occupancy by means of SPECT and [123I]ADAM in healthy subjects administered different doses of escitalopram or citalopram. Psychopharmacology (Berl): 188(3):263-272.
2. Meyer JH, Wilson AA, Sagrati S, et al. (2004). Serotonin Transporter Occupancy of Five Selective Serotonin Reuptake Inhibitors at Different Doses: An [11C]DASB Positron Emission Tomography Study. Am J Psychiatry: 161(5):826-835.
3. Chen Y, Wan HI, O’Reardon JP, et al. (2011). Quantification of cerebral blood flow as biomarker of drug effect: arterial spin labeling phMRI after a single dose of oral citalopram. Clin Pharmacol Ther. 2011;89(2):251-258.
4. McKie S, Del-Ben C, Elliott R, et al. (2005). Neuronal effects of acute citalopram detected by pharmacoMRI. Psychopharmacology (Berl): 180(4):680-686.
5. Schouw MLJ, Gevers S, Caan MWA, et al. (2012). Mapping serotonergic dysfunction in MDMA (ecstasy) users using pharmacological MRI. European neuropsychopharmacology: 22(8):537-545
6. Windischberger C, Lanzenberger R, Holik A, et al. (2010). Area-specific modulation of neural activation comparing escitalopram and citalopram revealed by pharmaco-fMRI: A randomized cross-over study. Neuroimage: 49(2):1161-1170.
7. Mutsaerts HJ, Thomas DL, Petr J, et al. (2016). Addressing multi-centre image registration of 3T arterial spin labeling images from the GENetic Frontotemporal dementia Initiative (GENFI). In: International Society for Magnetic Resonance in Medicine.
8. Alsop DC, Detre JA, Golay X, et al. (2014). Recommended implementation of arterial spin-labeled perfusion MRI for clinical applications: A consensus of the ISMRM perfusion study group and the European consortium for ASL in dementia. Magn Reson Med: 73(1):102-116.
9. Ashburner J. (2007). A fast diffeomorphic image registration algorithm. Neuroimage: 38(1):95-113.
Figures