0506
Structural brain changes after Electroconvulsive therapy are broadly distributed.1Center for Multimodal Imaging and Genetics, University of California San Diego, San Diego, CA, United States, 2Department of Clinical Medicine, University of Bergen, Bergen, Norway, 3Division of Psychiatry, Haukeland University Hospital, Bergen, Norway, 4Department of Radiology, University of California San Diego, CA, United States
Synopsis
Major depression is the leading cause of disability in the world. Electroconvulsive therapy (ECT) which is used in major depression when other treatments are ineffective, has been shown to cause increased volume of multiple specific subcortical and cortical regions. A sample of 19 patients with T1-weighted 3D volumes acquired before and after ECT was analyzed by using nonlinear registration and unbiased methods for quantification of regional anatomical change (Quarc). The effect sizes of ECT-induced brain changes are large, and the changes are more broadly distributed than previously thought. The results suggest a global effect, probably modulated by the stimulation parameters.
Target audience
Scientists/clinicians interested in accurate techniques for quantification and visualization of structural brain changes, electroconvulsive therapy and neuroplasticity.Purpose
Major depression, a disorder that leads to profound personal suffering as well as increased risk for suicide, is currently the world’s primary cause of disability. Electroconvulsive therapy (ECT) is regarded as the most effective acute treatment of the disorder and thus should be ideally suited to investigate the mechanisms of treatment response. Recent neuroimaging investigations have suggested specific volumetric increase of the hippocampi, amygdalae1-3 and the striatum4 as well as regional increase in cortical thickness5-6 after ECT. Neurogenesis, which is known to occur in adult humans7 has been shown to increase in animal models of ECT8, and neuroplasticity has been put forward as a framework for understanding depression and treatment mechanisms9. We have earlier showed that by applying distortion correction and rigorous image co-registration it was possible to quantify ECT induced structural changes at the level of the individual patient and identified significant volume increases of subcortical gray matter in a sample of only 6 patients10. Here we extend our analysis to look at the entire brain in a larger sample.
Methods
Nineteen patients (age: 48.0 ± 16.6, 63 % female) receiving a series of right unilateral brief-pulse ECT for a major depressive episode were included. Two patients had received ECT > 12 months prior to the inclusion. ECT was applied three times a week (mean number of sessions; 10.7 ± 3.7, mean charge 255.7 mC ± 123.4 mC). Structural T1-weighted isotropic (1 mm) volumes were acquired on a 3T GE Signa HDxt or Discovery MR 750 MR system before the first ECT stimulus and 7-14 days after the treatment series ended. A group of 9 healthy controls (age: 37.4 ± 15.4, 56 % female) were scanned at similar time intervals. Images were corrected for non-linear gradient distortions11 and subjected to automated analysis with FreeSurfer (version 5.3; surfer.nmr.mgh.harvard.edu/), which includes segmentation of subcortical white matter, deep gray matter structures and automated parcellation of the cerebral cortex12-15. Next, nonlinear registration and unbiased quantification of regional anatomical change was done using Quarc16.Results
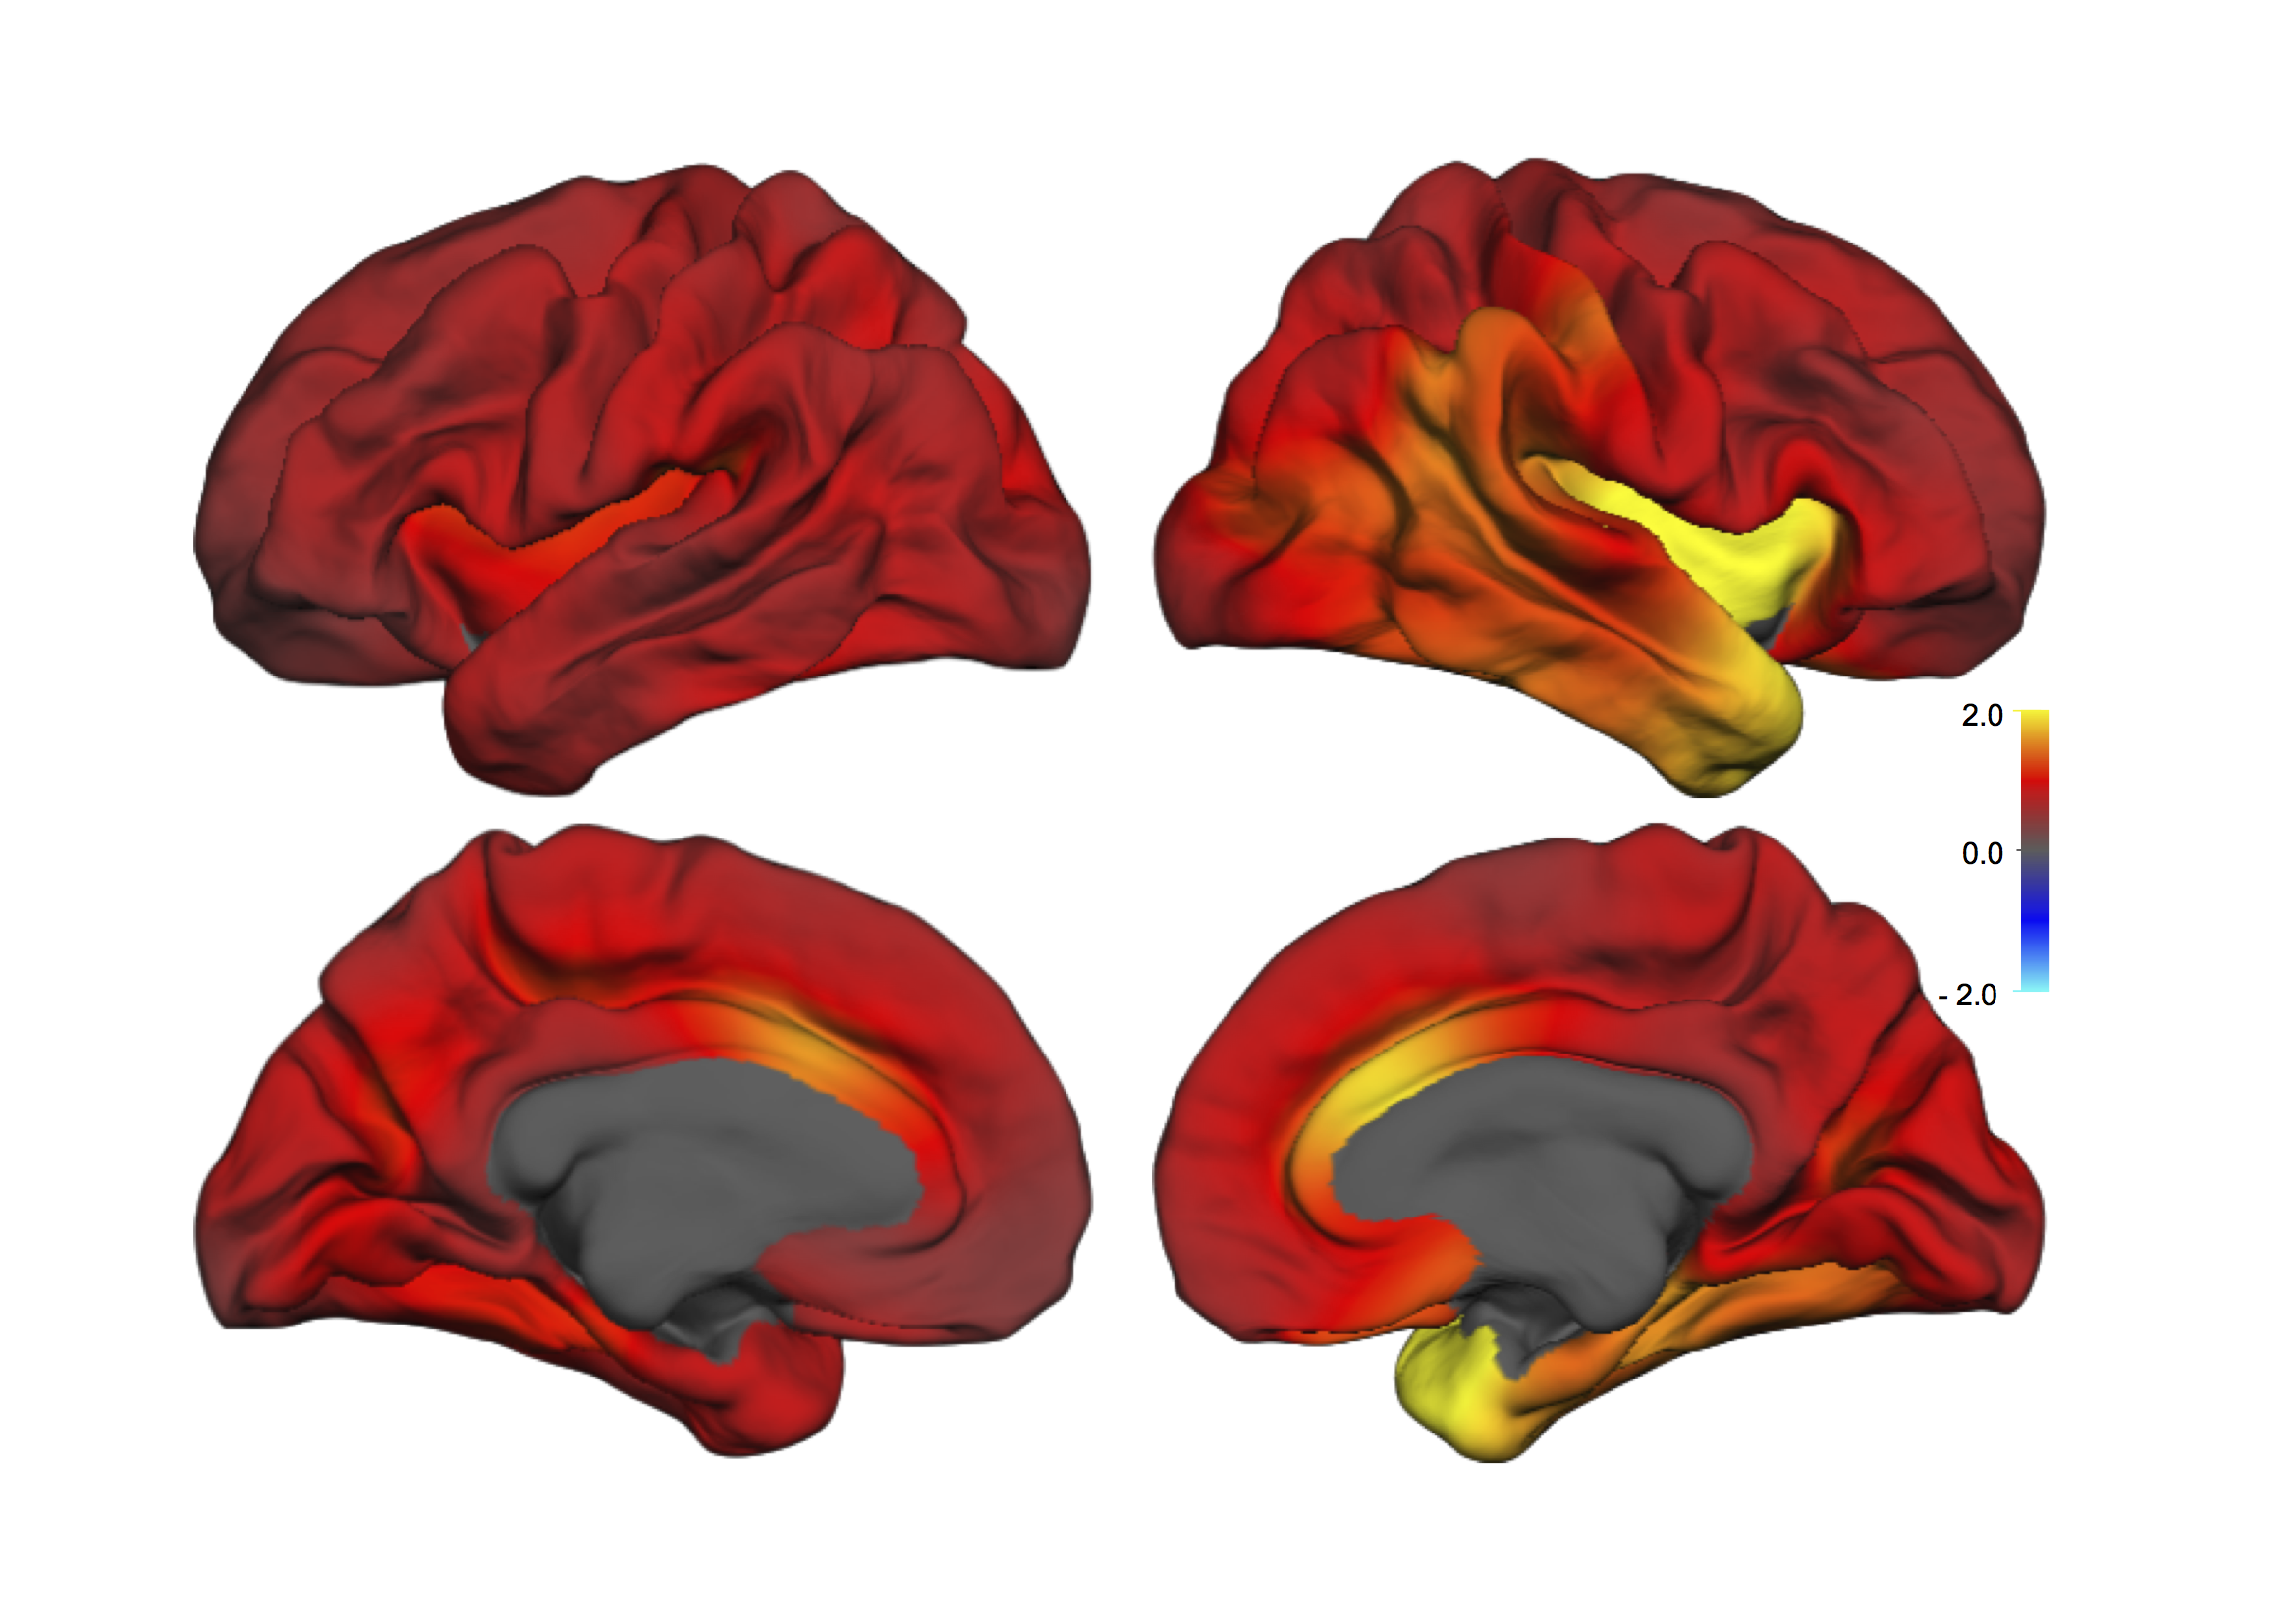
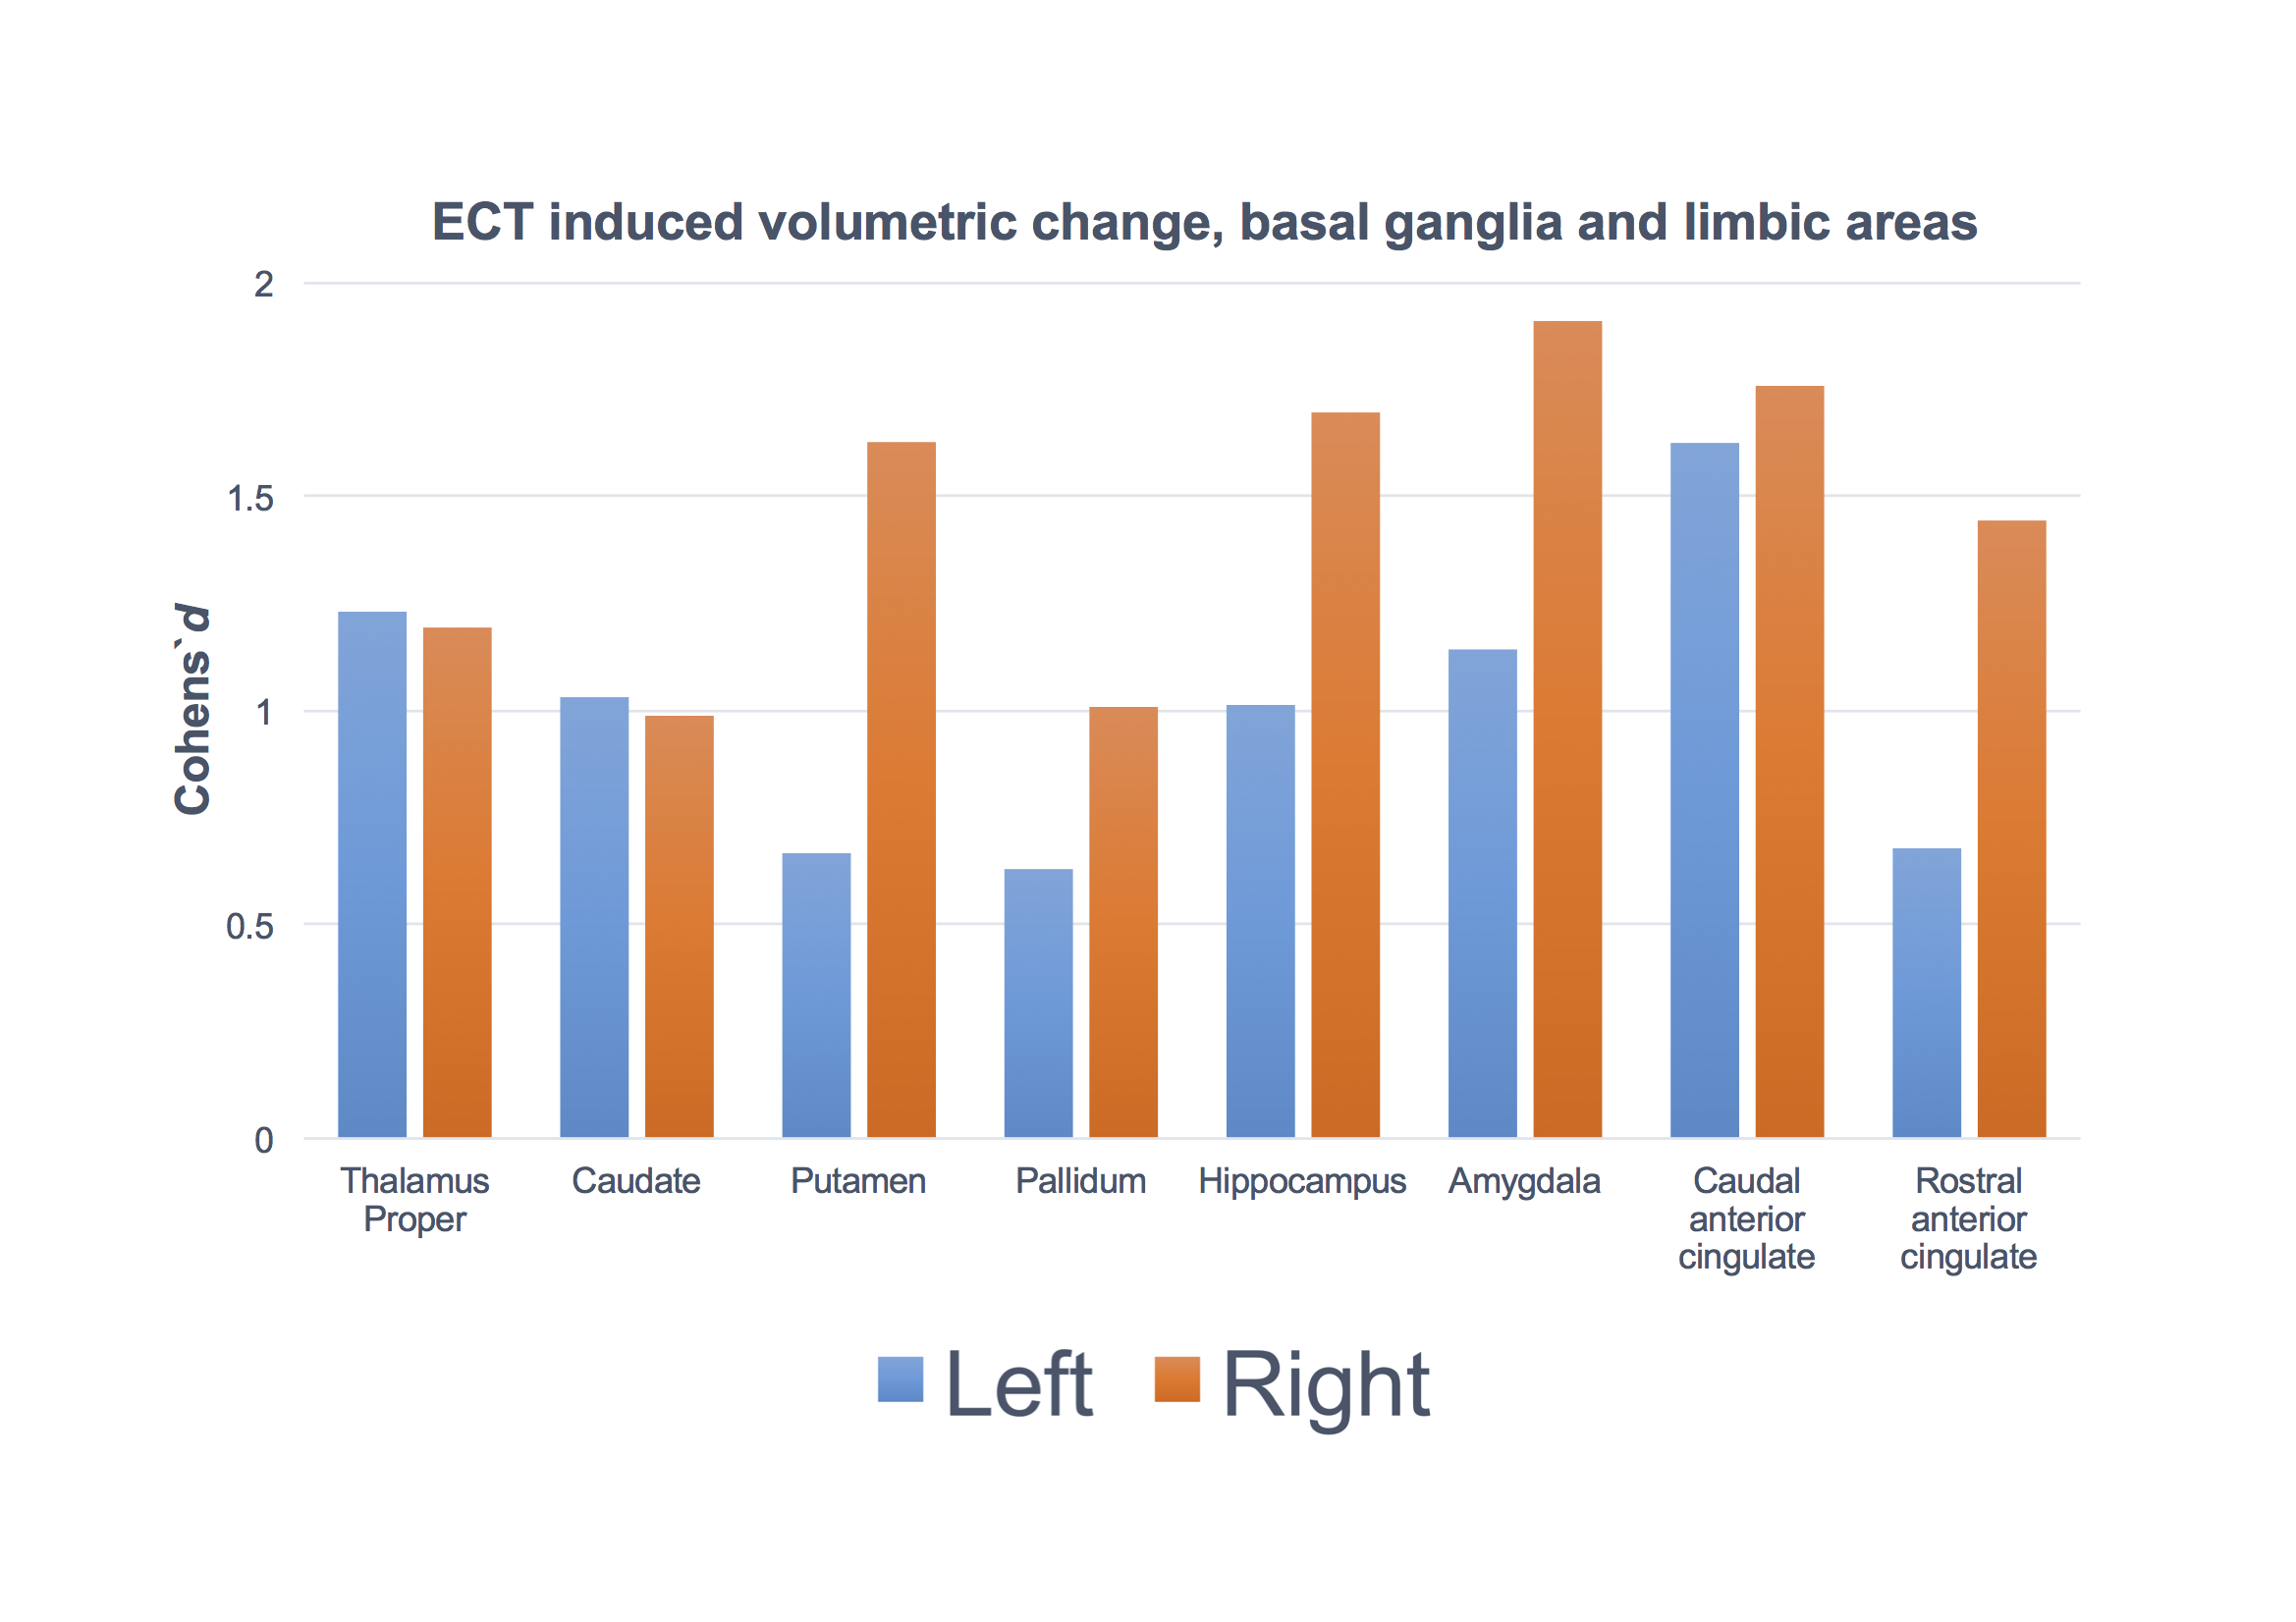
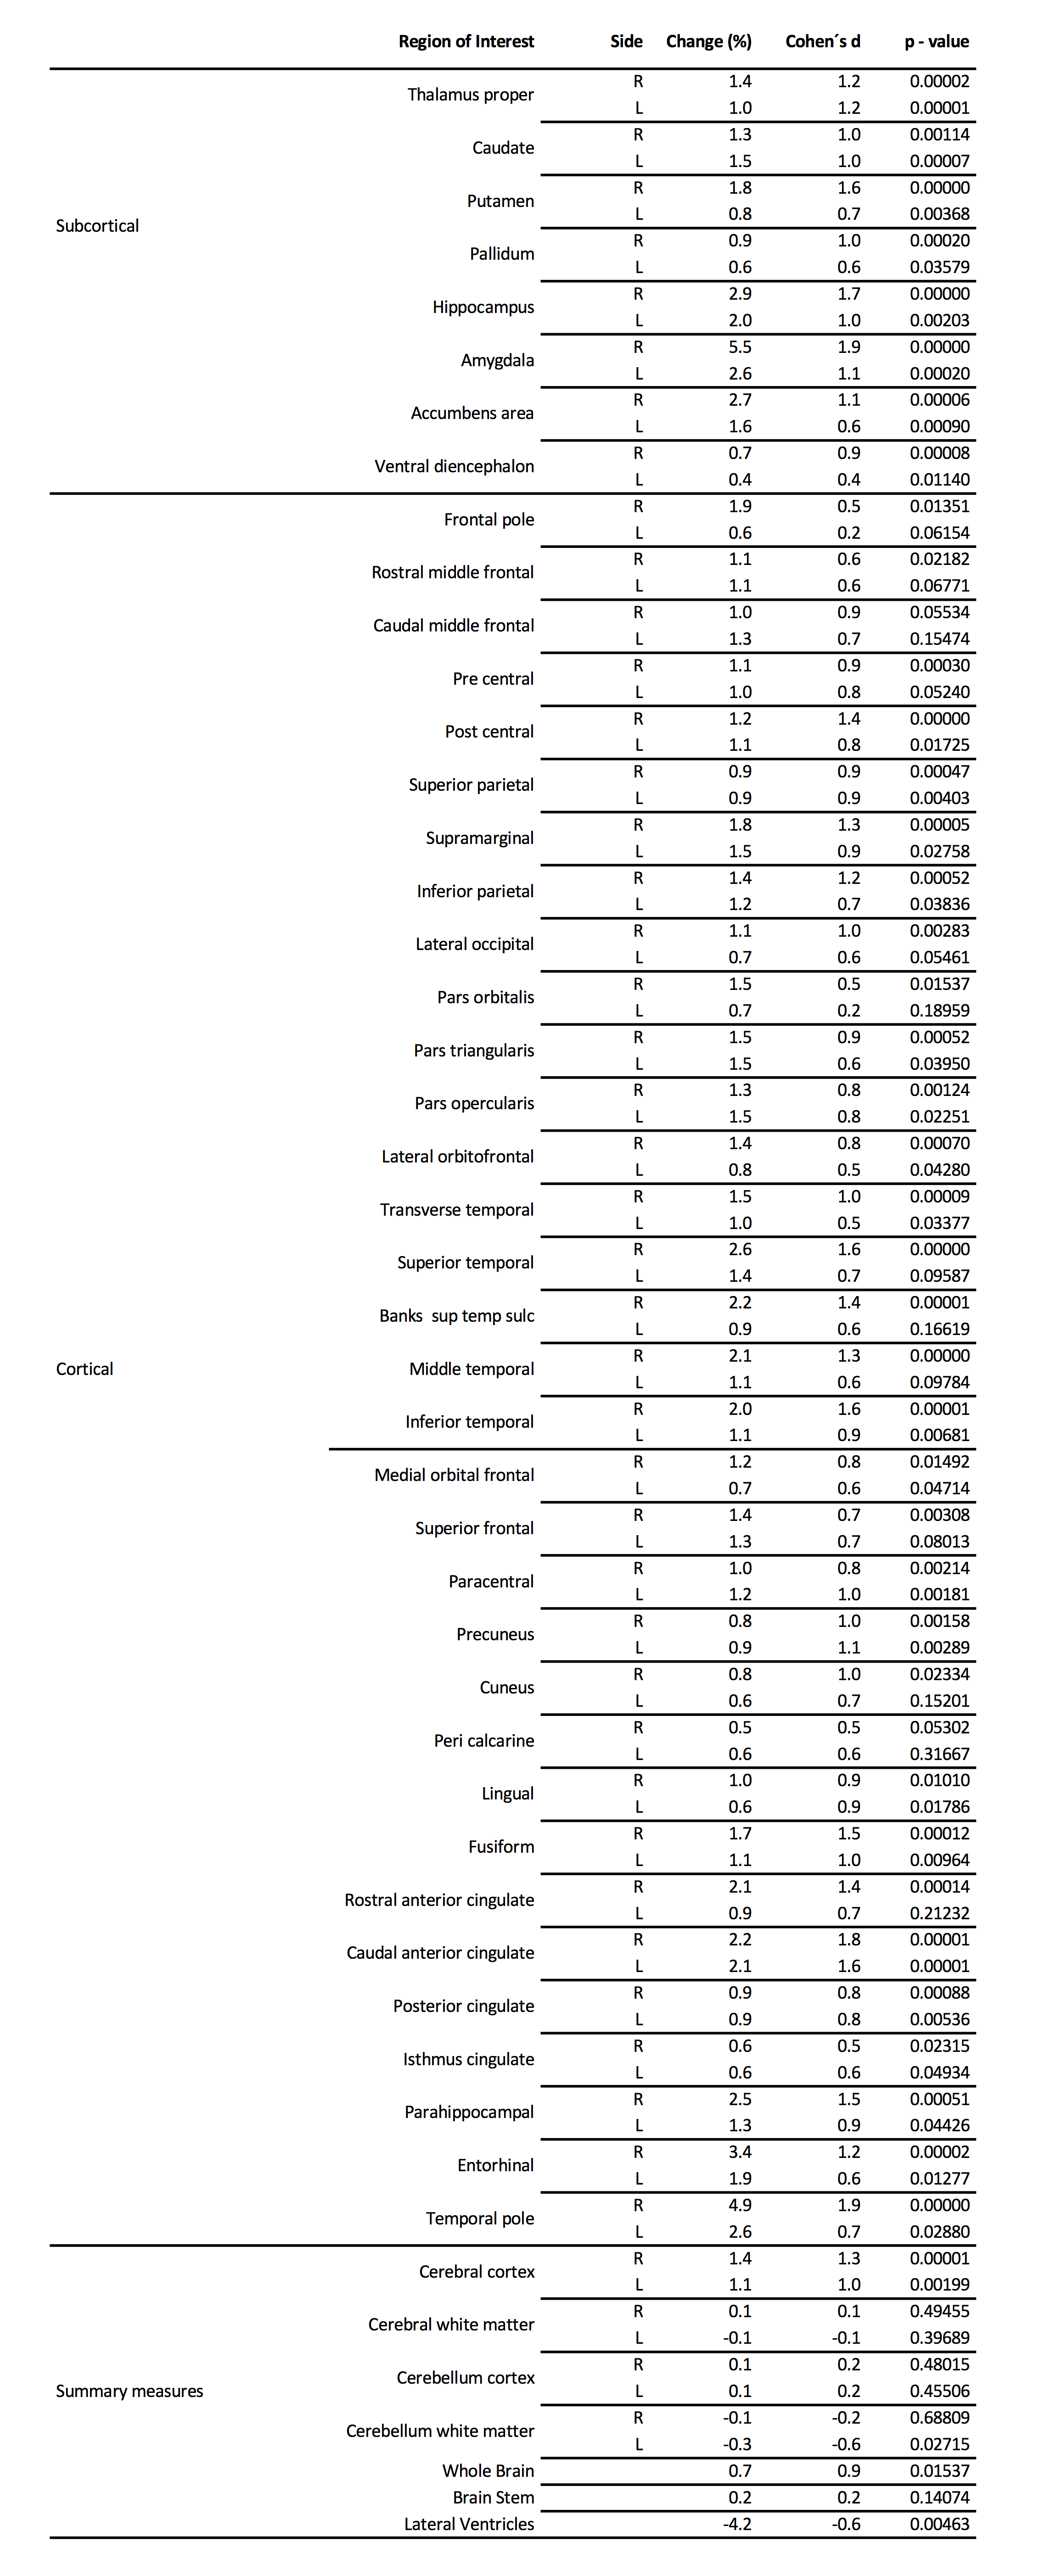
All but one patient improved; mean MADRS (Montgomery and Aasberg depression rating scale) score was 33.7 ± 5.2 before and 14.2 ± 8.3 after treatment. However, 8 of the patients were classified as non-responders (reduction in MADRS score < 50%). Quantification by Quarc showed broadly distributed volume increases in gray matter areas while there was a decrease in volume of CSF spaces such as the lateral ventricles. The Cohen´s d effect size of Quarc estimated regional anatomical change were typically in the range 0.5 – 2, with ~25 of the 102 ROIs showing effect sizes > 1. The pattern of change was broadly distributed throughout the cortex (Figure 1) as well as in the subcortical gray matter (Figure 2). The mean whole brain volume increase was 0.7 % (effect size 0.9; p = 0.03). The larger effect sizes were lateralized to the side of the ECT stimulus (all patients received right unilateral ECT); e.g. the volume change of the left and right temporal pole was 2.6 (p<0.05) and 4.9 % (p < 0.001), respectively (n=19) compared to healthy controls (n=9). The areas that changed most were the right temporal pole, hippocampus, amygdala, insula region and caudal anterior cingulate (Table 1).
Discussion
Structural brain changes after ECT are more broadly distributed than previously thought. Specific hypotheses have led researchers to target a limited number or regions of interest that may have precluded the identification of a more global effect. Change patterns were lateralized to the side of the stimulus, suggesting that the stimulus in itself is an important factor mediating the regional change, although regionalized distribution of seizure activity may be an alternative interpretation. Interestingly, the regions showing the highest change are part of limbic circuitry, important for emotion processing.Conclusion
Volumetric brain changes after ECT are more broadly distributed than previously thought. Changes throughout cortex are approximately uniform at ~1%, with larger changes ~3-5% close to the stimulating electrodes and confined to gray matter. This has profound implications for theories that aim at explaining the therapeutic mechanisms of ECT, and suggests other physiological processes than purely neuroplastic changes.
Acknowledgements
No acknowledgement found.References
1. Nordanskog P, Dahlstrand U, Larsson MR, et al. Increase in hippocampal volume after electroconvulsive therapy in patients with depression: a volumetric magnetic resonance imaging study. J ECT. 2010;26(1):62-67.
2. Tendolkar I, van Beek M, van Oostrom I, et al. Electroconvulsive therapy increases hippocampal and amygdala volume in therapy refractory depression: a longitudinal pilot study. Psychiatry Res. 2013;214(3):197-203.
3. Joshi S H, Espinoza R T, Pirnia T, et al. Structural Plasticity of the Hippocampus and Amygdala Induced by Electroconvulsive Therapy in Major Depression. Biol Psychiatry. 2016;79:282-292.
4. Wade B S, Joshi S H, Njau S, et al. Effect of Electroconvulsive Therapy on Striatal Morphometry in Major Depressive Disorder. Neuropsychopharmacology. 2016;10:2481-91.
5. van Eijndhoven P, Mulders P, Kwekkeboom L, et al. Bilateral ECT induces bilateral increases in regional cortical thickness. Transl Psychiatry 2016;6(8):e874.
6. Pirnia T, Joshi SH, Leaver AM, et al. Electroconvulsive therapy and structural neuroplasticity in neocortical, limbic and paralimbic cortex. Transl Psychiatry 2016;6(6): e832.
7. Eriksson PS, Perfilieva E, Bjork-Eriksson T, et al. Neurogenesis in the adult human hippocampus. Nat Med. 1998;4(11):1313-1317.
8. Segi-Nishida E, Warner-Schmidt JL and Duman RS. Electroconvulsive seizure and VEGF increase the proliferation of neural stem-like cells in rat hippocampus. Proc Natl Acad Sci U S A. 2008;105(32):11352-11357.
9. Dukart J, Regen F, Kherif F, et al. Electroconvulsive therapy-induced brain plasticity determines therapeutic outcome in mood disorders. Proc Natl Acad Sci U S A. 2014;111(3):1156-1161.
10. Oltedal L, Kessler U, White S. et al. ISMRM 2015, abstract 705.
11. Jovicich J, Czanner S, Greve D, et al. Reliability in multi-site structural MRI studies: effects of gradient non-linearity correction on phantom and human data. Neuroimage. 2006;30:436-443.
12. Dale AM and Sereno MI. Improved Localizadon of Cortical Activity by Combining EEG and MEG with MRI Cortical Surface Reconstruction: A Linear Approach. J Cogn Neurosci 1993;5(2):162-176.
13. Desikan RS, Segonne F, Fischl B, et al. An automated labeling system for subdividing the human cerebral cortex on MRI scans into gyral based regions of interest. Neuroimage 2006;31(3): 968-980.
14. Fischl B, Salat DH, Busa E, et al. Whole brain segmentation: automated labeling of neuroanatomical structures in the human brain. Neuron 2002;33(3):341-355.
15. Fischl B, van der Kouwe A, Destrieux C, et al. Automatically parcellating the human cerebral cortex. Cereb Cortex 2004;14(1):11-22.
16. Holland D and Dale AM. Nonlinear registration of longitudinal images and measurement of change in regions of interest. Med Image Anal. 2011;15(4):489-497.
Figures