0505
Multimodal MRI biomarker study of substantia nigra damage in idiopathic REM sleep behavior disorder1Neuroradiology department, APHP, Pitié Salpêtrière, Paris, France, 2Centre de NeuroImagerie de Recherche – CENIR, ICM, ICM, Paris, France, 3UPMC Univ Paris 06, UMR S 1127, CNRS UMR 7225, ICM, F-75013, Paris, France, Sorbonne universités, Paris, France, 4Clinical Neurology, Dept. of Neuroscience, University of Genoa, Italy, 5Service des pathologies du Sommeil, Hôpital Pitié-Salpêtrière, APHP, Pitié Salpêtrière, Paris, France, 6Clinique des mouvements anormaux, Département des Maladies du Système Nerveux, APHP, Pitié Salpêtrière, Paris, France
Synopsis
We quantified substantia nigra (SN) damage in idiopathic REM sleep behavior disorder (iRBD) patients using multimodal MRI biomarkers and determined biomarker efficacy. Nineteen patients with iRBD and 18 healthy volunteers underwent 3-Tesla MRI, including diffusion tensor imaging, neuromelanin (NM)-sensitive imaging and T2* mapping. The volume and normalized signal intensity in NM-sensitive images, R2* and diffusion tensor measures were quantified in the SN. Patients with iRBD showed reduced NM-sensitive volume and signal intensity and reduced fractional anisotropy versus controls in the SN. Combination of the three biomarkers had excellent diagnostic accuracy. These measures may represent valuable biomarkers for prodromal Parkinson’s disease.
Purpose
Patients with idiopathic rapid eye movement (REM) sleep behavior disorder (iRBD) display violent behaviors associated with a loss of normal muscle atonia during REM sleep, without daytime motor disorders. Approximately half of the patients with idiopathic REM sleep behaviour disorder (iRBD) will eventually develop Parkinson’s disease (PD), others will develop other forms of Parkinsonism.1 At PD onset, more than 50% of the dopaminergic neurons in the substantia nigra (SN) are already lost.2 Thus, a milder SN damage should be evidenced in iRBD patients with a prodromal stage of PD. In PD, SN damage has been characterized using several MR techniques, including neuromelanin (NM)-sensitive imaging,3-4 iron imaging with R2* increase,5 diffusion tensor imaging (DTI) with fractional anisotropy (FA) decrease6 or mean diffusivity increase or combinations of DTI and iron imaging.7 The aim of the present study was thus to investigate the SN damage in iRBD patients using the above biomarkers to determine whether MRI could show SN damage in iRBD patients, and which biomarkers would be the most appropriate for a preclinical diagnosis of PD.Materials and methods
Subjects: 19 patients with iRBD (mean age: 67.3±8.0 years, 15 males, disease duration: 5.7±3.8 years) were compared with 18 healthy volunteers (HV, age: 65.5±5.1 years, 14 males). Clinical examination included the Unified Parkinson’s Disease Rating Scale (UPDRS III score, Off-score: 2.7±2.4 for patients and 0.7±1.2 for HV).
MRI data acquisition: MRI acquisition was performed using a 3-Tesla TRIO TIM system (Siemens, Erlangen, Germany) using a 12-channel receive-only head coil. The protocol included three-dimensional (3D) T1-weighted (T1-w) images, 3D T2-weighted (T2-w) images, DTI and R2* mapping. NM-sensitive images were acquired using two-dimensional (2D) axial turbo spin echo T1-w images (TR/TE: 900 ms/15 ms, flip angle: 180°, voxel size: 0.4*0.4*3 mm3, 3 averages). The DTI parameters were as following: TR/TE/flip angle =14000 ms/101ms/90°, voxel size = 1.7*1.7*1.7 mm3, b=value 1500 s/mm2, 60 diffusion gradients directions). R2* mapping was computed using a gradient-echo planar sequence with 6 TEs (range, 24 to 94 ms), TR: 9000 ms, flip angle: 90° and voxel size: 2*2*2 mm3.
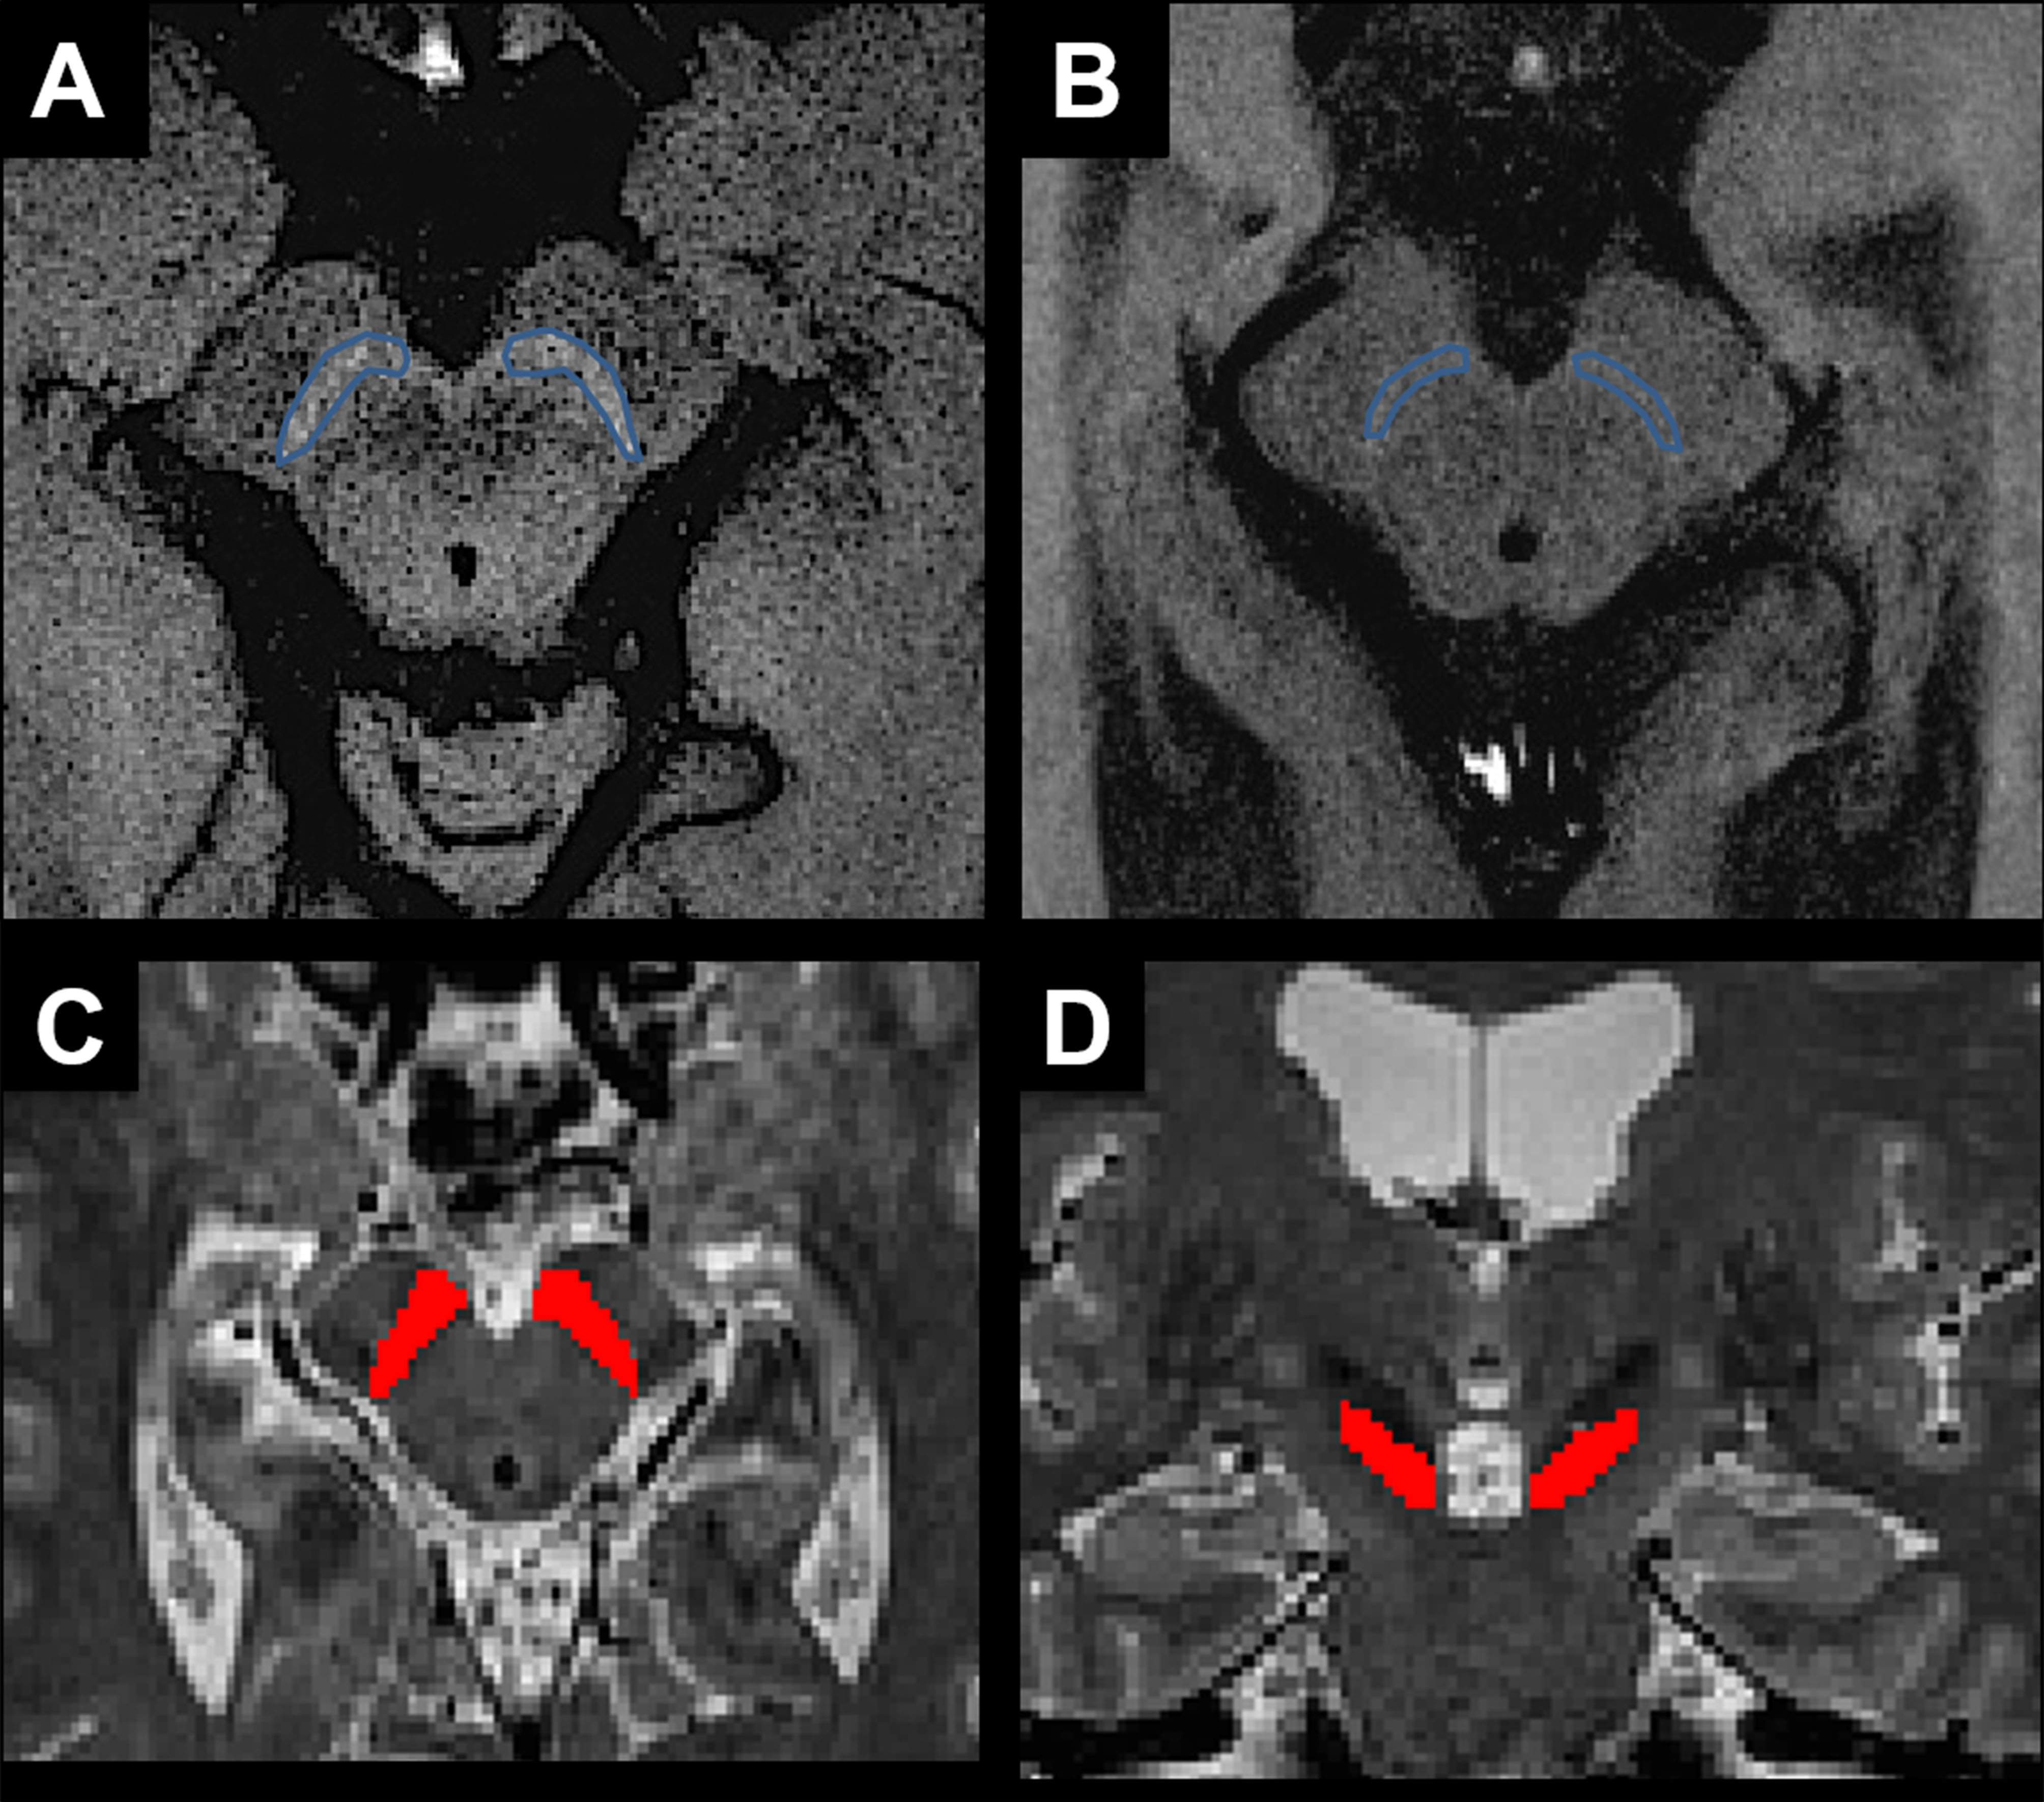
Image analysis: Image processing and analysis were performed using in-house software written in MATLAB and ROI were segmented using Freesurfer (http://freesurfer.net/, MGH, Boston, MA, USA). The regions of interest in the SN area were drawn manually in NM and T2 images by using FreeSurfer software (Figure 1). Volume and normalized signal intensity in NM-sensitive images, R2*, fractional anisotropy (FA), axial (AD), radial (RD) and mean diffusivities (MD) were calculated in the SN. Additionally, two raters performed visual analysis of SN signal intensity using the NM-sensitive images.
Statistical analysis: Measures were compared using Kruskal Wallis test and evaluated for diagnosis accuracy using ROC analysis.
Results
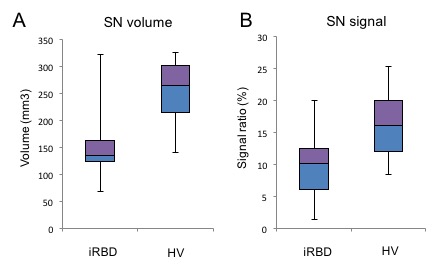
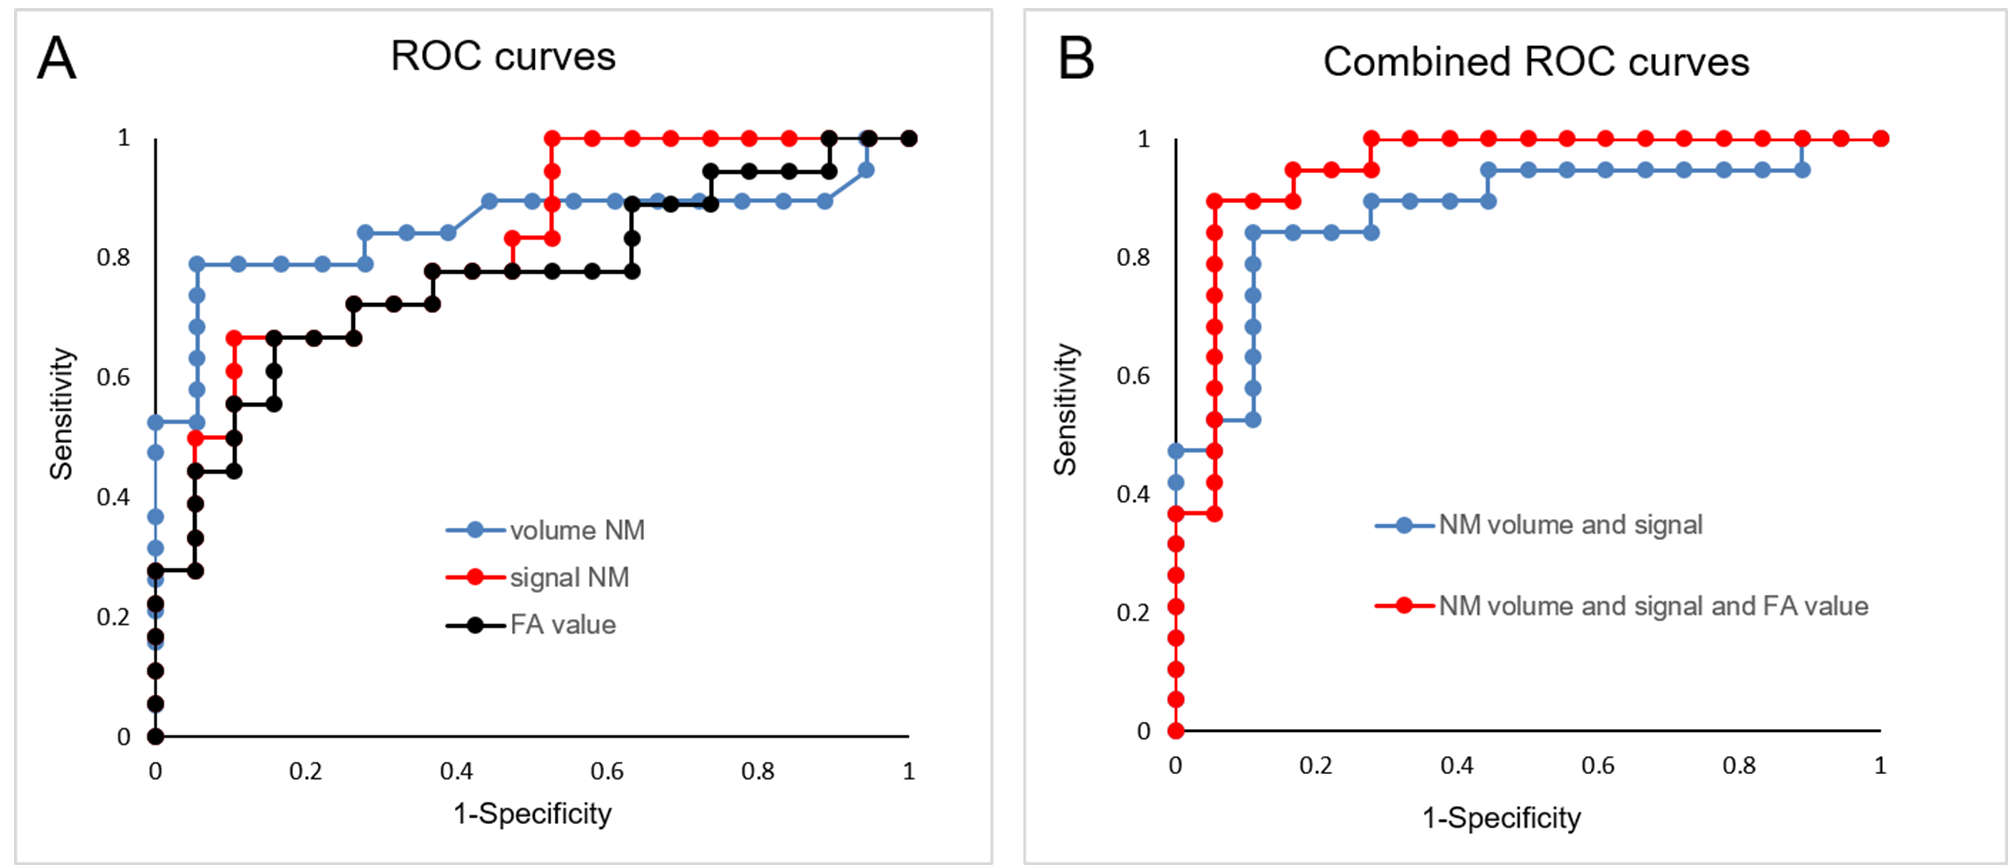
Patients with iRBD showed a reduction in the NM-sensitive volume (p=0.0003) and signal intensity (p=0.005) (Figure 2) and a decrease in FA (p=0.006) versus controls but showed no differences in AD (p=0.5), RD (p=0.38) or MD (p=0.87) or in R2*. For NM-sensitive volume and signal intensity, the ROC analysis discriminated between iRBD patients and HV with a diagnostic accuracy of 0.86 and 0.79, respectively, whereas the accuracy was 0.77 for FA. The three biomarkers had a combined accuracy of 0.92 (Figure 3). Visual assessment correctly characterized 81% of the subjects.
Clinical correlations. There was a weak correlation between the FA in the left SN and the disease duration (p=0.012, r=-0.4).
Discussion
There were significant decreases in NM-sensitive volume and signal intensity and in FA in the SN of iRBD patients as compared to HV. The combination of these measurements showed good accuracy in differentiating patients and controls. To our knowledge, this is the first study to investigate the loss of NM signals in the SN in iRBD. The SN signal intensity and volume reductions in iRBD were consistent with those observed in early PD, supporting the hypothesis that iRBD is a premotor PD stage. In addition, visual evaluation allowed the correct characterization of two-thirds of patients and nearly all HV, suggesting that visual evaluation of NM images has value in routine clinical screenings.Conclusion
The SN damage in iRBD was observed using NM-sensitive imaging and FA. The combination of NM-sensitive volume and signal intensity with the FA measurements showed excellent diagnostic accuracy, allowing the detection of SN damage in a large fraction of iRBD patients and suggesting that these measurements might be valuable biomarkers for prodromal PD.Acknowledgements
This work was supported by grants from NRJ-Institut de France, FRC (Neurodon): Fédération pour la Recherche sur le Cerveau, the Investissements d'Avenir, IAIHU-06 (Paris Institute of Neurosciences – IHU), ANR-11-INBS-0006 and the Fondation d’Entreprise EDF.References
1. Iranzo A, Molinuevo JL, Santamaría J, et al. Rapid-eye-movement sleep behaviour disorder as an early marker for a neurodegenerative disorder: a descriptive study. Lancet Neurol. 2006;5:572–577.
2. Bernheimer H, Birkmayer W, Hornykiewicz O, Jellinger K, Seitelberger F. Brain dopamine and the syndromes of Parkinson and Huntington. Clinical, morphological and neurochemical correlations. J Neurol Sci. 1973;20:415–455.
3. Kashihara K, Shinya T, Higaki F. Neuromelanin magnetic resonance imaging of nigral volume loss in patients with Parkinson’s disease. J Clin Neurosci. 2011;18:1093–1096.
4. Castellanos G, Fernández-Seara MA, Lorenzo-Betancor O, et al. Automated neuromelanin imaging as a diagnostic biomarker for Parkinson’s disease. Mov Disord. 2015;30:945–952.
5. Wieler M, Gee M, Martin WRW. Longitudinal midbrain changes in early Parkinson’s disease: iron content estimated from R2*/MRI. Parkinsonism Relat Disord. 2015;21:179–183.
6. Vaillancourt DE, Spraker MB, Prodoehl J, et al. High-resolution diffusion tensor imaging in the substantia nigra of de novo Parkinson disease. Neurology. 2009;72:1378–1384.
7. Péran P, Cherubini A, Assogna F, et al. Magnetic resonance imaging markers of Parkinson’s disease nigrostriatal signature. Brain. 2010;133:3423–3433.
Figures