0503
Multimodal MR investigation of brain and behavioral changes in patients with HIV-infectionsMichael Albert Thomas1, Rajakumar Nagarajan2, Eric S Daar3, Santosh K Yadav4, Charles H Hinkin5, Manoj K Sarma6, Zohaib Iqbal1, Sathya Arumugam1, Mario Guerrero 3, Mohammad Haris4, and Ebrahim Haroon7
1Radiological Sciences, UCLA Geffen School of Medicne, los angeles, CA, United States, 2Radiological Science, UCLA Geffen School of Medicine, los angeles, CA, United States, 3Medicine, Harbor-UCLA Medical Center, Torrance, CA, United States, 4Research Branch, Sidra Medical and Research center, Doha, Qatar, 5Psychiatry, UCLA Geffen School of Medicine, Los Angeles, CA, United States, 6Radiological Sciences, UCLA Geffen School of Medicine, Los Angeles, CA, 7Psychiatry, Emory University, Atlanta, GA, United States
Synopsis
Regional brain volumes and cortical thickness using 3D T1-weighted MP-RAGE and neurometabolites quantitated using 5D EP-JRESI MRSI were obtained from a group of HIV+ (n=16) and HIV-subjects (n=15). Compared to HIV- subjects, following findings were observed in HIV+: i) decreases in the volume of right thalamus, mid anterior corpus callosal region and cortex (right, left, combined), and ii) decreases in cortical thickness of superior parietal and inferior temporal regions. The cortical thickness and volumetric changes were predicted by (increased choline, decreased NAA and Glx). Right basal ganglia glutamate/glutamine ratios and HIV+ status together significantly predicted psychomotor slowing during neurocognitive testing.
Purpose
More than 1.1 million people with HIV infection are living in the United States1. Persistent and sometimes progressive neurological dysfunction may stem from chronic, non-resolving host responses, including persisting immune activation despite adequate viral suppression. There remains a need to develop and refine new-generation technologies that can help track the progress in underlying pathophysiology. MR imaging techniques including MRI and MR spectroscopy facilitate non-invasive anatomical and biochemical characterization2-4. A major goal of this work was to determine the relationship between multiple neuroimaging parameters (3D T1-weighted MP-RAGE and 5D EP-JRESI) and other markers of disease such as HIV disease severity, immune activation and neurocognitive function. HIV disease severity parameters have been described in a companion abstract and this will primarily focus on the association between MRS and structural MR findings.Methods
Sixteen HIV+ subjects (43.5±9.4 years) and 15 age-matched healthy subjects (46.3±9.7 years) were recruited between January 2015 until July 2016. All subjects signed the consent form approved by the institutional review board before participating in the study. A 3T Skyra MRI scanner and a 16-channel head ‘receive’ coil were used. The neuroimaging sequences included the following: 1) 3D MP-RAGE: TR/TE = 2300 ms/2.98 ms; average =1, FOV =256, T=900ms, flip angle =90, matrix = 256x256, slices =176, bandwidth (BW) =240Hz. 2) accelerated 5D echo-planar-J-resolved spectroscopic Imaging (EP-JRESI)5: TE/TR = 30/1200 ms, FOV = 24x24x12 cm3, 1.5x1.5x1.5 cm3 resolution, spectral BW (F2/F1)= 1190/1000 Hz, 64 t1 increments, 8x NUS for a scan time ~20 min. 3) Neurocognitive testing were performed by a previously validated mini neuropsychological test battery including attention, psychomotor speed, memory and construction. The FreeSurfer program (version 5.3) was used to quantify cortical and sub-cortical volume changes6-7. The 5D EP-JRESI data was reconstructed as explained recently5.Results
Comparison of regional volume and cortical thickness changes in HIV versus Controls: HIV+ individuals were compared to age and sex matched healthy controls and the results of the analysis is shown in Table 1. HIV+ individuals demonstrated decreases in the volume of right thalamus, mid anterior corpus callosal region and cortex (right, left, combined). HIV+ individuals also showed decreases in cortical thickness parameters involving superior parietal and inferior temporal regions. Association between metabolites and cortical volume and thickness changes: Higher Ch/Cr ratios in the right occipital white matter regions predicted larger right thalamic volumes (Figure 1A), cortical volumes (right, left and bi hemispheric, only left shown Figure 1B); while right basal ganglia Ch/Cr predicted total gray matter volume (Figure 1C) and left basal ganglia NAA/Cr predicted cortical thickness of inferior temporal cortex (Figure 1D). All above associations were seen only in the HIV subjects and not in healthy controls. Association between psychomotor speed and right basal ganglia glutamate: A multiple linear regression analysis showed that right basal ganglia glutamate (RB Glx/Cr) and HIV+ status were the only significant predictors of psychomotor slowing measured using a mini neurocognitive test battery. In order to measure the combined effect of RB Glx/Cr and HIV+ status a mixed model analysis was performed to test the combined effects HIV+ status*RB Glx/Cr. The HIV+Status*RB Glx/Cr interaction term was significantly associated with decreases in psychomotor speed [F(1,4)=5.714, p=0.009]. Figure 2 shows the parameter estimates with 95% of combined effect of HIV+*RB Glx/Cr on psychomotor slowing.Discussion
HIV+ patients demonstrated significant volumetric decreases in subcortical (thalamic), white matter (corpus callosum) and cortical (right, left and combined) and decreases in gray matter thickness in superior parietal and inferior temporal cortices. The association of these volumetric and cortical thickness changes with concurrent increases in Ch/Cr and decreases in NAA/Cr resonances indicate increased glial reactivity in the presence of neuronal loss. The cortical thickness and volumetric changes were predicted by metabolic changes in regions known to be connected to the regions-of-interest. Behavioral changes such as loss of psychomotor speed seen among many HIV afflicted individuals are related to a combined impact of HIV+ status and glutamate increases in the basal ganglia.Conclusion
This pilot study demonstrates the association between the volumes of different brain regions and cortical thinning derived from the 3D MP-RAGE analysis, brain chemical changes in multiple locations using the 5D EP-JRESI data and neurocognitive changes reflected through decreased psychomotor speed. These data provide key support to the usefulness of multi-modality MR imaging techniques in assessing brain changes in HIV+ individuals.Acknowledgements
NIH/NINDS grant (1R21NS086449-01A1).References
1) Spudich SS, Ances BM. Neurologic complications of HIV infection. Top Antivir Med. 2012 Jun-Jul;20(2):41 2) Lentz MR, Kim WK, Lee V, et al. Changes in MRS neuronal markers and T-cell phenotypes observed during early HIV infection. Neurology 2009; 72:1465-72 3) Sailasuta N, Ross W, Ananworanich J, Clemchai T, DeGruttola V, Lerdlum S, Pothisri M, Busovaca E, Ratto-Kim S, Jagodzinski L, Spudich S, Michael N, Kim JH, Valcour V RV254/SEARCH 010 protocol teams.Change in brain magnetic resonance spectroscopy after treatment during acute HIV infection. PLoS One2012;7:e49272 4) Young AC, Yiannoutsos CT, Hegde M, Lee E, Petersen J, Walter R, Price RW, Meyerhoff DJ, Spudich S. Cerebral metabolite changes prior to and after antiretroviral therapy in primary HIV infection. Neurology 2014, 83:1592-600.Epub 2014 Sep.26 5) Wilson, et al., Accelerated Five-Dimensional Echo Planar J-Resolved Spectroscopic Imaging: Implementation and Pilot Validation in Human Brain.Magn Reson Med, 2016;75:42-51 6) Yadav SK, Gupta RK, Saraswat VA, Reduced cortical thickness in patients with acute-on-chronic liver failure due to non-alcoholic etiology. J Trans Med 2015;13:322 7) Yadav SK, Kathiresan N, Mohan S, et al. Gender-based analysis of cortical thickness and structural connectivity in Parkinson’s disease. See comment in PubMed Commons belowJ Neurol. 2016 Nov;263(11):2308-2318. Epub 2016 Aug 20Figures
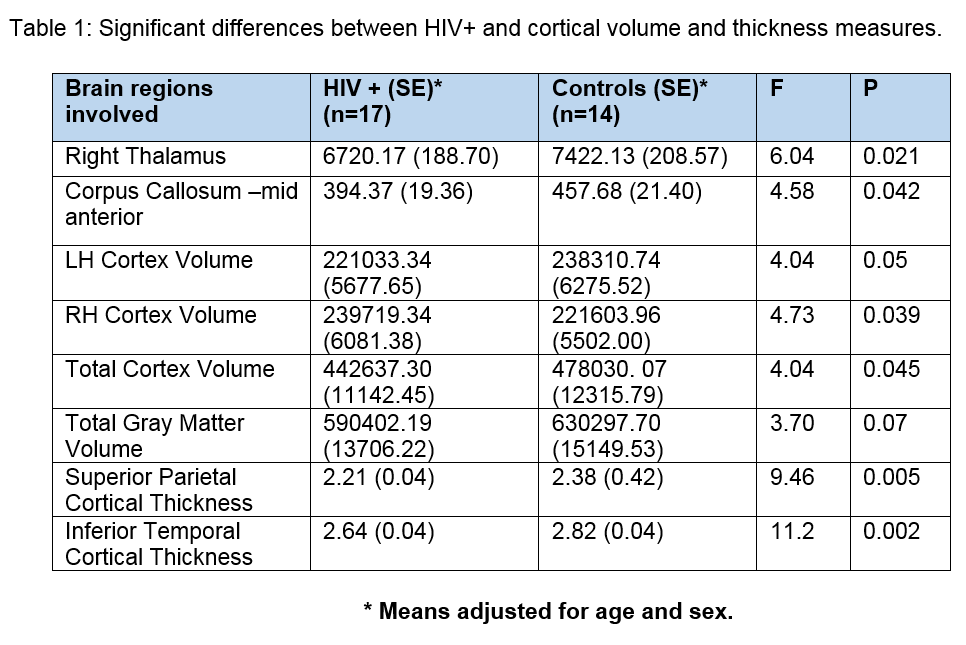
Table 1. Significant differences
between HIV+ and cortical volume and thickness measures
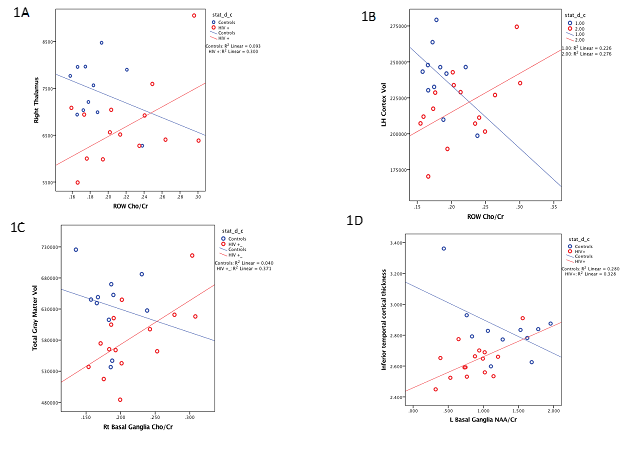
Figure 1. Association between MRS metabolites and Cortical
changes.
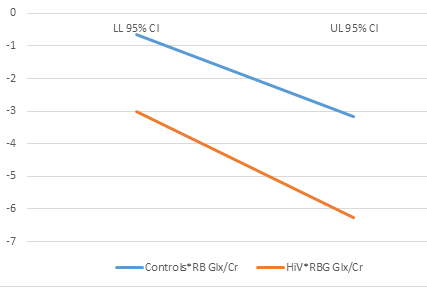
Figure 2. Effect of HIV+*RBG
Glx /Cr on psychomotor speed (parameter estimates ± 95%CI).