0502
Haemodynamic and metabolic MR biomarkers of disease progression in an animal model of relapsing-remitting multiple sclerosis1Institute of Neurology, UCL, London, United Kingdom
Synopsis
Multiple sclerosis (MS) is a chronic inflammatory demyelinating and neurodegenerative disorder of unknown cause affecting the central nervous system. We have assessed haemodynamic and metabolic alterations within spinal cord during disease progression in an animal model (experimental autoimmune encephalomyelitis (EAE) by combining both arterial spin labelling (ASL) and MR Spectroscopy. We demonstrate for the first time that the neurological deficits are strongly correlated with impaired blood flow and reveal both reversible and irreversible simultaneous metabolic alterations.
Introduction
Multiple Sclerosis (MS) affects several different biological processes and pathways. Conventional MRI lacks specificity in characterizing the heterogeneous pathological features, but MR Spectroscopy (MRS) allows detection of metabolic abnormalities in patients with MS within both lesions and normal appearing tissues1,2. Recently, vascular involvement and perfusion abnormalities have received increasing interest adding to a new pathophysiologic concept in MS3,4,5,6. This study has assessed haemodynamic and metabolic alterations within spinal cord (SC) during disease progression in an Experimental-Autoimmune-Encephalomyelitis (EAE) animal model by combining both (Arterial Spins Labelling) ASL and MRS.Methods
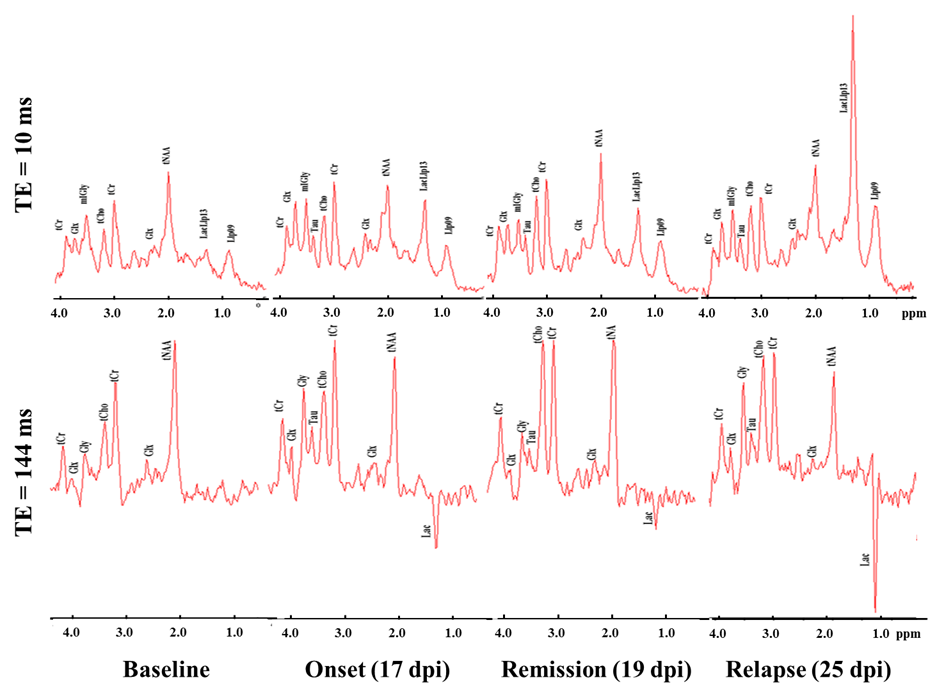
EAE was induced by immunising Dark Agouti rats with rMOG in IFA. Control animals received an emulsion of IFA and saline. Thirteen animals (6 controls and 7 EAE) were weighed and assessed daily for functional deficit on a 10-point scale5, and they were scanned before immunization, and at onset, remission, and relapse phases. MR data were acquired on a 9.4T Agilent scanner using transmit volume coil and surface receive coil. Perfusion maps with an in-plane spatial resolution of 190x190um2 at lumbar level were obtained using an optimised pre-saturation-FAIR-Q2TIPS ASL preparation combined with a reduced FOV readout sequence7,8. The acquisition parameters were: recovery time =3.2s, TI1/TI2=1.55/1.65s, TE/TR=20/5015ms and TA=25min. Short TE MR spectra were acquired using PRESS9 sequence with TE=10ms, TR=5s, VOI=5x2x1.2mm3 at L1/L2 level, and TA=11min. Long TE spectra (TE=144ms) were acquired on some animals to confirm the presence of metabolites such as lactate and glycine. Non water-suppressed spectra were used as reference. To reduce motion artefacts, data acquisition was synchronised with the respiratory cycle.Results
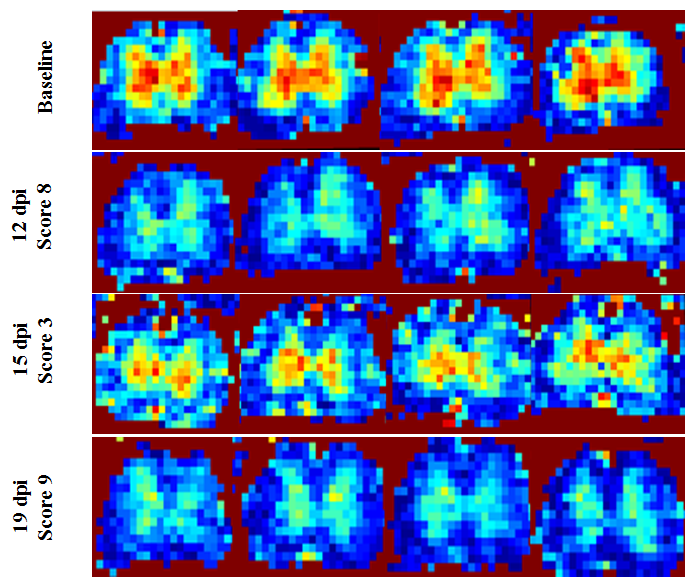
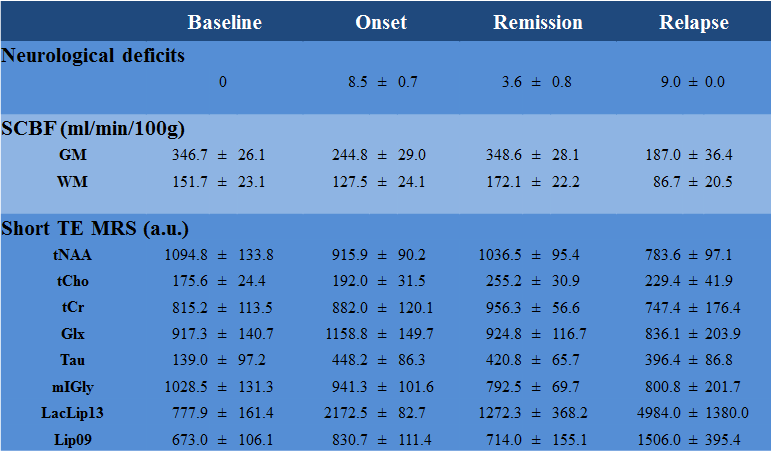
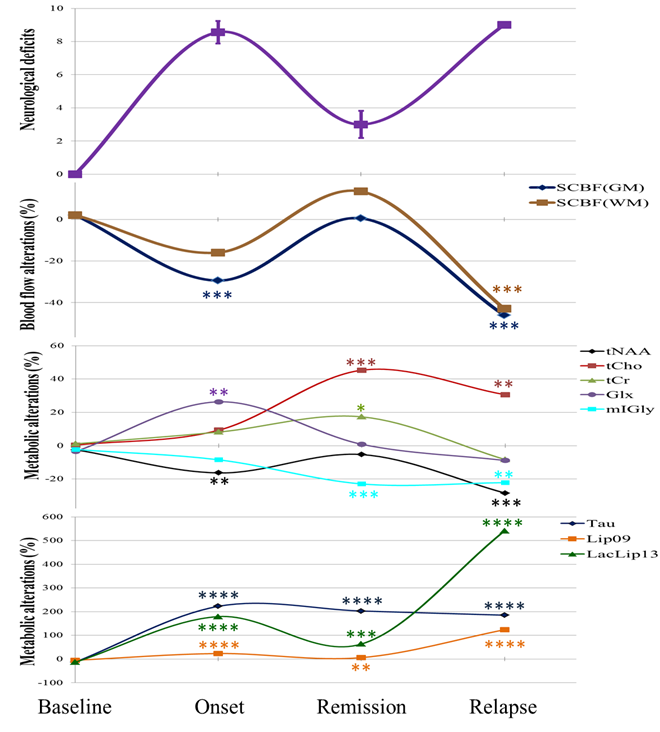
Typical Spinal Cord Blood Flow (SCBF) maps are depicted in Fig1. The average SCBF before immunisation (n=13) in GM and WM were 346.7±26.1ml/100g/min and 151.7±23.1ml/100g/min, respectively. Regarding spectroscopy, the short TE quantification results are shown in Table1. For both techniques, there were no significant differences between baseline and controls at different time points. Compared with controls, EAE animals showed significant decrease of SCBFGM during the first peak of disease (-30.6%,p<0.0001) and relapse (-47.0%,p<0.0001) Fig2. Within WM, significant SCBF differences were observed at relapse (-42.8%,p<0.0001). Regarding MRS, typical short and long TE spectra are shown in Fig3. Significant drop of tNAA was detected at onset (-16.3%,p<0.005) and relapse (-28.4%,p<0.0001) phases. Both lactate/lipids (1.3ppm) and lipids (0.9ppm) increased significantly by 179.2% and 23.4% at the onset before decreasing at remission and then drastically increasing by 540.7% and 123.8% at relapse. At remission, lactate/lipids were significantly higher than baseline measurements (+63.6%,p<0.001). A significant increase of total creatine (17.3%,p<0.05) was observed at remission. At onset, glutamate/glutamine (Glx) concentration increased significantly (26.3%,p<0.001) and then returned to baseline values. However, taurine concentration increased considerably by more than 185% and stayed significantly higher than baseline measurements even during remission. Total choline increased significantly by more than 30% (p<0.001) at both remission and relapse. However, myo-inositol/glycine drop was significant at remission (-23%,p<0.001) and relapse (-22.1%,p<0.007).Discussion
Baseline measurements of SCBF and metabolite concentrations showed high group reproducibility despite the technical challenges of SC MRI/S. Neurological deficits were strongly correlated with impaired blood flow (r=-0.851). Total NAA followed the changes in SCBF reflecting neuronal dysfunction. Lactate was strongly correlated with hypoperfusion consistent with anaerobic metabolism (hypoxia) due to deficient blood perfusion at onset and relapse. High levels of total choline indicate increased cell membrane turnover as seen in de-remyelination, inflammation and gliosis. Elevated total creatine levels might represent high glial cell density. High Glx at onset is consistent with active inflammatory infiltrates and increased release of glutamate by activated leucocytes, macrophages and microglial cells. Progressive drop of mI/Gly indicates abnormal glial cell activity. Drastic increase of taurine might reveal acute inflammatory and neurotoxicity events. Significant increase of lipids at late stages reveals myelin breakdown and membrane degradation. Our findings are in agreement with those reported for patients with MS, except for Tau and mI/Gly1,2,10 because such data are absent in humans. Significant increase of myo-inositol levels has been reported contrasting with progressive reduction in our study. These findings could be related to our animal model and need further investigation.Conclusion
This is the first longitudinal study in EAE rats combining both perfusion and spectroscopy within SC to assess the pathophysiology underlying MS progression. It demonstrates that the neurological deficits are strongly correlated with impaired blood flow and reveals both reversible and irreversible concurrent metabolic alterations. Further studies with more time points and metrics are needed to investigate the causes of hypoperfusion, the interdependency of these changes, and the alterations in energy metabolism during disease progression.Acknowledgements
We would like to thank our funding bodies NMSS and UK MS Society.References
1. Kirov II, Tal A, Babb JS, et al. Serial proton MR spectroscopy of gray and white matter in relapsing-remitting MS. Neurology 2013 ; 80;39-46.
2. Llufriu S, Kornak J, Ratiney H, Oh J, et al. Magnetic resonance spectroscopy markers of disease progression in multiple sclerosis JAMA Neurol. 2014 ; 71(7):840-847.
3. D’haeseleer M., Hostenbach S, Peeters I et al. Cerebral hypoperfusion: a new pathophysiologic concept in multiple sclerosis? J. Cereb. Blood Flow Metab. 2015 ; 35(9):1406-10.
4. Koudriavtseva T, Plantone D, Renna R, Inglese M et al. Brain perfusion by arterial spin labeling MRI in multiple sclerosis. J Neurol 2015 ; 262:1769–1771.
5. Davies AL, Desai RA, Bloomfield PS et al. Neurological Deficits Caused by Tissue Hypoxia in Neuroinflammatory Disease. Ann Neurol 2013 ; 74(6):815-25.
6. Nathoo N, Rogers JA, Yong VW, and Dunn JF. Detecting Deoxyhemoglobin in Spinal Cord Vasculature of the Experimental Autoimmune Encephalomyelitis Mouse Model of Multiple Sclerosis Using Susceptibility MRI and Hyperoxygenation. PLoS One. 2015 ; 18;10(5).
7. Tachrount M, Davies AL, Desai RA, Smith KJ et al. ISMRM 2015 (#6758).
8. Luh WM, Wong EC, Bandettini PA, Hyde JS. QUIPSS II with thin-slice TI1 periodic saturation: a method for improving accuracy of quantitative perfusion imaging using pulsed arterial spin labeling. Magn Reson Med. 1999 ; 41(6):1246-54.
9. Bottomley PA, Spatial localization in NMR spectroscopy in vivo. Ann N Y Acad Sci. 1987 ; 508:333-48.
10. Azevedo C, Kornak J, Chu P, Sampat M, et al. In vivo evidence of glutamate toxicity in multiple sclerosis. Ann Neurol 2014 ; 76:269–278.
Figures