0501
Multimodal Imaging of Vascularity and Drug Delivery in GBM Patients Treated with Anti-angiogenesis Inhibitor1Athinoula A. Martinos Center for Biomedical Imaging, Massachusetts General Hospital, Charlestown, MA, United States, 2Functional Neuroimaging Laboratory, Brigham and Women’s Hospital, Boston, MA, United States, 3Department of Neuro-oncology, Massachusetts General Hospital, Boston, MA, United States
Synopsis
Anti-angiogenic agents can decrease vessel permeability and perfusion, raising concerns that these agents may also decrease blood brain barrier penetration of concomitantly administered chemotherapy. Using MR-PET multimodal imaging, we found radiolabeled temozolomide correlated with permeability and perfusion in patients with recurrent GBM treated with bevacizumab. MR assessment of vascularity may be a surrogate marker for concomitant drug delivery.
PURPOSE
Glioblastoma (GBM) represents 15% of all primary brain tumors and 55% of all gliomas. When treated with concurrent temozolamide (TMZ) and radiation therapy, median survival is 14.6 months and two-year survival is 30%. Anti-angiogenic inhibitor has been used to treat GBM more than a decade ago but have not lived up to its potential. Anti-angiogenic agents inhibit vascular endothelial growth factor (VEGF), reduce new vessel formation in tumors and can decrease vessel permeability and perfusion. These changes in vascularity may also decrease blood brain barrier (BBB) penetration of concomitantly administered chemotherapy [1]. In this study, we performed multimodal MR-PET imaging in GBM patients, to investigate the association between vascularity and drug delivery. Tumor vascularity was assessed by contrast enhanced dynamic MRI. Drug delivery was measured by radiolabeled TMZ uptake in PET.METHODS
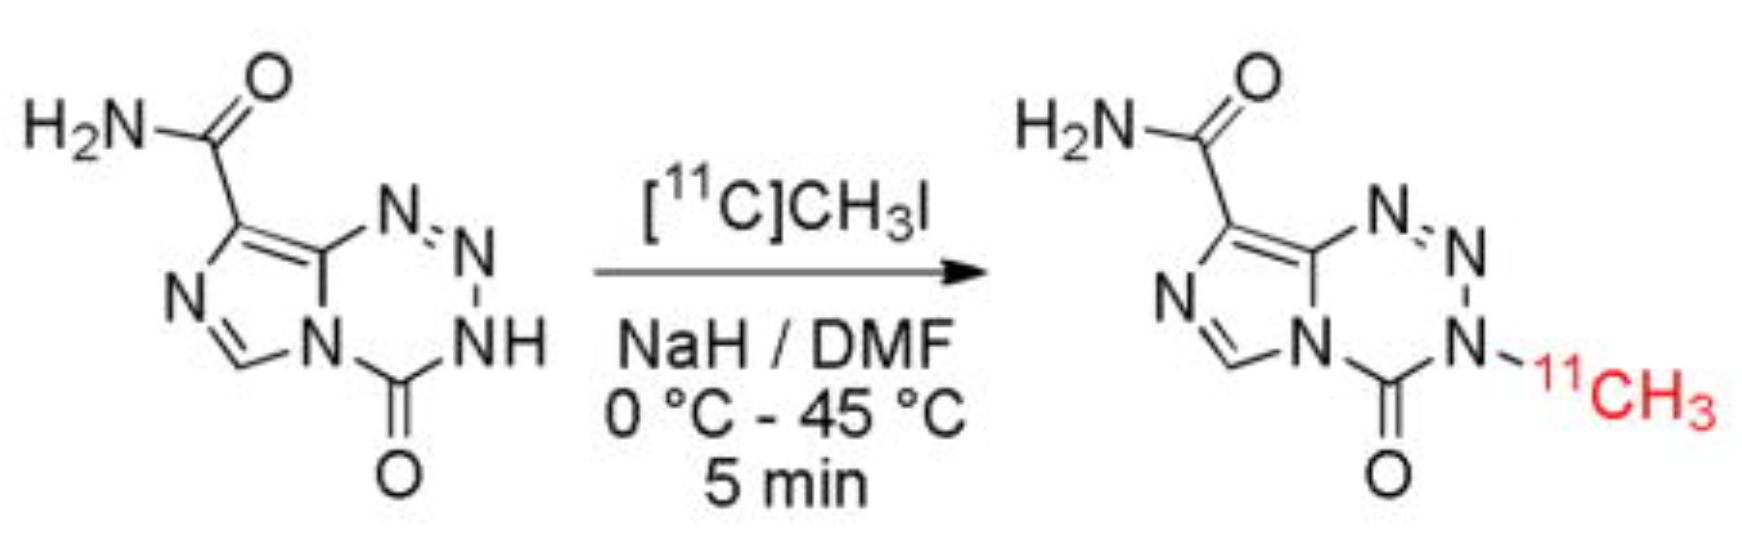
Patients with recurrent GBM recruited to the study received bevacizumab (BEV) 10mg/kg bi-weekly and TMZ 50mg/kg daily. Each patient was scheduled for three visits. After achieving steady state for oral TMZ, patients were scanned prior to the start of BEV treatment, one day after the first BEV infusion, and prior to the third BEV infusion. Imaging was performed on a combined MR-PET system consists of a 3T Siemens TIM Trio 32-channel whole-body MRI (45 mT/m gradient strength and 200T/m/s slew rate) with BrainPET head camera insert for simultaneous MR-PET acquisitions. The system was equipped with an 8-ch and a 32-ch head coils. The radiotracer was temozolamide labeled with 11C positron emitter, which has a half life of 20 min. 211C]TMZ was synthesized on the day of scan by a novel technique [2] (Fig. 1) developed in our center. MRI acquired concurrently consisted T1w, T2w, FLAIR images, as well as dynamic contrast enhanced (DCE) MRI and dynamic susceptibility enhanced (DSC) MRI, each with a bolus injection of Gd-DTPA.
PET data were analyzed by using custom software. After attenuation correction, standardized uptake value (SUV) maps were calculated from PET data acquired 15-min to 20-min [3] after the start of [11C]TMZ injection. Contrast transfer coefficient Ktrans, a measure of capillary permeability, was estimated from Tofts model [4] fitting of DCE data using custom software. Relative cerebral blood flow (rCBF) was estimated from DSC data using software NordicICE (NordicNeuroLab AS, Bergen, Norway) [5]. Tumor regions of interest (ROIs) were outlined on the T1-post contrast by a neuro-oncologist. Edema ROIs were outlined on FLAIR hyperintensity excluding the contrast enhanced (tumor) areas. All images, including T1-post contrast, FLAIR, DCE, DSC and PET, as well as the ROIs, were co-registered to T2w images by using 3DSlicer Brainsfit software[6]. In addition, ROIs of normal apparent gray and white matters were outlined on the T2w images. For each ROI, the median value of SUV, Ktrans, and CBF were calculated to exclude effects of possible outliers.
RESULTS
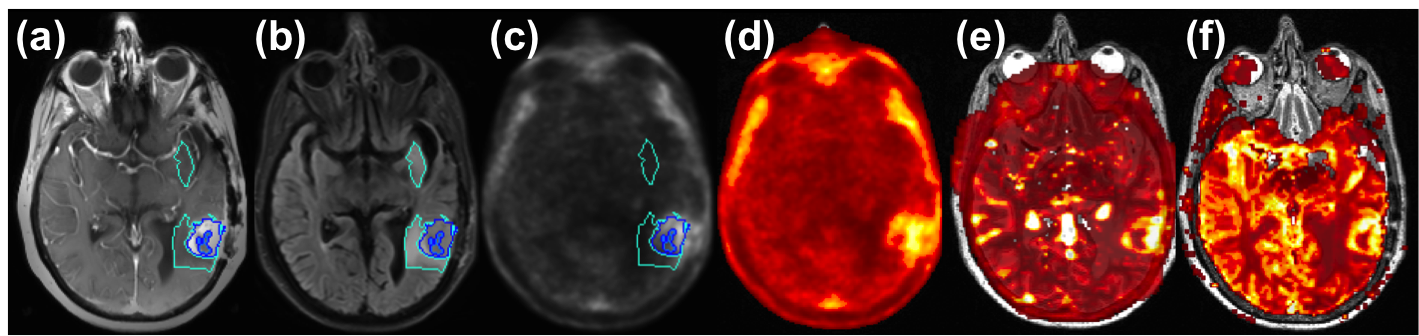
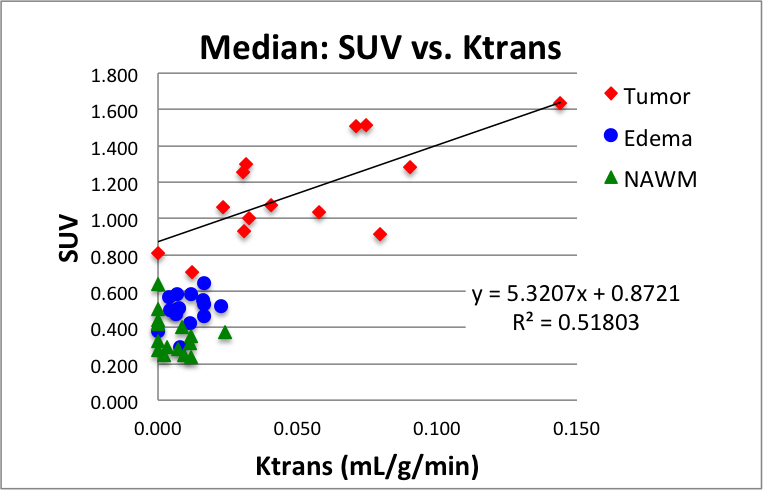
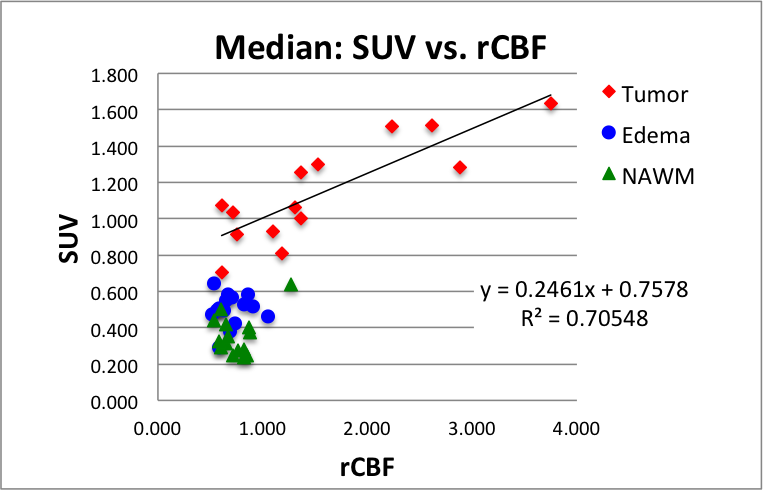
Eight patients have been accrued and 15 MR-PET data sets analyzed so far. Figure 2 exemplifies co-registered multimodal images and ROIs of a patient/visit data set. Tumor ROI (blue lines in Fig. 2) outlines contrast enhancement of the tumor and the central necrosis region is excluded from tumor ROI. FLAIR ROI (turquoise lines in Fig. 2) outlines edema. Increased [11C]TMZ uptake in the SUV map (Fig. 2d), indicating BBB penetration, is in good agreement with increased permeability (Fig. 2e) and increased perfusion (Fig. 2f). The median SUV correlates to median Ktrans in tumors (Fig. 3) with a Pearson correlation coefficient (PCC) of 0.72. PCC between SUV and Ktrans was 0.33 and 0.28 for edema ROI and normal ROI, respectively. The median SUV also correlates well with median rCBF in tumors (Fig. 4) with a PCC of 0.84. PCC between SUV and rCBF was 0.04 and 0.38 for edema ROI and normal ROI, respectively.DISCUSSION AND CONCLUSION
In patients with recurrent GBM treated with bevacizumab, penetration of radiolabeled temozolamide correlates with perfusion and BBB permeability in tumors. Vascularity assessed by DCE-MRI and DSC-MRI may be a surrogate marker for concomitant drug delivery, even with drugs such as temozolomide which penetrate an intact BBB. Further investigation will be conducted to examine the extend of [11C]TMZ uptake as compared to the extend of contrast enhancement to understand how the distribution of drug penetration is related to vasculature.Acknowledgements
This research work was supported by NIH grants R01CA129371, K23CA169021, U01CA154601, S10RR023043, and P41RR14075.
References
1. Gerstner ER, Emblem KE, Sorensen GA. Vascular Magnetic Resonance Imaging in Brain Tumors During Antiangiogenic Therapy--Are We There Yet? Cancer J. 2015;21(4):337-42.
2. Moseley CK, Carlin SM, Neelamegam R, Hooker JM. An efficient and practical radiosynthesis of [11C]temozolomide. Org Lett. 2012;14(23):5872-5.
3. Rosso L, Brock CS, Gallo JM, Saleem A, Price PM, Turkheimer FE, Aboagye EO. A new model for prediction of drug distribution in tumor and normal tissues: pharmacokinetics of temozolomide in glioma patients. Cancer research. 2009;69(1):120-7.
4. Tofts PS, Brix G, Buckley DL, et al. Estimating kinetic parameters from dy- namic contrast-enhanced T(1)-weighted MRI of a diffusable tracer: standard- ized quantities and symbols. J Magn Reson Imaging. 1999;10:223–32.
5. Bjornerud A, Emblem KE. A fully automated method for quantitative cerebral hemodynamic analysis using DSC-MRI. J Cereb Blood Flow Metab. 2010;30(5):1066-78. 6. BRAINSFit: Mutual Information Registrations of Whole-Brain 3D Images, Using the Insight Toolkit, Johnson H.J., Harris G., Williams K., The Insight Journal, 2007.
Figures