0500
Tissue type mapping of gliomas using multimodal MRI1Faculty of Medicine and University Hospital Carl Gustav Carus, OncoRay – National Center for Radiation Research in Oncology, Dresden, Germany, 2Neurosciences Research Centre, St George's, University of London, London, United Kingdom, 3National Heart and Lung Institute, London, United Kingdom, 4Academic Neurosurgery Unit, St George's, University of London, London, United Kingdom, 5Laboratory of Vision Engineering, School of Computer Science, University of Lincoln
Synopsis
1H MRSI can assess glioma infiltration margins and malignant invasion but technical limitations prevent widespread use. In this study we used 2D 1H MRSI to determine voxels of specific tumour tissue type from which we extracted multimodal MRI (M-MRI) image characteristics. Subsequently, we applied superpixel segmentation and Bayesian statistical analysis to M-MRI alone to derive nosologic tumor images of these same tissue types with whole brain coverage. We obtained 100% classification accuracy for overall glioma grade, and an average 0.77 Dice overlap coefficient with the manual segmentation volume. Such methodology could aid prognostic assessment, surgical treatment and radiotherapy dose planning.
Introduction
Identification of glioma infiltration margins and malignant invasion on an individual patient basis could improve prognostic assessment, surgical treatment and radiotherapy dose planning. 1H-MRSI has promise to provide such information1 and can be analysed with pattern recognition in combination with MRI to create tissue-type images2. Technical challenges, low spatial resolution and restrictions for whole brain coverage limit widespread clinical use of MRSI. In this study we used 1H-MRSI to determine tumour regions of a well-defined tissue type from which multimodal MRI (M-MRI) characteristics are derived. Subsequently, a statistical analysis is applied to M-MRI data alone, to find regions with these same tissue characteristics and derive tissue type maps with whole brain coverage, without the limitations of the original MRSI.Methods
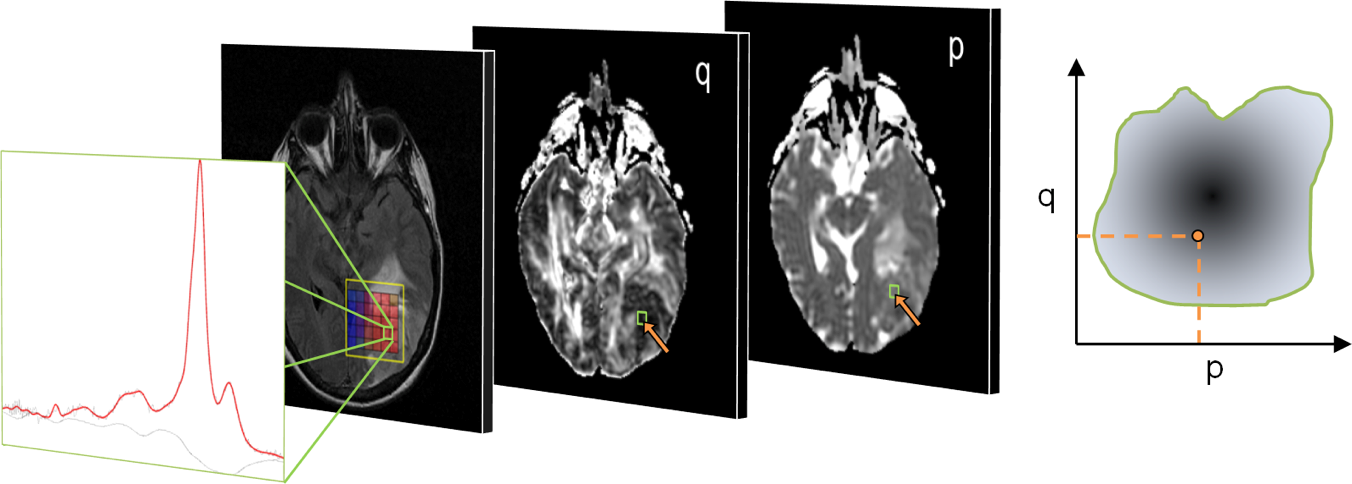
M-MRI consisted of dual echo T2, FLAIR and DTI acquired at 1.5T. Short TE 2D 1H-MRSI and M-MRI were acquired from patients with glial brain tumours (n=27), and M-MRI was acquired from normal controls (n=10) and patients with brain metastases or meningiomas (n=10). Post-processing included co-registration, calculation of p and q diffusion maps, histogram normalisation of PD- and T2-weighted images. Specific tissue regions were selected from which MRI intensity probability density distributions (PDD) were created: i) 1H-MRSI tumour tissue type analysis (3) to select voxels of purely glial tumour tissue (Figure 1); ii) SPM segmentation into grey and white matter and CSF in controls; iii) manual region drawing to select purely oedematous brain tissue adjacent to meningiomas and metastases. Data obtained across multiple subjects provided an overall representation of the PDD for each tissue type, and these were individually normalised. Subsequently, Bayes’ theorem was used to calculate the posterior probability, P(Ci|X), of a voxel X belonging to tissue class Ci,
$$P(C_{i}|X)=\frac{P(C_{i})p(X|C_{i})}{\sum_j P(C_{j})p(X|C_{j})}$$[1]
where P(Ci) is the a priori probability of a voxel X belonging to tissue class Ci and p(X|Ci) the probability of tissue class Ci for a specific value of X. X is a 4D vector representing the (p, q, T2w, PDw) image intensities.
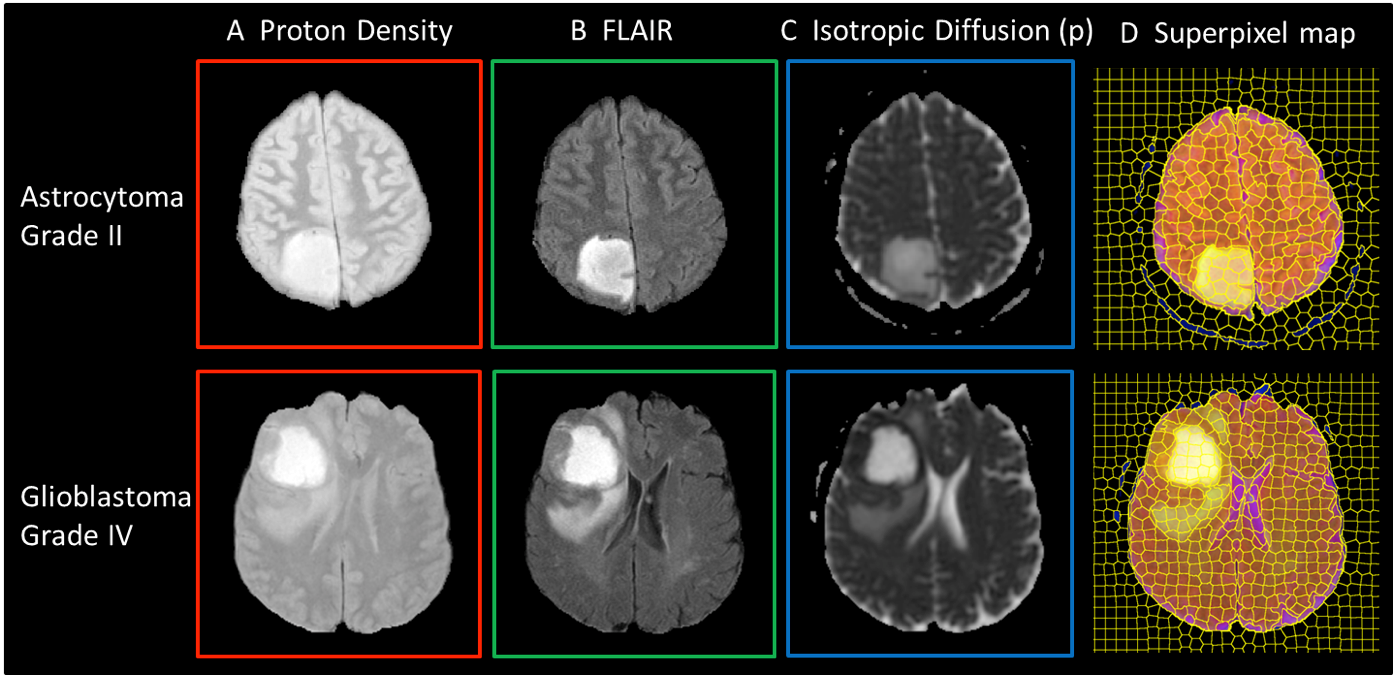
Next, superpixel segmentation was applied across 3 image types: PD, FLAIR and the p diffusion coefficient4, to create larger regions of similar tissue types in which the average signal intensity for each modality was used to calculate tissue probabilities using Eq [1]. A decision tree approach was then used to decide whether each superpixel was more likely to be tumour or non-tumour tissue, and then give a weighted classification for the tissue subgroups. Tissue type maps were created using RGB color-coding with intensity weighting according to the tissue type. Accuracy of automated segmentation of the tumour volume was assessed by the Dice co-efficient analysis compared to manual segmentation. For each tumour, an overall grade was determined from the superpixel with highest tumour grade and compared to clinical histopathological diagnosis.
Results
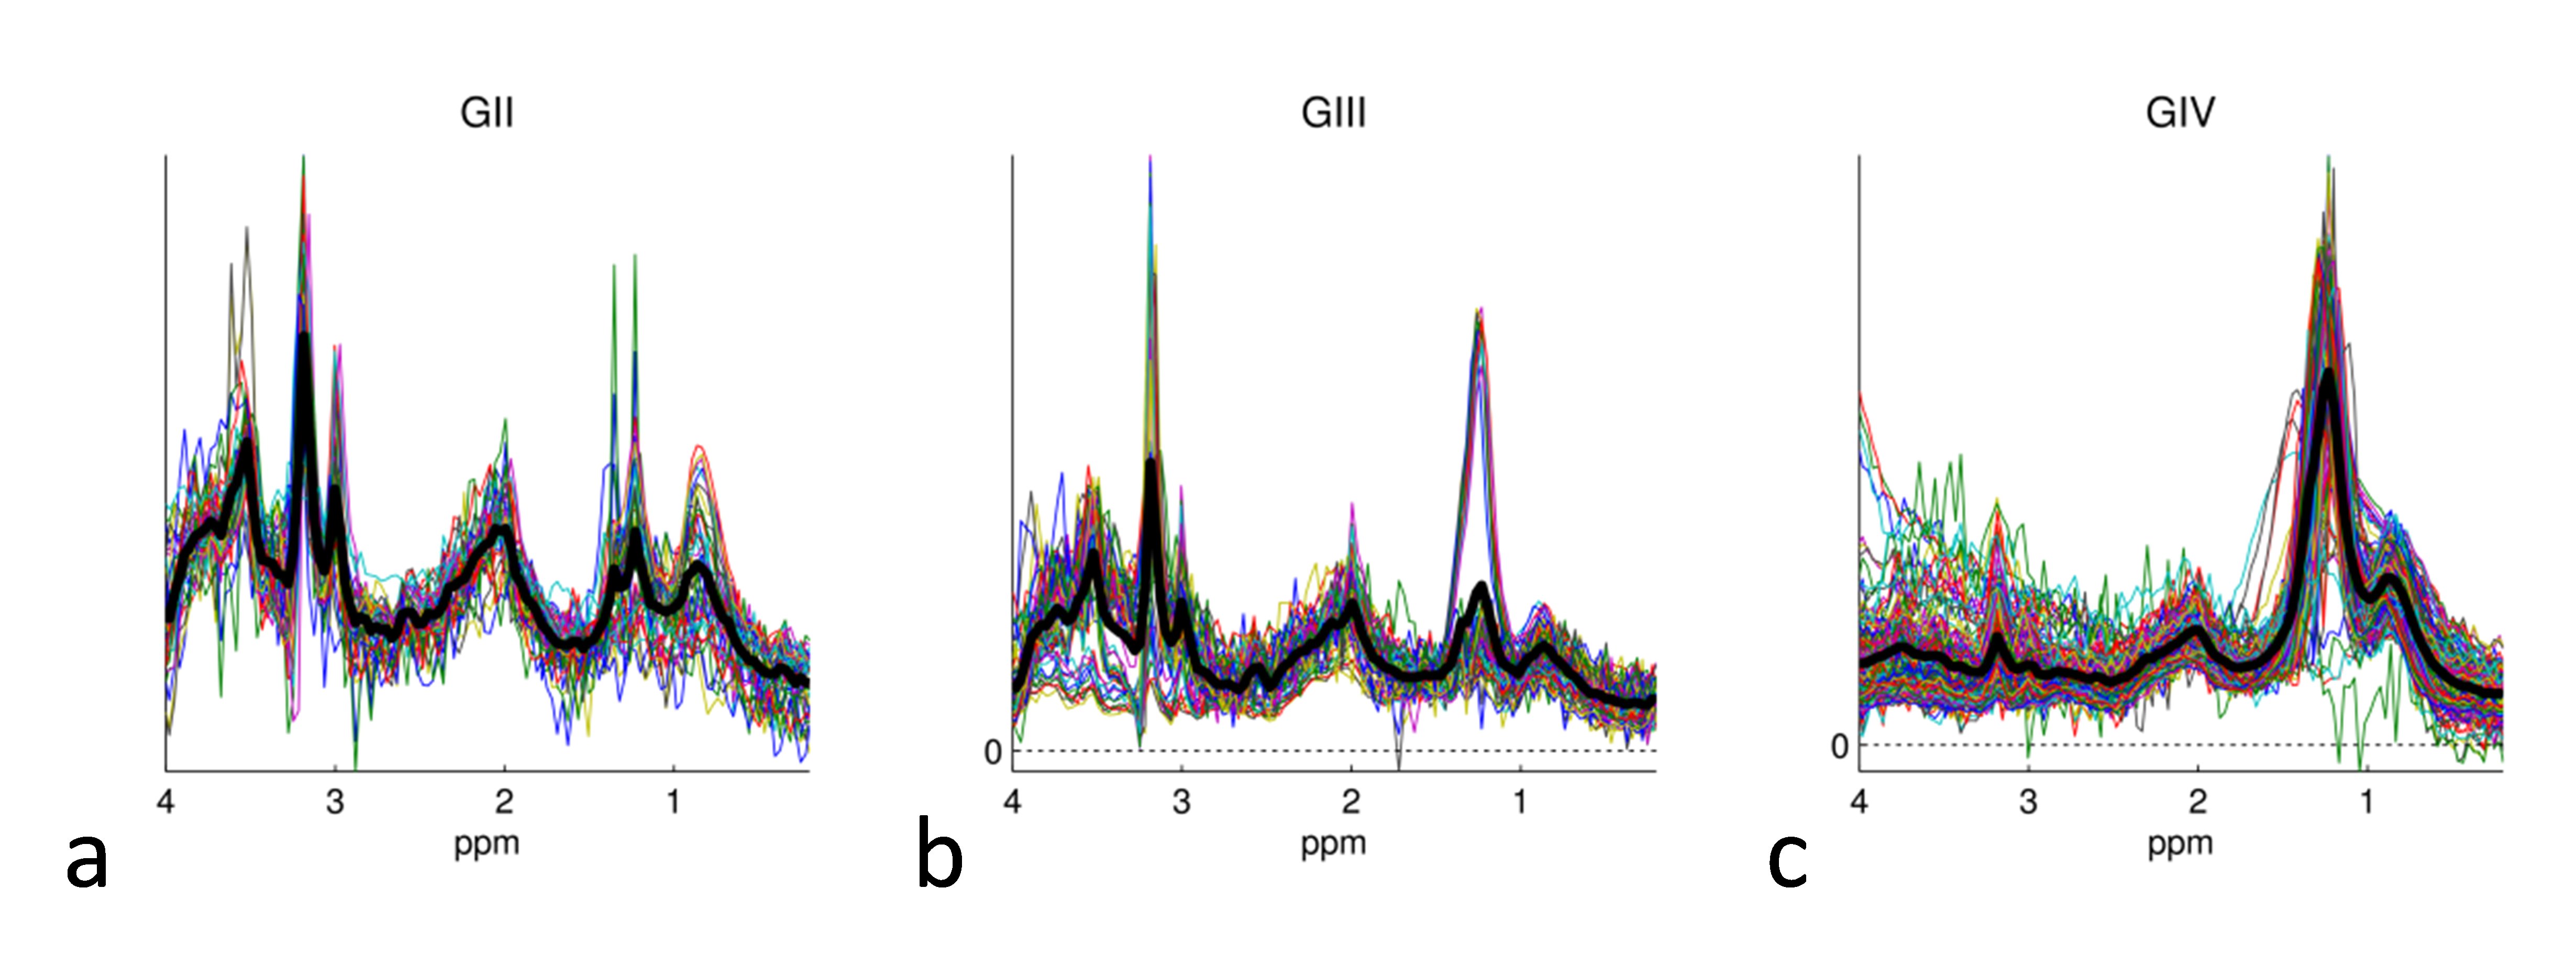
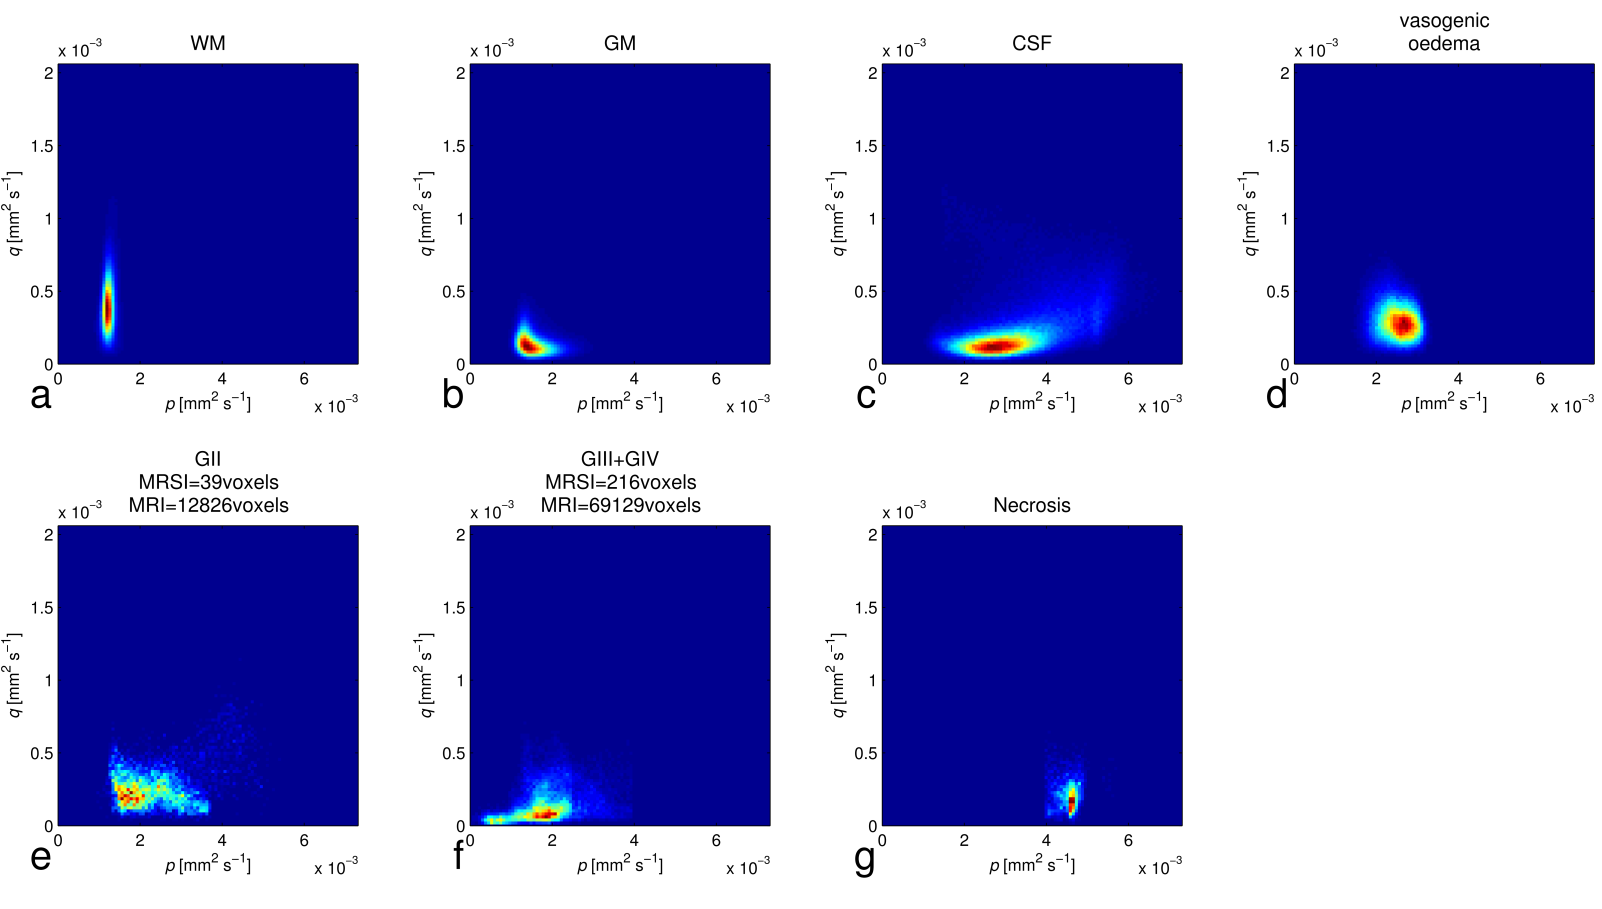
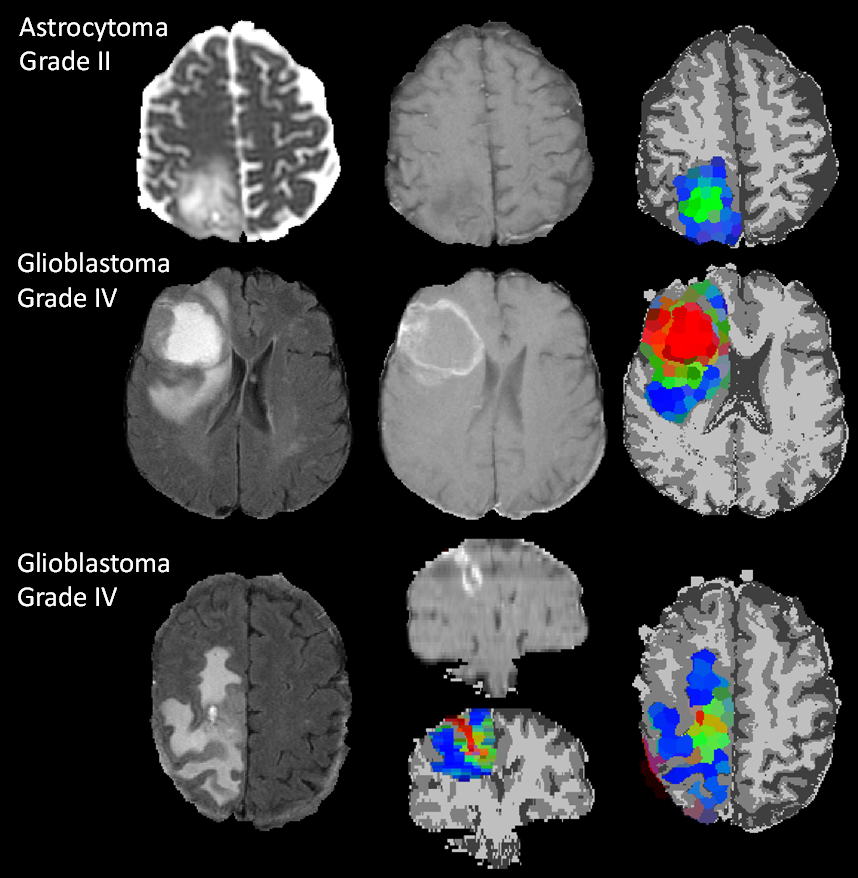
Stacked spectra from all voxels used do define the tumour regions for each glioma grade show minimal partial volume with brain (Figure 2). Figure 3 shows 2D PDDs for the p-q diffusion coefficients, with separate distributions for high-grade glioma and necrotic tissue created by thresholding the data according to p. Superpixel analysis was initiated with a grid-size of 30 (for 1024 x 1024 interpolated images) and regularisation parameter of 0.2 to ensure that the superpixel size is appropriately matched to the spatial variation in tissue heterogeneity (Figure 4). The chosen image modalities show good segmentation of the normal and abnormal tissue. Figure 5 demonstrates good visual correlation between tumour tissue classification and that expected from the underlying MRI. For 24 glial tumours suitable for full analysis, we obtained an average Dice coefficient of 0.77 +/- 0.13 for the overlap of the 3D volume determined by automated tumour segmentation to that by manual delineation. All 16 high grade tumours showed high-grade features with range 3 – 85% of their volume; the 5 low-grade tumours only showed low grade features; 3 gemistocytic tumours showed mostly low grade superpixels with 2 – 10% of their volumes as high-grade.Discussion
We have demonstrated that signal intensity information from multi-modal MRI can be used in a multi-dimensional Bayesian framework to automatically map out glial tumour boundaries, with promising results for separation of oedematous regions from tumour infiltration and to determine heterogeneity of tumour grade. All three gemistocytic tumours showed high-grade features, in keeping with their more aggressive behaviour compared to other low-grade gliomas5. Further work is needed to validate the classification using biopsy sampling and longitudinal data. Furthermore the method can be extended to any mix of imaging types acquired at any spatial resolutions.Acknowledgements
This work was supported by Cancer Research UK grants C1459/A13303 and C7809/A10342. Brain tumour data were obtained during the EU FP7 “eTUMOUR” project, grant LSHC-CT-2004-503094.References
1. Nelson SJ. Assessment of therapeutic response and treatment planning for brain tumors using metabolic and physiological MRI. NMR in Biomedicine, 24:734–749, 2011.
2. Luts J, Laudadio T, Idema AJ, Simonetti AW, Heerschap A, Vandermeulen D, Suykens JAK, Van Huffel S. Nosologic imaging of the brain: segmentation and classification using MRI and MRSI. NMR Biomed 2009; 22:374–390.
3. Raschke F, Wright AJ, Fellows G and Howe FA. 1H 2D MRSI tissue type analysis of gliomas. Magn Reson Med. 2015;73:1381-9.
4. Soltaninejad M, Yang G, Lambrou T, Allinson N, Jones TL, Barrick TR, Howe FA, Ye X. Automated Brain Tumour Detection and Segmentation using Superpixel-based Extremely Randomized Trees in FLAIR MRI. Accepted for IJCARS August 201.
5. Krouwer
HGJ, Davis RL, Silver P, Prados M. Gemistocytic astrocytomas: a reappraisal. Journal of Neurosurgery 1991;74:399-406
Figures