0499
Improved Localisation of DBS Electrodes using Pseudo-Positive Contrast from a Zero-Echo-Time Acquisition1GE Global Research, Munich, Germany, 2GE Global Research, Niskayuna, NY, United States, 3GE Global Research, Bangalore, India, 4Albany Medical College, Albany, NY, United States, 5Alliance Healthcare Radiology, Nathan Littauer, Gloversville, NY, United States
Synopsis
The goal of this work is to reduce artefact extent and improve localisation of deep-brain stimulation (DBS) electrodes with MRI. A Zero Echo-Time (ZTE) sequence was used for data acquisition in a phantom and a patient; the minimal signal voids around electrodes, the ZTE’s natural proton-density weighting and low SAR/B1rms make it ideal for imaging implants. A pseudo-positive contrast image was first generated by inverting ZTE image intensity values, fitting and subtracting the background signal; a centre of mass calculation and singular value decomposition were then employed for electrode detection. Similar-sized artefacts as in CT images and improved precision over standard T1-weighted imaging were demonstrated.
Purpose
The goal of this work is to reduce artefact extent and improve MRI-based localisation of deep-brain-stimulation (DBS) electrodes by using an optimised, artefact-limiting Zero-Echo-Time (ZTE) acquisition.
Introduction
Deep brain stimulation (DBS) is a rapidly growing field, expanding its applications from treatment of Parkinson’s disease and tremor to depression or Alzheimer’s disease [1]. Surgery planning requires a pre-operative MRI for target localisation, sometimes acquiring a CT scan in addition. Post-surgery, the electrode implantation success is validated using CT or MRI [1]. Redundant multi-modality imaging exams (requiring cross-modality registration) cannot be eliminated easily, as the targeted brain nuclei and potential lesions are only visible on MRI. CT, with its high resolution and minimal distortion, is generally regarded as the standard for electrode localisation post-operatively. Since pre-operative MRI cannot be eliminated, the number of (cross modality) exams can only be reduced if post-operative MRI localises DBS electrodes similarly well as CT.
Zero-Echo-Time (ZTE) acquisition [2,3] is proposed here to considerably decrease the extend of artefacts around the DBS leads in order to improve MRI-based localisation. Comparable positioning accuracy and increased precision (referenced to CT) was demonstrated in a phantom through ZTE as compared to SPGR-based approaches; artefact reduction was demonstrated in a phantom and a patient.
Methods
Imaging: A head-shaped, gel-filled phantom with an embedded Medtronic 3387 DBS lead (4 electrodes (ø=1.27mm,L=1.5mm,spacing=1.5mm)) and a patient with two implanted 3389 leads were scanned at 1.5T (GE MR450w) using a 24-channel head coil. Images were acquired with a standard, T1-weighted SPGR sequence (3D Cartesian, TE/TR=5.1/11.7ms, flip=20°, resolution=(1mm)3, acq. duration=11.6min, SAR=0.19W/kg), and a proton-density weighted ZTE sequence (3D radial, BW=±31.25kHz, flip=1°, TE=12µs, resolution=(1mm)3, acq. duration=3.4min, SAR=0.02W/kg), obeying B1rms≤2µT. Phantom and patient post-surgery CT were acquired as well on a GE Discovery CT scanner (resolution=(0.5mm)3).
The phantom was scanned in three separate positions for both MR and CT; nine fiducial markers attached to the phantom were used to register MRI to CT scans, hence allowing a direct validation of localisation performance.
Electrode localisation: Pseudo-positive contrast MR images were generated for ZTE and SPGR by: (1) generating an object mask using region growing and dilation; (2) inverting masked images; (3) fitting the remaining background signal with a point-wise polynomial interpolation function; (4) subtracting this smoothed background from the images.
The leads were detected in pseudo-positive contrast MR and directly in the CT images by: (1) placing a seed point in the maximum; (2) region growing and dilation to generate a mask around the lead; (3) calculating position and orientation using centre-of-mass and singular-value-decomposition, respectively. The signal-void diameters were calculated from the singular values of the covariance matrix. All post-processing was implemented in 3D in Matlab.
Accuracy and precision validation: For each phantom position and each ZTE/SPGR/CT scan, the fiducial markers were segmented by region growing and their 3D locations were determined using a centre-of-mass calculation. Rigid (=rotation and translation) 4×4 transformation matrices were fitted from these locations for registering MR to the CT images; the projected electrode location using this transformation was compared to its actual location in the CT scans, hence allowing for direct comparison of localisation performance of the two MRI approaches.
Results and Discussion
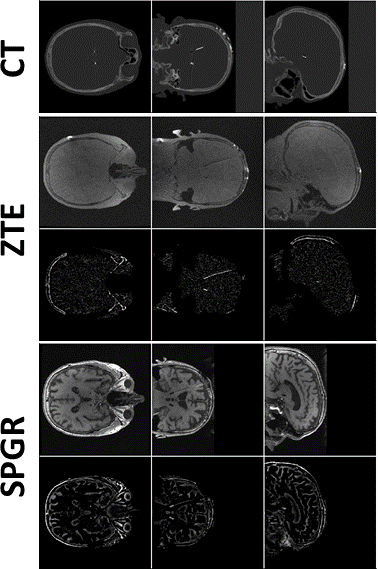
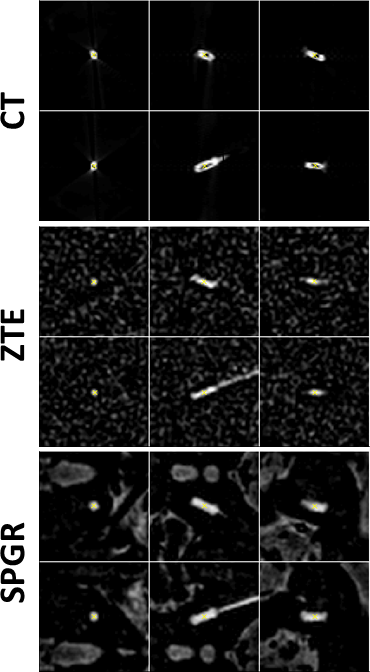
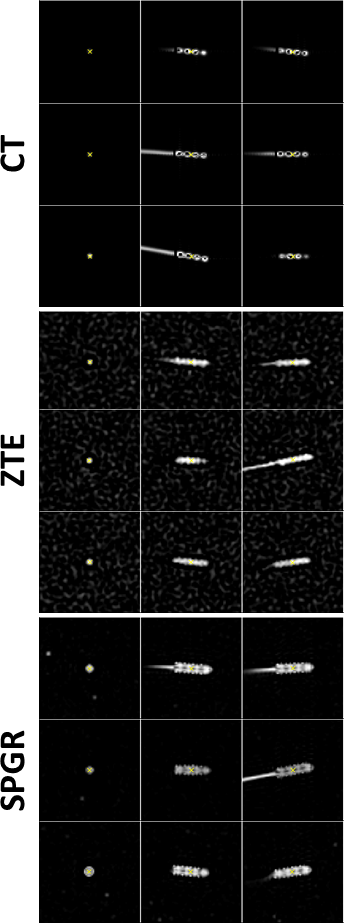
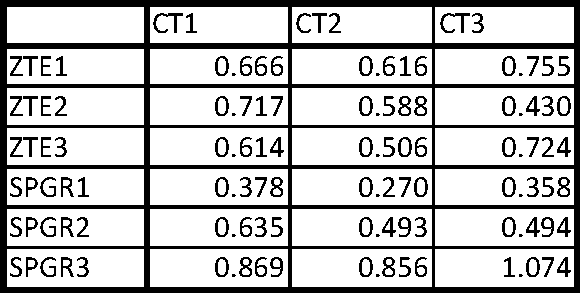
It is possible to reduce the signal void with ZTE and improve localisation precision. Generating pseudo-positive contrast images by inverting and subtracting image background leads to similar electrode contrast of ZTE images as in CT (Fig.1); significant contrast remains for SPGR. The signal-(void) diameters were for SPGR/ZTE/CT 2.9/2.4/2.7mm and 3.5/2.3/2.0mm for brain and phantom data, respectively (Figs.2&3), hence demonstrating the improvement from SPGR to ZTE, and making ZTE comparable to CT. Absolute electrode locations in the three phantom positions differed from MR to CT by 0.62±0.11mm and 0.61±0.24mm for ZTE-CT and SPGR-CT, respectively (Fig.4).
An ANOVA test indicated comparable localisation accuracy between ZTE/SPGR (p=0.83), while a homogeneity of variance test demonstrated a significantly lower variance, hence increased localisation precision for ZTE (p=0.01). This is likely due to the susceptibility-induced and orientation-dependent signal distortions around the metallic leads, particularly visible in longer echo-time acquisitions [4]. Please note that SAR and acquisition duration was reduced from SPGR to ZTE (at equal resolution) by a factor of 10 and 3, respectively. More averaging for ZTE to match the SPGR acquisition duration could further improve localisation with ZTE.
In conclusion, we believe that the post-implantation CT exam should be replaced by a single MR exam, which includes ZTE along with other T1 and T2 weighted acquisitions for a good depiction of the nuclei of interest, potential lesions and the implanted DBS electrodes.
Acknowledgements
No acknowledgement found.References
[1] Deep Brain Stimulation for Neurological Disorders: Theoretical Background and Clinical Application. Itakura T. Book edition 2015; Springer.
[2] Ultra-fast imaging using low flip angles and fids. Madio DP, Lowe IJ. Magn Reson Med 1995;34:525–529.
[3] Density of organic matrix of native mineralized bone measured by water- and fat-suppressed proton projection MRI. Wu Y, Ackerman JL, Chesler DA, Graham L, Wang Y, Glimcher MJ. Magn Reson Med 2003;50:59–68.
[4] The role of magnetic susceptibility in magnetic resonance imaging: MRI magnetic compatibility of the first and second kinds. Schenck J. Med Phys 23(6), 815-850, 1996.
Figures