0498
Myelin Water Imaging Using T2-Relaxation in the Spinal Cord; Comparison of Multi-echo GRASE and mcDESPOT1Medicine, University of British Columbia, Vancouver, BC, Canada, 2Radiology, University of British Columbia, Vancouver, BC, Canada, 3Pediatrics, University of British Columbia, Vancouver, BC, Canada, 4Physics and Astronomy, University of British Columbia, Vancouver, BC, Canada
Synopsis
There are currently several techniques for in vivo myelin water imaging using T2 relaxation. In this study we compare two clinically feasible myelin water imaging protocols for the cervical spinal cord: mcDESPOT and multi-echo GRASE. Myelin estimates from GRASE were consistently higher than mcDESPOT in white matter, but both techniques were able to differentiate between white and gray matter. T1 estimates from mcDESPOT also showed clear differences between white and gray matter. By combining GRASE and mcDESPOT, with total acquisition time less than 15 min, we can build a better picture of the tissue microstructure of the spinal cord.
Introduction and motivation
Myelin water imaging using mcDESPOT (multicomponent Driven Equilibrium Single Pulse Observation of T1 and T2) has become an increasingly popular method for assessing white matter (WM) integrity in the brain.1 However, studies of the spinal cord using mcDESPOT are limited and utilize a large field of view in sagittal slices with long acquisition times. It is well known that mcDESPOT and multi-echo GRASE are both sensitive to myelin but comparison of the specificity between the techniques is relatively unexplored. To date, no study has compared the two techniques in the spinal cord. In this study, we perform MWI using mcDESPOT and multi-echo GRASE in the cervical spinal cord with high resolution axial slices in order to characterize tract-specific similarities and differences between the two techniques.Methods
Four healthy volunteers (all male, mean age: 26y, range: 24-28y) were scanned on a Philips 3T Achieva scanner using a 6-channel spine coil. The mcDESPOT protocol consisted of 7 spoiled gradient echo (SPGR) scans (alpha={2,3,4,6,10,13,18}°, TR/TE=5.5/2.7ms, resolution=0.75x0.75x4mm3, acquisition time=74s), 7 balanced steady state free precession (bSSFP) scans (alpha={7,14,21,28,35,42,49}°, phase cycles={0,90}°, TR/TE=10/5ms, resolution=0.75x0.75x4mm3, acquisition time=266s), and one inversion recovery SPGR (IRSPGR) scan (alpha=5°, TR/TE/TI=5.5/2.7/350ms, resolution=0.75x0.8x8mm3, acquisition time=17s). mcDESPOT data was collected with a field of view (FOV) of 180x200x56mm3, total acquisition time was 6min. GRASE data was acquired with 32 echoes, TE/TR=10/1500ms, resolution=0.75x0.75x5mm3, FOV=180x150x40mm3, acquisition time=8.5min.2 For registration and segmentation purpose, a high resolution multi-echo gradient echo (mFFE) scan was also acquired (5 echoes, resolution=0.8x0.8x2.5mm3, FOV=150x150x44mm3, TR/TE1/TE2-5=814/6.6/8.2ms).
The
DESPOT1-HIFI code was used to obtain a B1 correction map.3 Quantitative maps for mcDESPOT were obtained
using the 3-pool mcDESPOT model.4 Retrospective motion correction of
mcDESPOT data was performed by registering all data to one of the bSSFP
acquisitions (alpha=14, Phase=0°) using a slice-wise registration.5 Data obtained with GRASE was analyzed
using a non-negative least squares algorithm with stimulated echo correction.6 Three regions of interest (ROI) were
manually outlined on the mFFE: dorsal column (DC), corticospinal tract (CCST), gray matter (GM).
Whole cord segmentation was generated automatically.7 GRASE and mcDESPOT scans were registered
to the mFFE using slice-wise registration, and ROIs were subsequently transformed
to the native space of the quantitative data. The myelin water fraction (MWF)
and intra-extracellular T2 (IET2) were compared between GRASE and
mcDESPOT within each ROI. The myelin water residence time and global T1
from mcDESPOT were compared to literature values. Statistical differences in
quantitative metrics between WM and GM ROIs were assessed using a paired
one-tailed t-test.
Results
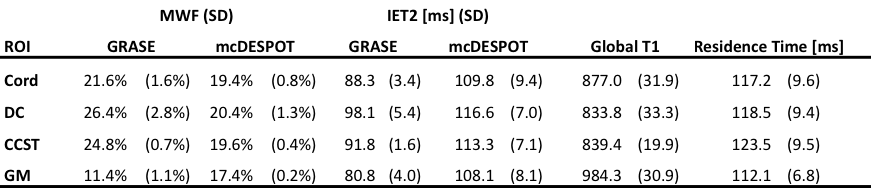
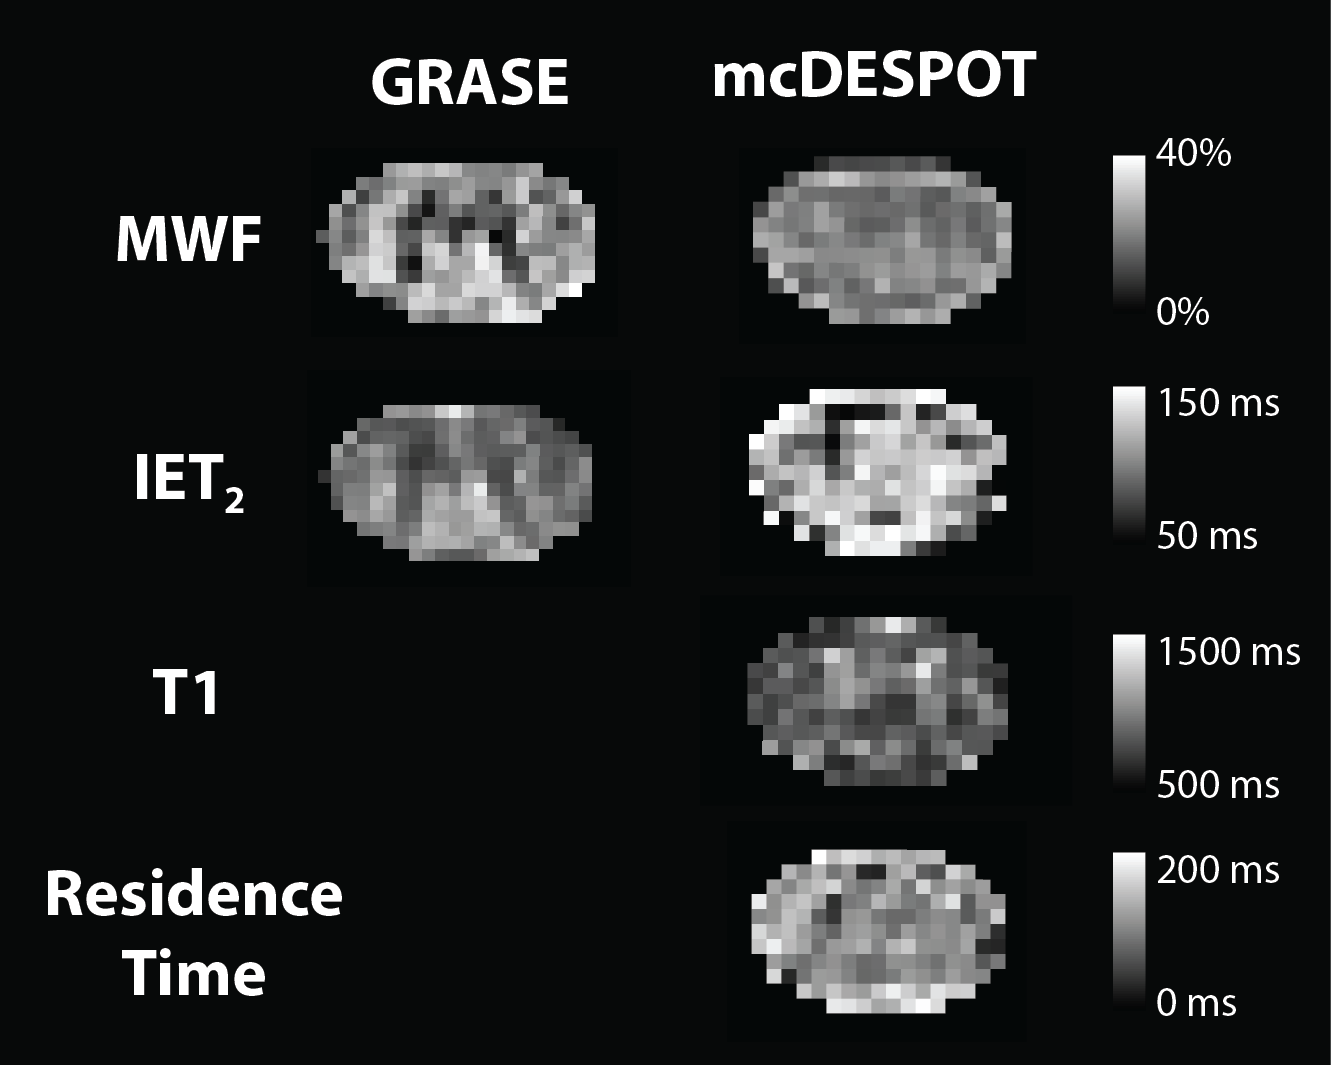
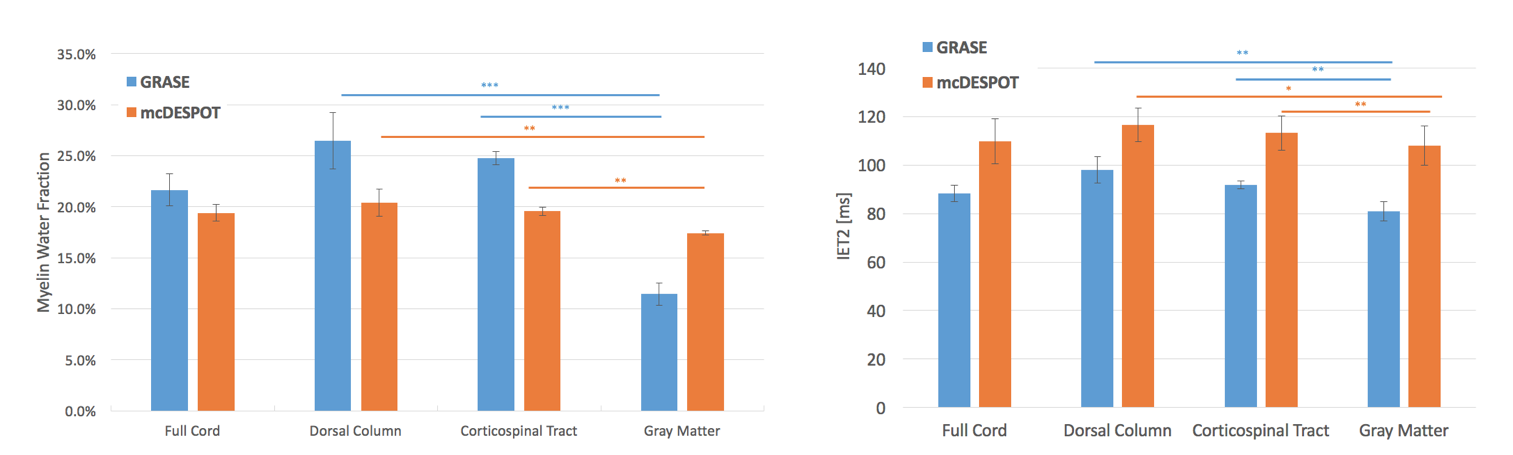
Quantitative maps from GRASE and mcDESPOT are shown in Figure 1. Average whole cord MWF was 19.4±0.8% for mcDESPOT and 21.6±1.6% for GRASE (Table 1 and Figure 2). MWF in DC and CCST are significantly higher than GM for both GRASE and mcDESPOT (Figure 2). However, MWF values in GM were much higher for mcDESPOT (17.4±0.2%) than GRASE (11.4±1.1%). Neither sequence could differentiate between DC and CCST in this small sample.
IET2 was consistently higher in mcDESPOT compared to GRASE (Table 1 and Figure 2). T1 measures, shown in Table 1, are slightly lower than those from Stanisz et al. (T1CORD=993±47ms),8 but in line with Smith et al. (T1DC=853±68ms, T1GM=994±54ms).9 Myelin water residence time in Table 1 are in line with the findings of Kolind et al. (120±3ms for the whole cord).10
Discussion and Conclusions
MWF values obtained from the present study are consistent with values from literature; using mcDESPOT, Kolind et al. measured whole cord MWF of 21±0.6%10 in whole cervical cord, and using GRASE, Ljungberg et al. reported MWF of 23±1.5%2. The lack of contrast in MWF between WM ROIs with mcDESPOT is consistent with a previous study by Kolind et al.10 The same phenomenon has been observed in brain, in which mcDESPOT myelin estimates shows less contrast between brain structures than GRASE.11 The relatively high MWF in GM from mcDESPOT in the present study could be due to smoothing from retrospective motion correction.
While GRASE produced WM/GM contrast superior to mcDESPOT in this study, the mcDESPOT protocol is only 6min for 14 4mm slices compared to 8.5min for 8 5mm slices for GRASE. Since scans are acquired sequentially in mcDESPOT, retrospective motion correction is possible and required. mcDESPOT can also produce more parameters than GRASE; here we showed T1 and myelin water residence time, but additional parameters can be studied.1 With this in mind, we see mcDESPOT as a complement to GRASE rather than an alternative. With the additional quantitative measures we can create a better picture of the tissue microstructure, allowing for better understanding of disease mechanisms in the spinal cord.
Acknowledgements
This study was supported by the Milan & Maureen Ilich Foundation.References
1. Deoni, S. C. L., Rutt, B. K., Arun, T., Pierpaoli, C. & Jones, D. K. Gleaning multicomponent T1 and T2 information from steady-state imaging data. Magn. Reson. Med. 60, 1372–1387 (2008).
2. Ljungberg, E. et al. Rapid Myelin Water Imaging in Human Cervical Spinal Cord. in Proc. Intl. Soc. Mag. Reson. Med (2016).
3. Deoni, S. C. L. High-Resolution T1 Mapping of the Brain at 3T with Driven Equilibrium Single Pulse Observation of T1 with High-Speed Incorporation of RF Field Inhomogeneities (DESPOT1-HIFI). 26, 1106–1111 (2007).
4. Deoni, S. C. L. & Kolind, S. H. Investigating the stability of mcDESPOT myelin water fraction values derived using a stochastic region contraction approach. Magn. Reson. Med. 73, 161–169 (2015).
5. Cohen-Adad, J. et al. Spinal Cord Toolbox: an open-source framework for processing spinal cord MRI data. in Proceedings of the 20th Annual Meeting of OHBM, Hamburg, Germany 3633 (2014).
6. Prasloski, T., Mädler, B., Xiang, Q. S., MacKay, A. & Jones, C. Applications of stimulated echo correction to multicomponent T2 analysis. Magn. Reson. Med. 67, 1803–1814 (2012).
7. De Leener, B., Kadoury, S. & Cohen-Adad, J. Robust, accurate and fast automatic segmentation of the spinal cord. Neuroimage 98, 528–536 (2014).
8. Stanisz, G. J. et al. T1, T2 relaxation and magnetization transfer in tissue at 3T. Magn. Reson. Med. 54, 507–512 (2005).
9. Smith, S. A., Edden, R. A. E., Farrell, J. A. D., Barker, P. B. & Zijl, P. C. M. Van. Measurement of T1 and T2 in the Cervical Spinal Cord at 3 Tesla. Magn. Reson. Imaging 60, 213–219 (2008).
10. Kolind, S. H. & Deoni, S. C. Rapid three-dimensional multicomponent relaxation imaging of the cervical spinal cord. Magn. Reson. Med. 65, 551–6 (2011).
11. Zhang, J., Kolind, S. H., Laule, C. & Mackay, A. L. Comparison of myelin water fraction from multiecho T2 decay curve and steady-state methods. Magn. Reson. Med. 73, 223–232 (2015).
Figures