0496
LONG TERM EFFECTS OF PULSED FOCUSED ULTRASOUND AND MICROBUBBLES DETECTED BY MULTIVARIATE IMAGING MODALITIES1Frank Laboratory, Radiology and Imaging Sciences, Clinical Center, National Institutes of Health, Bethesda, MD, United States, 2Center for Infectious Disease Imaging (CIDI), Radiology and Imaging Sciences, National Institutes of Health, Bethesda, MD, United States, 3National Institute of Biomedical Imaging and Bioengineering, National Institutes of Health, Bethesda, MD, United States
Synopsis
Blood brain barrier (BBB) opening by MR-guided pulsed Focused Ultrasound (pFUS) and microbubbles (MB) is a non-invasive treatment of various central nervous system diseases. However, the potential adverse effects of repeated pFUS+MB exposure have not been thoroughly elucidated and may limit clinical translation. To date MRI scans of repeated BBB opening by pFUS+MB have been achieved without hemorrhage, edema and behavioral changes in non-human primates (Arvanitis, et al. 2015; Downs, et al. 2015). By incorporating detailed multivariate imaging modalities we characterized the long term effects of single or repeated pFUS+MB in the rat brain.
INTRODUCTION
The purpose of the study is to characterize the morphological and pathological changes in the brain following repeated BBB opening with pFUS and microbubbles (MB) in the rat striatum and hippocampus as monitored by 3T and 9.4T MRI, positron emission tomography (PET) and histology over 13 weeks.METHODS
pFUS+MB (OptisonTM, GE Healthcare) 0.3 – 0.5 MPa, 10ms burst length, 1% duty cycle (9 focal points, 120sec/9 focal points – striatum, 120 sec/4 focal points – hippocampus) 589.636kHz; focal number: 0.8; aperture: 7.5cm; FUS Instruments) was targeted in female rats (n=6/group) either once or six weekly to the striatum and the contralateral hippocampus. 100μl of MB were administered intravenously over 1 minute starting 30sec before pFUS. Rats received 3 daily doses of 300mg/kg 5-Bromo-2′-deoxy-uridine (BrdU, Sigma Aldrich) intraperitoneally before sonication to label proliferating cells in vivo. T2, T2* and Gd-enhanced T1-weighted images were obtained by 3.0T MRI (Achieva, Philips), T2, T2*, diffusion tensor imaging (DTI) and chemical exchange saturation transfer (CEST) imaging was performed by 9.4T MRI (Bruker). Parameters for DTI: 3D spin echo EPI; TR/TE 700ms/37ms; b-value 800s/mm2 with 17 encoding directions; voxel size 200μm, isotropic. Parameters for glucoCEST: 2D fast spin echo with (MT) and without (M0) magnetization transfer (MT) pulses (TR/TE 3.5s/11.5ms; in plane resolution: 200µm, thickness: 0.8mm; MT pulse: 3μT, 1s). The MTt frequencies offset ranged from -2kHz to +2kHz with 100Hz stepping to detect the glucose protons. Fractional anistropy (FA) and the asymmetry of magnetization transfer ratio (MTRasym) were derived for mapping structural injury and glucose levels. Rats received ~1.1 mCi of 18F-FDG via intravenously to quantitate glucose uptake by PET/CT (Inveon, Siemens). To evaluate microglial activation ~0.8 mCi of 18F-DPA-714 was administered. PET emission data was acquired for 60min. Dynamic images were reconstructed and image analyses was performed (PMOD Technologies Ltd). Animals were euthanized 7 or 13 weeks after the first pFUS treatment. Histological evaluation of brain and tracking of BrdU tagged cells was performed.RESULTS
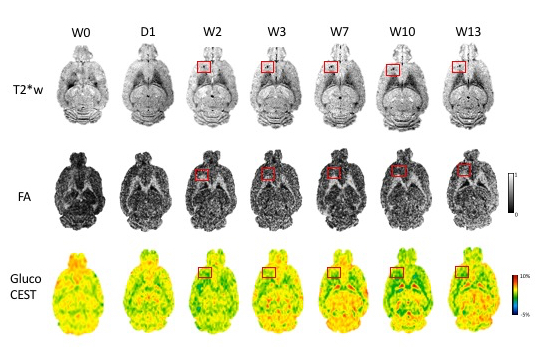
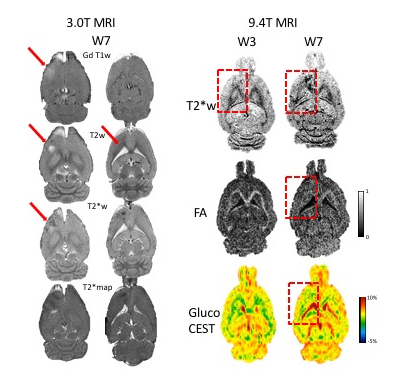
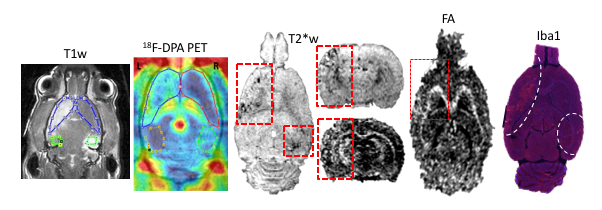
GdT1 images after each sonication demonstrated BBB disruption in the striatum and the hippocampus at 3T. Gd T1 enhancement, T2 and T2* abnormalities were not seen in the brain 1 day post pFUS+MB at 9.4T MRI. Hypointense regions appeared on T2* MRI 2 weeks post pFUS+MB (Figure 1) consistent with development of microhemorrhages within the parenchyma. White matter fiber structure- and gray matter-abnormalities on DTI MRI were detected in regions with the T2* abnormalities suggestive of increased astrogliosis and transient axonal damage (Figure 1). GlucoCEST showed loss of contrast as early as 1 day post pFUS and these changes persisted up to week 13. MRI were found findings following pFUS+MB x 6 demonstrated more pronounced evidence of damage within the parenchyma and atrophy (Figure 2). PET scans revealed a neuro inflammatory response based on elevated uptake of 18F-DPA-714 in the treated regions positive Iba1 staining for activated microglia (Figure 3). BrdU showed evidence of increased neurogenesis in pFUS+MB treated regions.CONCLUSIONS
The long term effects of pFUS+MB exposures in rats revealed that both single and repeated pFUS+MB cause structural injury at the location of sonication up to 13 weeks post treatment based on advanced imaging techniques. Histological evidence showed that associated with the pathological changes observed by MRI and 18F-DPA PET, there was evidence of neuronal damage and loss, neurogenesis and activated microglia. These results suggest the importance of long term monitor of the brain following low intensity pFUS+MB before its clinical translation.Acknowledgements
No acknowledgement found.References
Arvanitis, C. D., et al. 2015 Cavitation-enhanced nonthermal ablation in deep brain targets: feasibility in a large animal model. J Neurosurg:1-10.
Downs, M. E., et al. 2015 Long-Term Safety of Repeated Blood-Brain Barrier Opening via Focused Ultrasound with Microbubbles in Non-Human Primates Performing a Cognitive Task. PLoS One 10(5):e0125911.
Figures