0492
MRS measurements of [2-13C] glycine conversion to glutathione in the liver: A new method of measuring hepatic oxidative stress defences in vivo1NIHR Nottingham Digestive Diseases Unit, Nottingham University Hospitals, University of Nottingham, Nottingham, United Kingdom, 2Sir Peter Mansfield Imaging Center, Physics and Astronomy, University of Nottingham, Nottingham, United Kingdom, 3Newcastle Magnetic Resonance Center, Newcastle University, 4Institute of Cellular Medicine, Newcastle University
Synopsis
With rising incidents of fatty liver disease and metabolic disorder there is a need for biomarkers that can assess progression to steatohepatitis and other forms of liver damage. Oxidative stress in the mitochondria may play a central role in disease progression, with glutathione acting as the main antioxidant. In this study we developed a method previously suggested to monitor hepatic glutathione production in vivo by administering oral [2-13C] labelled glycine and using 13C MRS to measure conversion to glutathione. Following optimization, we tested variability in 8 healthy volunteers over two visits.
Purpose
Systematic review of the global epidemiology indicates that 25% of the population have non-alcoholic fatty liver disease (NAFLD) and 1.5%-6.5% have more progressive form non-alcoholic steatohepatitis (NASH) with consequent cirrhosis, liver cancer and all-cause mortality [1]. Mitochondrial oxidative stress may play a central role in the development of liver injury and inflammation associated with NASH [2], with glutathione acting as the main anti-oxidant. A recent study used 13C MRS to measure the conversion of 13C labelled Glycine to Glutathione as a bio-marker for hepatic oxidative stress in rats, and also provided pilot human data [3]. We have refined this methodology in healthy human in vivo studies and assessed its repeatability.Methods
MR Protocol All spectra were acquired on a Philips Achieva 3T system with Pulseteq 12cm single loop 13C surface coil with quadrature decoupling [4].
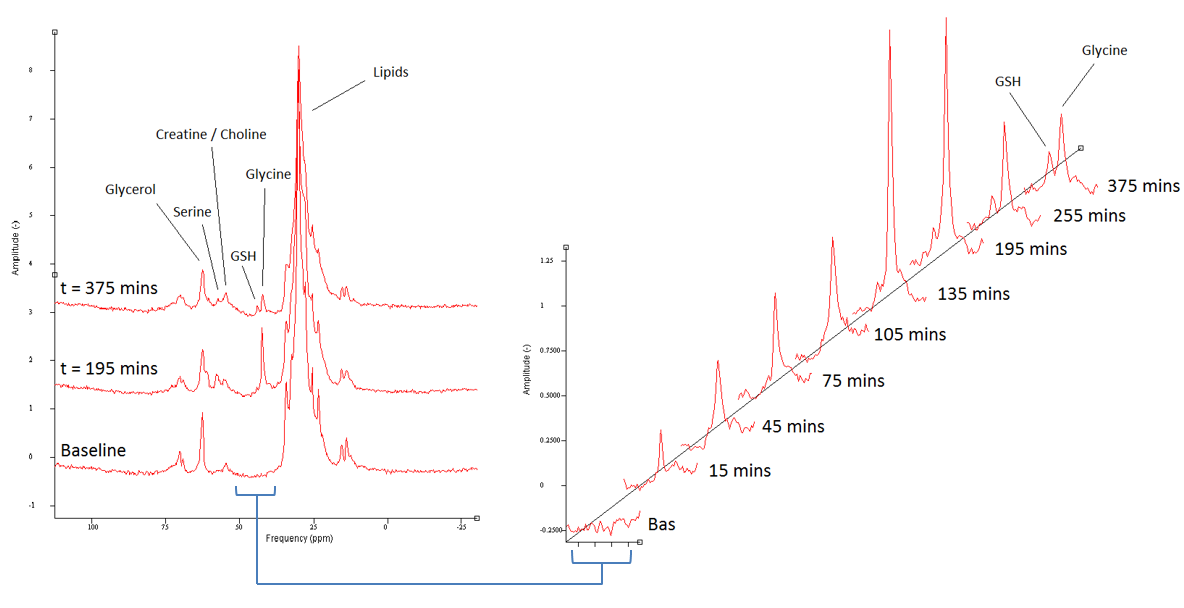
MR Sequence Optimization Initial testing was performed to optimize MR parameters. Due to the fast T2 decay of glycine and glutathione a short FID sampling time (512 data points) with zero filling (1024 data points) provided reduce lipid peaks and good resolution. An adiabatic-half-passage hyperbolic-secant pulse improved the signal compared to standard pulses due to the large volume of interest and B1 inhomogeneity. Narrow band decoupling centred near glycine and glutathione provided the most efficient decoupling of peaks, with broadband requiring longer TR. Optimized scans were acquired in 10 minutes (104 averages, TR = 5500ms).
Test Day Optimization Optimum test day protocol was also explored, including dose size, frequency and number. Pilot in vivo spectra at the 3g doses used previously [3] had low SNR, which was improved by supplying 4g dose every 30 minutes for 3 hours.
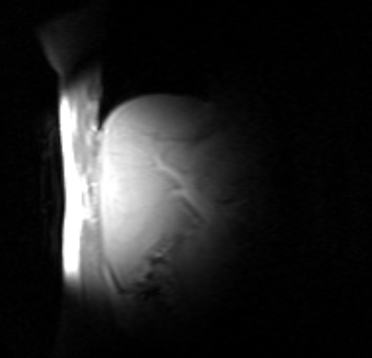
Study Design Repeatability of optimized test-day and MR protocol was tested on 8 healthy participants. Participants visited the test centre twice, with a >7 day washout between visits. On the test day participants arrived following an overnight fast and scout images were acquired. 13C MRS was acquired and baseline blood samples taken. Participants were then given [2-13C] Glycine solution (99% labelled glycine, 4g in 50ml water) at t = 0 mins and every 30 minutes following for 6 doses (arrows on figure 2).
Data Analysis All spectra were phase corrected and peak areas calculated using an in-house Gaussian peak fitting software and scaled to an external reference peak (13C urea). Liver tissue-to-coil distances were determined and used to calculate a B1 receive correction factor (measured empirically from [2-13C] glycine liver phantom).
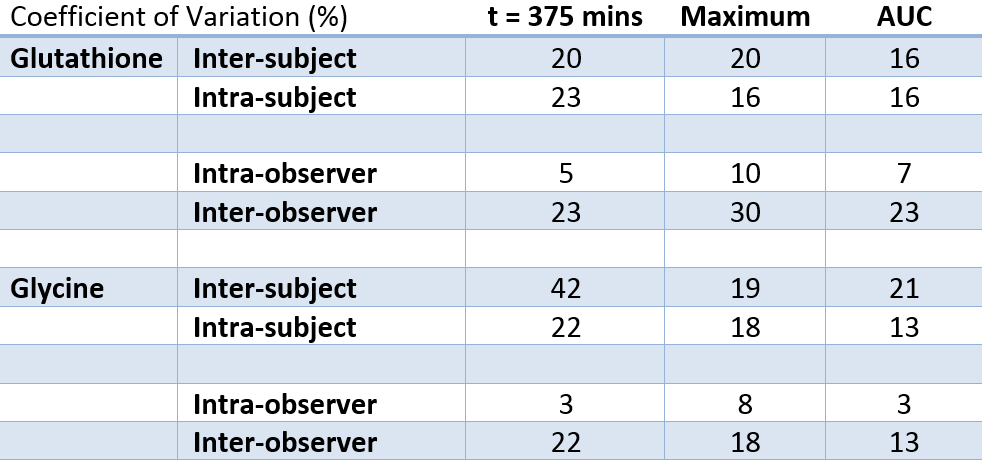
Data were analysed on two separate occasions by the same investigator to assess intra-observer variability, and analysed by an independent untrained analyst to assess inter-observer variability. Values are presented as mean ± standard deviation. Intra-subject (visit 2-visit 1), intra-observer and inter-observer repeatability were assessed at t=375min, maximum and AUC using coefficient of variations (CV%=SD/mean).
Results
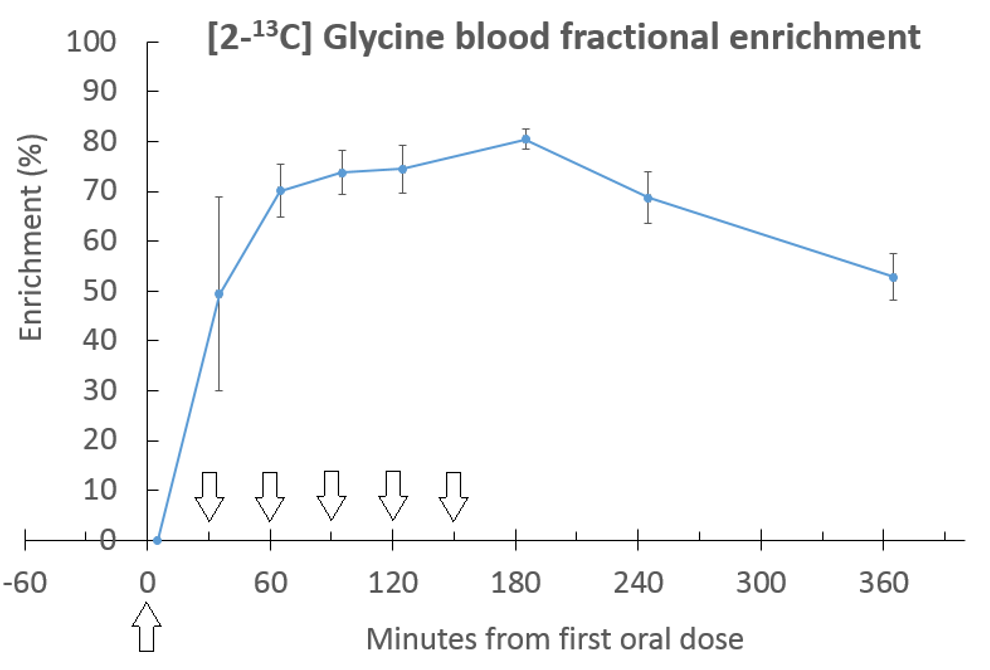
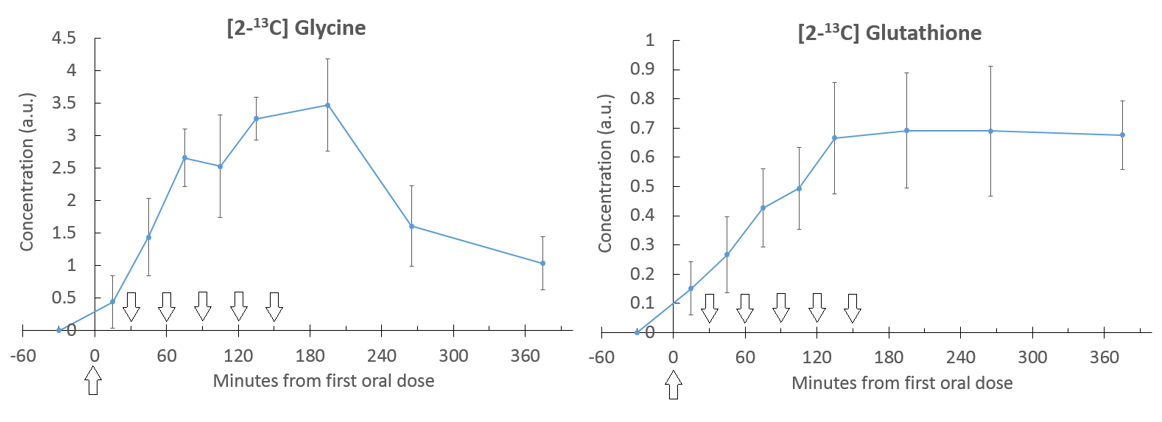
The glycine peak rose steadily after baseline, followed by an increase in glutathione (figure 2), with [2-13C] Serine and Creatine/Choline peaks also appearing at later time points. Blood samples showed steady state of [2-13C] glycine enrichment from 65 minutes to 185 minutes, peaking at 81 ± 2% at 185 minutes, and remaining above 50% enrichment from 35 minutes to the end of the test day (figure 3). Figure 4 shows liver [2-13C] glycine and [2-13C] glutathione concentrations over the test day with significant rises above baseline across all time points (P<0.05). Inter- and intra- subject coefficient of variation and inter- and intra- observer coefficient of variation are shown in table (figure 5).Discussion
Acquisition parameters and the quantity and frequency of glycine oral administration was selected to produce high fractional enrichment, well defined 13C MRS, good hepatic uptake of glycine and steady state conversion to glutathione. The repeatability measurements showed lower variability between visit 1 and visit 2 than between subjects which implies good longitudinal repeatability compared to variability between healthy subject. The intra-observer CV%s (trained spectroscopist) showed very good repeatability in analysis, which was worse when compared to untrained analysist, suggesting spectroscopy expertise are currently required for analysis. Data from this study will be used in future to model glutathione production in the liver and determine liver metabolic rates.Conclusion
Currently [2-13C] glycine-glutathione MRS represents the only available method of assessing hepatic oxidative stress defenses in vivo. As such it provides a unique non-invasive clinically relevant end-point and has potential as a new and much needed method of assessing efficacy of intervention and evaluation of mechanisms underlying NASH. Further studies should use this methodology to compare healthy vs NAFLD patients.Acknowledgements
No acknowledgement found.References
1. Younossi, Z.M., et al., Global epidemiology of nonalcoholic fatty liver disease-Meta-analytic assessment of prevalence, incidence, and outcomes. Hepatology, 2016. 64(1): p. 73-84.
2. Befroy, D.E., et al., Direct assessment of hepatic mitochondrial oxidative and anaplerotic fluxes in humans using dynamic 13C magnetic resonance spectroscopy. Nat Med, 2014. 20(1): p. 98-102.
3. Skamarauskas, J.T., et al., Noninvasive In Vivo Magnetic Resonance Measures of Glutathione Synthesis in Human and Rat Liver as an Oxidative Stress Biomarker. Hepatology, 2014. 59(6): p. 2321-2330.
4. Bawden, S., et al., Increased liver fat and glycogen stores following high compared with low glycaemic index food: a randomized cross over study. Diabetes Obes Metab, 2016.
Figures