0490
Coupling of the glutamate-glutamine cycle rate with both glial and neuronal oxidative metabolism in the visual cortex of the Tupaia belangeri1Laboratory of Functional and Metabolic Imaging (LIFMET), Ecole Polytechnique Fedérale de Lausanne (EPFL), Lausanne, Switzerland, 2Department of Medicine, Visual Cognition Laboratory, University of Fribourg, Fribourg, Switzerland, 3University Hospital Münster, Münster, Germany, 4Department of Radiology, University de Lausanne, Lausanne, Switzerland, 5Department of Radiology, University de Geneva, Geneva, Switzerland
Synopsis
Cerebral function relies on cooperative interaction between neuronal and glial cells. While neuronal oxidative metabolism has been shown to be coupled to the glutamate-glutamine cycle that represents glutamatergic neurotransmission, it remains unclear whether similar coupling occurs for glial oxidative metabolism. We investigated cortical metabolism in vivo using 13C magnetic resonance spectroscopy (MRS) along with infusion of [1,6-13C]glucose during continuous stimulation of the tree shrew visual cortex (V1). Data indicate that both neuronal and glial oxidative metabolism scale with the glutamate-glutamine cycle.
Purpose
Brain activity-associated energy requirements are satisfied by efficient supply of glucose and oxygen from the blood stream. Despite the effort to understand the compartmentalization of cerebral energy metabolism between neurons and astrocytes, the actual glial contribution to oxidative metabolism is still matter of debate [1]. In this study we took advantage of the columnar characteristics of the Tupaia belangeri primary visual cortex (V1) to measure metabolic changes induced by continuous stimulation of V1.Methods
9 tree shrews (7 females, 200±56
g, 0.5-6 years old, and 2 males, 211±25
g, 6 months old) under light isoflurane anesthesia (0.5-0.7%) were
randomly allocated to experimental groups (n=5 in the
stimulation and n=4 in the resting group, respectively). All
acquisitions were performed on a 14.1 T/26 cm horizontal bore magnet with
homebuilt 1H quadrature transmit/receive and 1H
quadrature transmit/receive-combined 13C linearly polarized surface
coils. After anatomical magnetic resonance imaging (MRI), each animal underwent the three MR modalities,
namely blood oxygenation
level-dependent functional MRI
(BOLD fMRI), 1H and 13C magnetic resonance spectroscopy
(MRS) localized in V1, either at rest or during visual stimulation. The
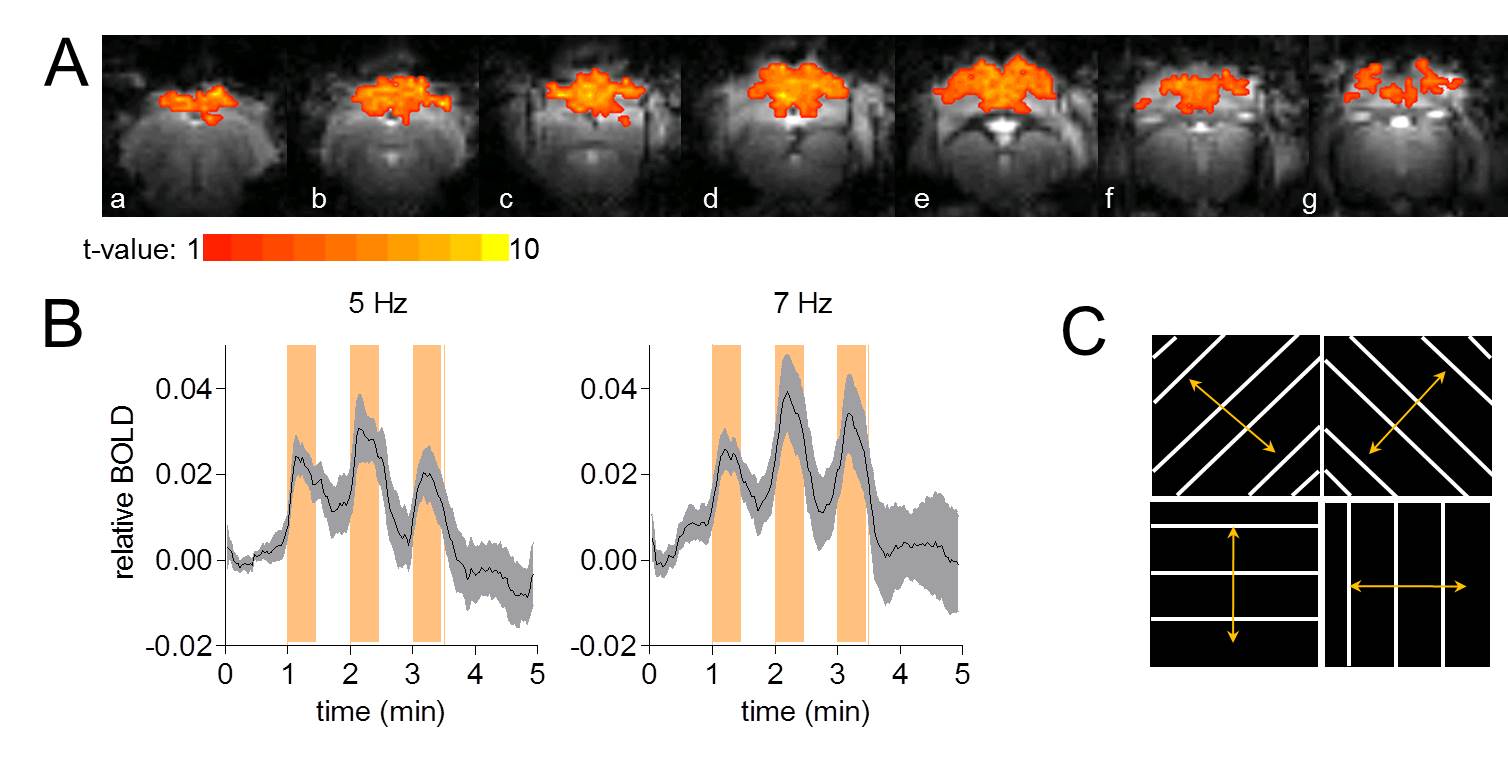
visual stimulation device was composed of 2 matrices of 64 light-emitting
diodes (LED) each that allows delivering visual stimuli at high magnetic field.
The paradigm consisted of delivering lines in 4 orientations and 2
directions (Figure 1C) at 5 and 7 Hz randomly switched. Each pattern with spatial frequency
0.04-0.05 cycle/degree was presented for at least 5 s. The
luminosity contrast was set to maximum, corresponding to 48 ± 4 LUX at 1 cm distance from the eyes of the animal. fMRI
was performed using gradient echo echo planar imaging (GE-EPI) (TR/TE=2.0
s/18 ms; FOV=23×23 mm2; matrix=64×64; slice thickness=0.8 mm ;
bandwidth=200 kHz) and allowed
mapping cortical activation using the paradigm 30 s ON – 30 s OFF at 5 Hz or 7
Hz. After FAST(EST)MAP
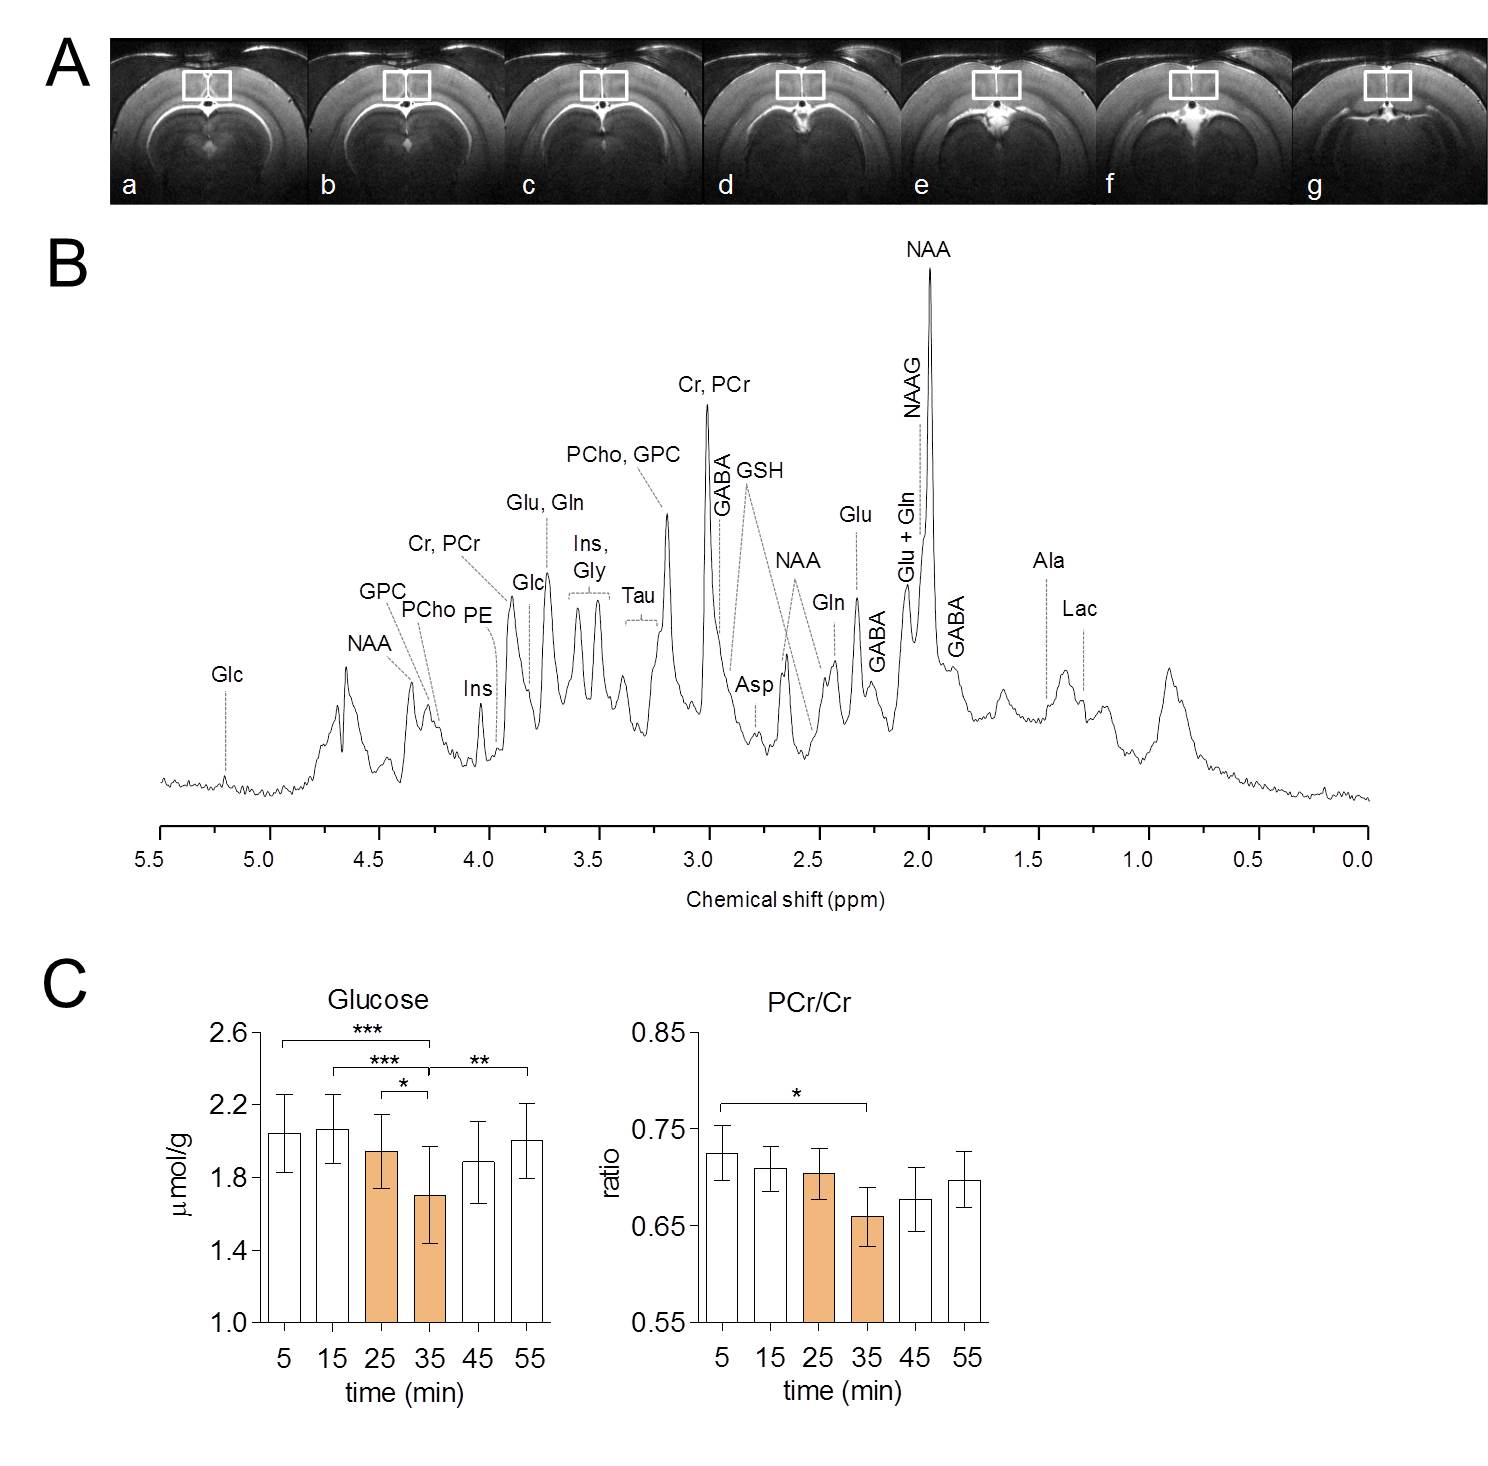
shimming, V1-localized 1H functional MRS (fMRS) and 13C
MRS (during infusion of [1,6-13C]glucose) were performed with
SPECIAL [2] (TR=4 s and TE=2.8 ms,
VOI = 35 µL) and semi-adiabatic distortionless enhancement by polarization transfer
(DEPT) combined with 3D-ISIS for 1H localization [3] (VOI = 105 µL), respectively. 1H fMRS was performed during 20 min rest, 20
min of continuous stimulation (at 5 and 7 Hz randomly switched) and 20 min recovery period, and13C
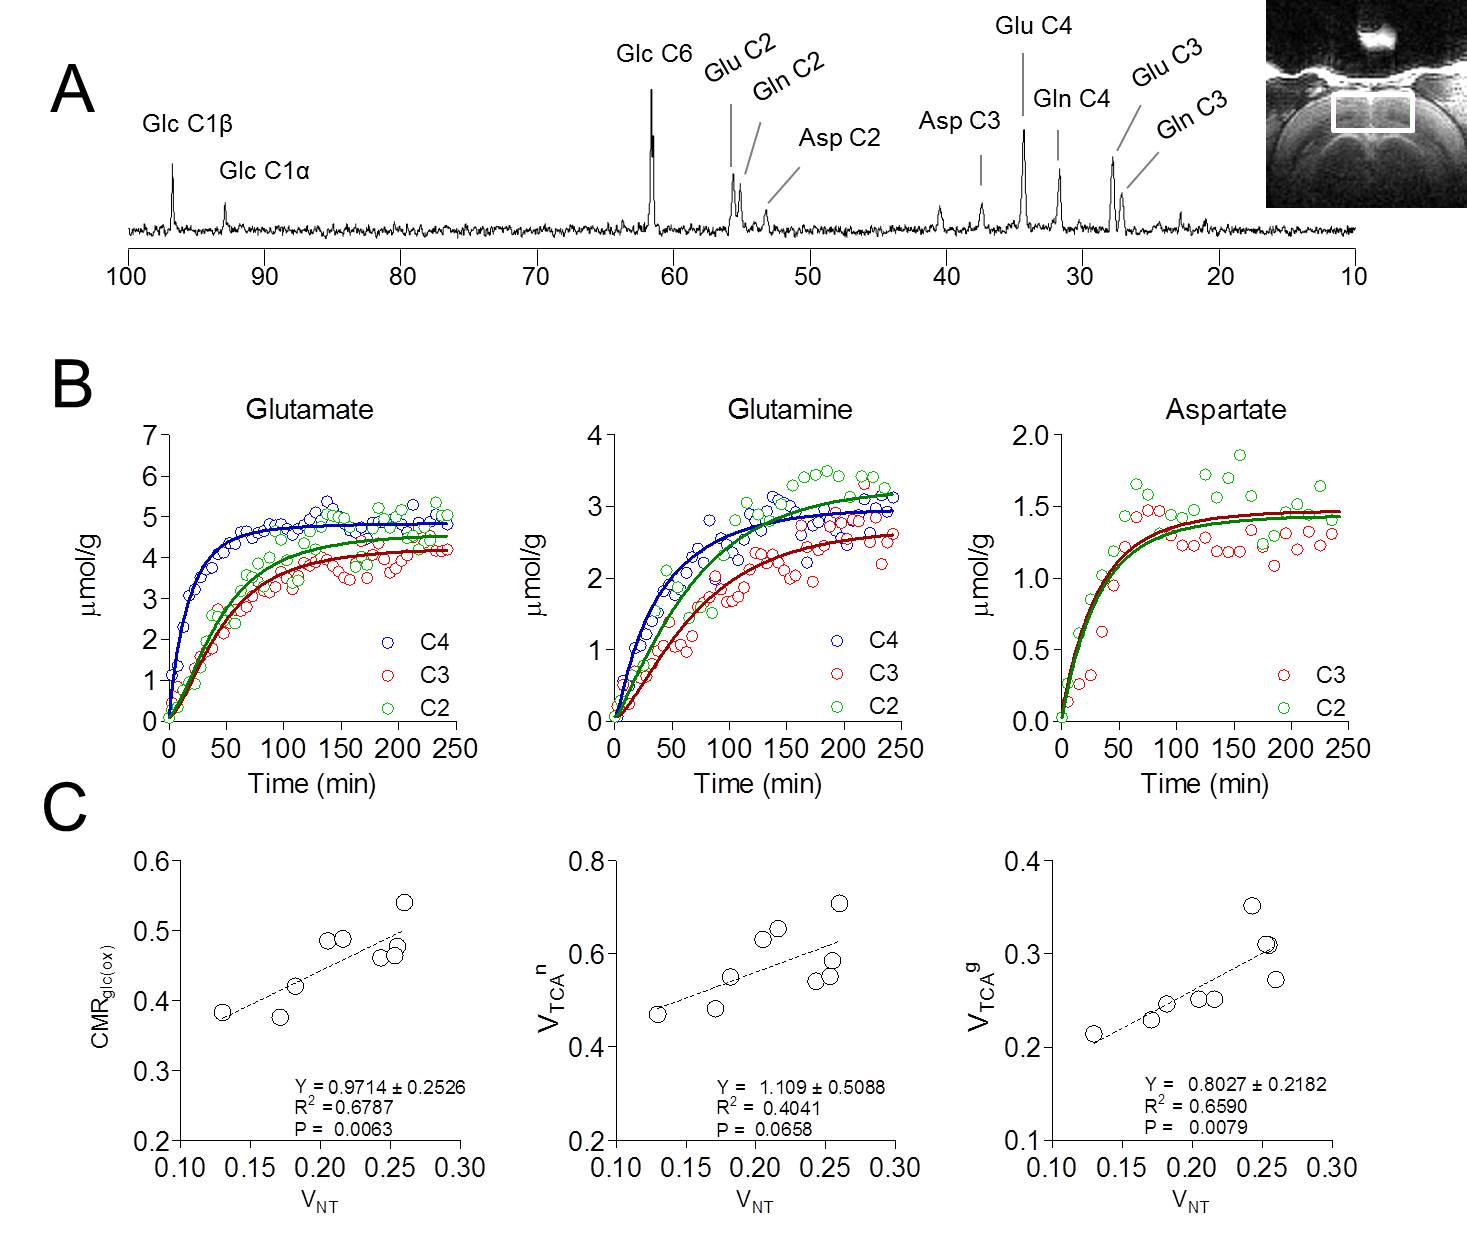
MRS was performed either at rest or during 4 h of continuous stimulation (at 5 and 7 Hz randomly switched). LCModel was used for
analysis of both 1H and 13C spectra [4]. The scaling of 13C fractional
enrichment (FE) curves was based on MRS of brain extracts [5]. Data was fitted to a two-compartment model and
variance of parameters was determined by Monte-Carlo analyses [5][6]. Results
Visual stimulation resulted in a relatively large activated area in V1 that allowed localized MRS (Figure 1A-B). Cortical brain activity resulted in a decrease in both brain glucose concentration (-17% ; -0.34 µmol/g ; P<0.001 one-way ANOVA with Tuckey post-test for multiple comparisons) and phosphocreatine/creatine ratio (-8% ; -0.07; P<0.05) after 15 minutes of stimulation onset (Figure 2). Total creatine concentration did not vary during stimulation as compared to rest. The combinations of high detection sensitivity along with robust cortical activation state allowed observing marked changes in the measured metabolic rates by 13C MRS at both individual (Figure 3) and group levels. At the individual level, close relationships between the neurotransmission rate (VNT) and total cerebral metabolic rate of glucose oxidation (CMRglc(ox), R2=0.679, P=0.006), glial (VTCAg, R2=0.66, P=0.008) and neuronal (VTCAn, R2=0.40, P=0.066) oxidative metabolism was measured (Figure 3C). At the group level, 20% increase in VNT (∆VNT +0.038±0.042 µmol/g/min, P=0.077, permutation test and Holm-Bonferroni correction for multiple comparisons) resulted in a 24% (∆VTCAg=0.063±0.057 µmol/g/min; P=0.007) and 12% (∆VTCAn=0.061±0.032 µmol/g/min; P<0.001) increase in glial and neuronal TCA cycle activity, respectively, resulting in a net 14% increase in CMRglc(ox) (∆CMRglc(ox) = 0.058±0.032 µmol/g/min; P<0.001).Discussion
Taking advantage of the columnar characteristics of tree shrew visual cortex rendered possible continuous stimulation of V1. The fact that we performed continuous stimulation kept metabolism at steady-state during stimulation. Cortical brain activity resulted in a significant increase in CMRglc as assessed with both 1H fMRS and 13C MRS, which was associated to an increase of similar amplitude of both glial and neuronal oxidative metabolism that scaled with the glutamate-glutamine cycle rate.Conclusion
These results support the active partnership between neurons and astrocytes as both respond to and support glutamatergic neurotransmission by increasing in the same proportions their oxidative metabolism.Acknowledgements
This work was supported by National Competence Center in Biomedical Imaging, Swiss National Science Foundation, and Centre d’Imagerie BioMédicale of the UNIL, UNIGE, HUG, CHUV, EPFL, the Leenaards and Jeantet Foundations.References
[1] Lanz B, Gruetter R, Duarte J. Metabolic Flux and Compartmentation Analysis in the Brain In vivo. Front Endocrinol. 2013;: p. 4:156. doi: 10.3389/fendo.2013.00156.
[2] Mlynárik V, Gambarota G, Frenkel H, Gruetter R, Localized short-echo-time proton MR spectroscopy with full signal-intensity acquisition. Magn Reson Med. 2006, 56(5):965-70
[3] Henry P, Tkác I, Gruetter R. 1H-localized broadband 13C NMR spectroscopy of the rat brain in vivo at 9.4 T. Magn Reson Med. 2003;: p. 50(4):684-92.
[4] Henry P, Oz G, Provencher S, Gruetter R. Toward dynamic isotopomer analysis in the rat brain in vivo: automatic quantitation of 13C NMR spectra using LCModel. NMR Biomed. 2003;: p. 16(6-7):400-12.
[5] Duarte J, Lanz B, Gruetter R. Compartmentalized Cerebral Metabolism of [1,6-(13)C]Glucose Determined by in vivo (13)C NMR Spectroscopy at 14.1 T. Front Neuroenergetics. 2011;: p. 3:3. doi: 10.3389/fnene.2011.00003. eCollection 2011.
[6] Sonnay S, Duarte J, Just N, Gruetter R. Compartmentalised energy metabolism supporting glutamatergic neurotransmission in response to increased activity in the rat cerebral cortex: A 13C MRS study in vivo at 14.1 T. J Cereb Blood Flow Metab. 2016;: p. pii: 0271678X16629482. [Epub ahead of print].
Figures