0488
DIrect EStimation of 17O MR ImageS (DIESIS) for CMRO2 Quantification in the Human Brain with Partial Volume Correction1Dept. of Radiology, Medical Physics, Medical Center – University of Freiburg, Freiburg, Germany, 2German Cancer Consortium (DKTK), Heidelberg, Germany, 3German Cancer Research Center (DKFZ), Heidelberg, Germany
Synopsis
Direct 17O-MRI enables quantification of cerebral metabolic rate of oxygen consumption (CMRO2). The low MR sensitivity of the 17O nucleus prevents pixel-wise CMRO2 quantification and the fast T2*≈2ms decay leads to partial volume artifacts. In this work the DIESIS method is proposed, which performs a direct least squares estimation of the 17O‑MR signal in image regions (parcels) obtained from coregistered 1H data. CMRO2 values of 1.38-1.87µmol/gtissue/min and 0.51-0.77µmol/gtissue/min were found with DIESIS in gray and white matter consistent with rates from 15O-PET studies. With DIESIS, CMRO2 maps of high resolution can be reconstructed and partial volume artifacts can be reduced.
Introduction
Cerebrovascular, neurodegenerative diseases and tumors are coupled to abnormalities in brain oxygen metabolism, which manifest in alternated cerebral metabolic rate of oxygen consumption (CMRO2). CMRO2 can be quantified with radioactive 15O‑PET [1], and direct or indirect 17O-MRI methods. In direct 17O-MRI [2–5], CMRO2 rate can be reliably quantified by fitting a pharmacokinetic model to the 17O‑MR signal dynamic during and after the administration of 17O-enriched gas [5].
Besides the intrinsically low MR sensitivity of 17O (1.1·10-5 compared to 1H), 17O‑MRI is limited by partial volume artefacts mainly caused by the fast T2* decay. Partial volume correction (PVC) can be achieved with the ‘geometric transfer matrix’ (GTM) algorithm [4]. In this study we present an alternative correction scheme: DIrect EStimation of the MR ImageS (DIESIS) without Fourier transformation (FT) of k‑space signal into image space, which was motivated by direct imaging of functional networks in functional MRI (fMRI) [6].
Material and Methods
17O data sets of one volunteer were acquired in two dynamic17O-MR experiments [5], denoted by Exp1/Exp2, on clinical 3T MR system (Siemens Magnetom TIM Trio) with a custom-built Tx/Rx 17O head coil and a 3D ultrashort-TE density-adapted projection sequence [7]. 2.5 liters of 70%‑enriched 17O gas (NUKEM Isotopes Imaging) were inhaled, and the nominal spatial resolution was Δx=10/8mm at a temporal resolution of 1min.
At clinical field strengths, the low SNR of the 17O data hampers pixel-wise CMRO2 quantification, so that the signal average over larger regions-of-interest (ROIs) has to used [3-5]. Thus, CMRO2 values can only be computed from a small subset of large regions with mixing of tissues such as white (WM) and gray (GM) matter.
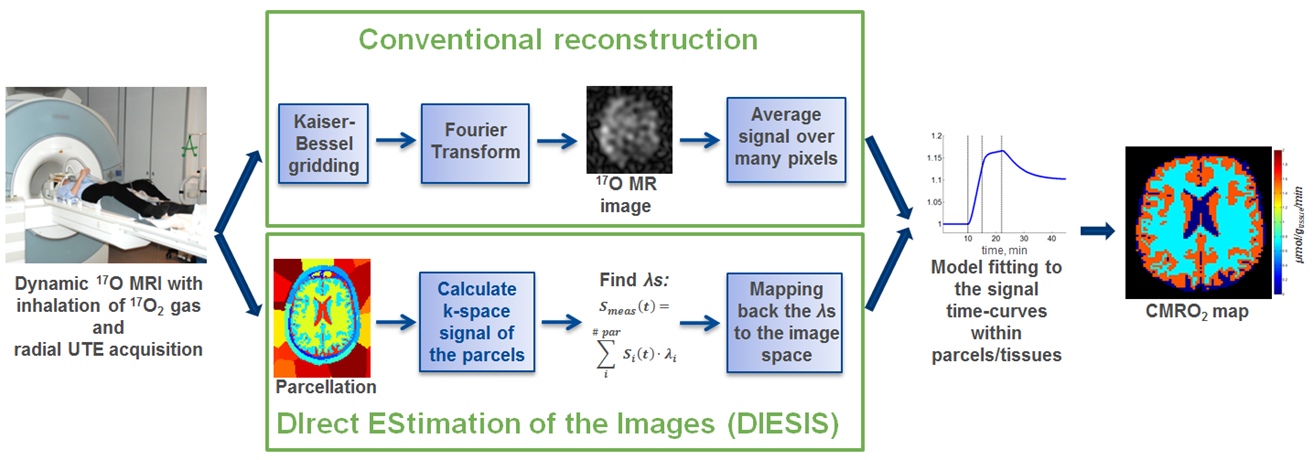
Radially acquired images are typically reconstructed by Kaiser-Bessel (KB) gridding followed by FT (Fig.1, upper part). We propose a new method (DIESIS; Fig.1, bottom part) that avoids full reconstruction of MR images (Fourier encoding) and directly estimates the 17O signal based on parcellation (segmentation of the 3D image to a predefined number of ROIs on the basis of a coregistered 1H image). A similar method was originally discussed for application in fMRI direct imaging of functional networks [6], where a few hundred of predefined parcels were used. Here we define 3 parcels for WM, GM and cerebrospinal fluid (CSF) in the brain and 180 outside the brain (including regions outside the head) to minimize the influence of susceptibility artifacts, volunteer motion under radial sampling and coil inhomogeneities.
DIESIS models the MR image as the sum over parcel’s masks $$$\mathit{M_{i}(r)}$$$ weighted by the intensity values $$$\mathit{\lambda_{i}}$$$:
$$I(\textbf{r})=\sum_i^{\sharp\space{parcels}}M_i(\textbf{r})\cdot\lambda_i.$$
The k-space signal for one spoke ($$$\mathit{sp}$$$) in radial acquisition of ith parcel is then:
$$S^{sp}_i(t)=\int{}dr\cdot{}M_i(\textbf{r})\cdot{}e^{i\cdot\overline{\textbf{r}}\cdot\overline{\textbf{sp}}\cdot\gamma\cdot{}t}e^{\frac{-t}{T_2^*}},$$
where the last term with experimentally determined $$$T_{2}^{*}=2ms$$$ [8] is optionally included for explicit PVC.
The measured 17O-MRI k-space data ($$$\mathit{S_{meas}}$$$) is expressed as a linear combination of the calculated k-space signal of the parcels $$$\mathit{S_{i}(t)}$$$ for the particular k-space trajectories:
$$S_{meas}(t)=\sum_i^{\sharp\space{parcels}}S_i(t)\cdot\lambda_i.$$
The intensity values $$$\mathit{\lambda_{i}}$$$, which are to be mapped back to image space, are then obtained by direct least squares estimation without Fourier encoding by minimization of:
$$LL(\lambda)=\mid\mid{}S_{meas}(t)-\sum_i^{\sharp\space{parcels}}S_i(t)\cdot\lambda_i\mid\mid{}_{2}.$$
DIESIS was applied to each raw data set of the 17O MR time-series, and CMRO2 values were extracted from the signal dynamics (Fig.1).
Results and Discussion
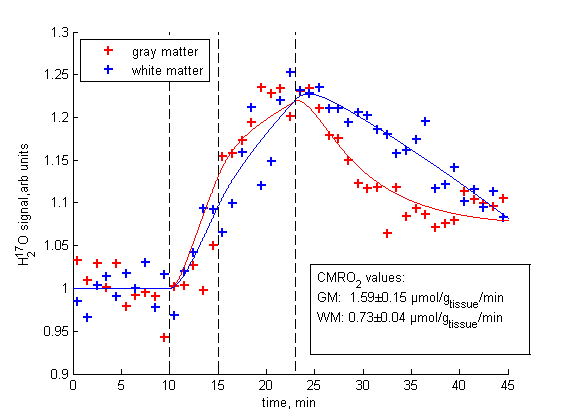
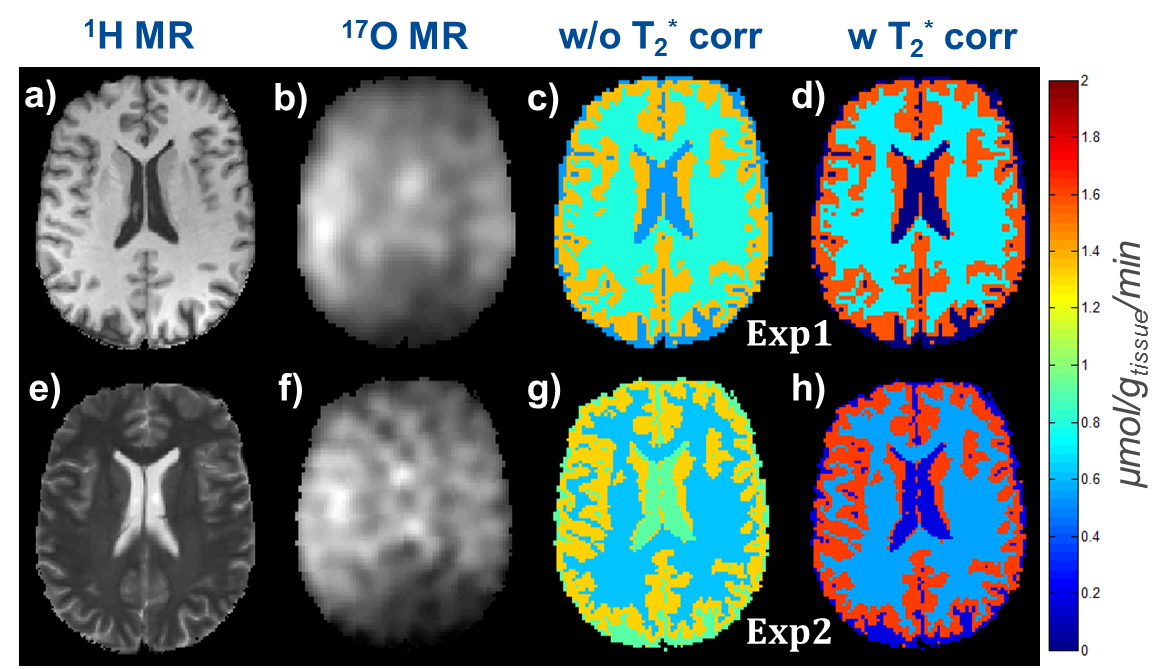
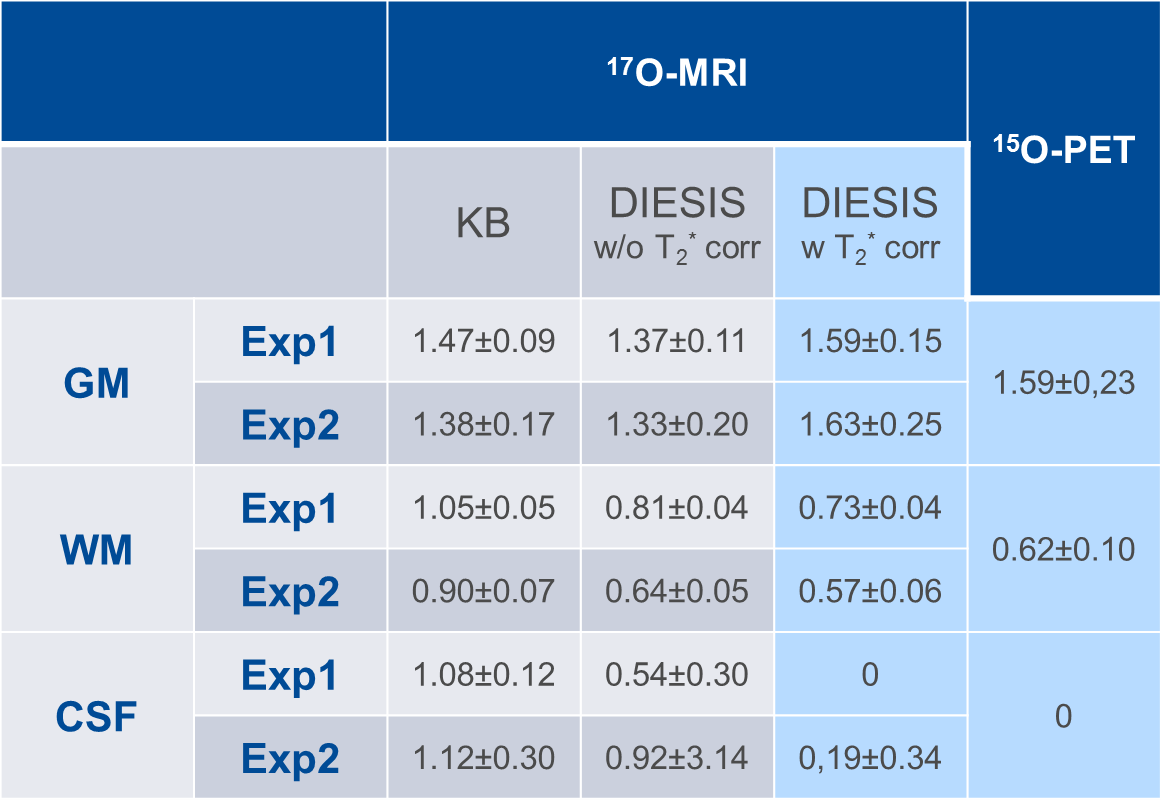
Based on DIESIS, the 17O-MR signal dynamics in WM and GM could be successfully fitted to the pharmacokinetic model [2,5] (Fig.2), and although the 17O-MRI is corrupted with noise (Fig.3b,f), CMRO2 values (Fig.3c,d,g,h) for both 17O‑MR experiments were in good agreement with the results of 15O‑PET studies (Tab.1).
CMRO2 values obtained from conventional KB gridding are 45-70% higher in WM and 8-15% lower in GM as compared to 15O-PET studies (Tab.1). The DIESIS method without explicit PVCs provided better values for WM (3-31% overestimation). DIESIS including fast T2* relaxation yielded CMRO2 values within 0-18% of the 15O-PET values [1]. Moreover, DIESIS allows suppressing the signal increase in CSF, which leads to substantially lower CMRO2 values in CSF, where no oxygen metabolism is expected. PVCs of the CMRO2 values with DIESIS method are in better correspondence with 15O-PET studies, compared to the results of GMT method [4].
Conclusions and Outlook
DIESIS allows for a direct estimation of 17O-MR signal and CMRO2 quantification in dynamic 17O-MR experiments. The use of high-resolution proton data in combination with compensation for fast T2* relaxation provides successful PVC. Parcels could also be considered not as BMs, but with intensities representing relative tissue content so that PVCs can be applied on a sub-voxel level. In future measurements in tumor patients, parcellation could be refined to different tumors regions so that tumor heterogeneity can be adequately reflected.Acknowledgements
Support from NUKEM Isotopes Imaging is gratefully acknowledgedReferences
[1] Leenders KL, Perani D, Lammertsma AA, Heather JD, Buckingham P, Healy MJ, Gibbs JM, Wise RJ, et al. Cerebral blood flow, blood volume and oxygen utilization. Normal values and effect of age. Brain 1990;113:27–47.
[2] Atkinson IC, Thulborn KR. Feasibility of mapping the tissue mass corrected bioscale of cerebral metabolic rate of oxygen consumption using 17-oxygen and 23-sodium MR imaging in a human brain at 9.4 T. Neuroimage 2010;51:723–733.
[3] Hoffmann SH, Begovatz P, Nagel AM, Umathum R, Schommer K, Bachert P, Bock M. A measurement setup for direct 17O MRI at 7 T. Magn. Reson. Med. 2011;66:1109–1115.
[4] Hoffmann SH, Radbruch A, Bock M, Semmler W, Nagel AM. Direct 17O MRI with partial volume correction: first experiences in a glioblastoma patient. MAGMA 2014;27:579–87.
[5] Kurzhunov D, Borowiak R, Hass H, Wagner P, Krafft AJ, Timmer J, Bock M. Quantification of oxygen metabolic rates in Human brain with dynamic 17O MRI: Profile likelihood analysis. Magn. Reson. Med. 2016;00:1–11.
[6] Wong EC. Direct imaging of functional networks. Brain Connect. 2014;4:481–6.
[7] Nagel AM, Laun FB, Weber M-A, Matthies C, Semmler W, Schad LR. Sodium MRI using a density-adapted 3D radial acquisition technique. Magn. Reson. Med. 2009;62:1565–1573.
[8] Borowiak R, Groebner J, Haas M, Hennig J, Bock M. Direct cerebral and cardiac 17O-MRI at 3 Tesla: initial results at natural abundance. MAGMA 2014;27:95–99.
Figures