0486
Self-gated 23Na-MRI of human lung with separate reconstruction of two respiratory states at 7T1Medical Physics in Radiology, German Cancer Research Center (DKFZ), Heidelberg, Germany, 2Institute of Radiology, University Hospital Erlangen, Erlangen, Germany, 3Diagnostic and Interventional Radiology, University Hospital Heidelberg, Heidelberg, Germany
Synopsis
23Na-MRI at 7T can give valuable insights into lung physiology because 23Na signals are linked to sodium-potassium-ATPase and to fluid balance. However, low NMR sensitivity and low in-vivo concentrations of Na+ ions in-vivo limit the achievable spatial resolution and prolong acquisition times. In this study a retrospective self-gated reconstruction was used to reduce motion artifacts in free-breathing 23Na-MRI of human lung. The presented method allows for the reconstruction of 23Na images which correspond to two respiratory motion states for free-breathing volunteers and patients. 3D Dictionary-Learning Compressed-Sensing reconstruction was shown to markedly reduce image noise.
Introduction
MRI of human lung is challenging due to low spin density, susceptibility artifacts, and physiological motion1. Compared to proton MRI, sodium MRI (23Na-MRI) is less sensitive to susceptibility effects due to the lower Larmor frequency. Moreover, 23Na-MRI yields valuable information on lung physiology because 23Na signals are linked to sodium-potassium-ATPase and to fluid balance. Hence, 23Na-MRI has been proposed for investigating lung tumor viability and potentially treatment response2, as well as for investigating fluid distribution in edematous lung1,3,4. However, low NMR sensitivity and low in-vivo concentrations of Na+ ions in-vivo limit the achievable spatial resolution.
Progress in 23Na-MRI techniques like ultra-high field, dedicated hardware, UTE sequences, and compressed-sensing reconstruction algorithms expand the quality of 23Na-MRI of human lung5,6. However, low 23Na concentrations prolong acquisition times beyond human breath-hold capabilities.
In this study we use a golden angle sampling scheme with retrospective self-gated reconstruction7 to reduce motion artifacts in free-breathing 23Na-MRI of human lung. This enables the reconstruction of two motion states, providing insights into variations of 23Na distribution during respiration. Resulting under-sampled data subsets are reconstructed using a 3D Dictionary-Learning Compressed-Sensing reconstruction (3D-DLCS) to reduce image noise8. In-vivo results with tacq=30min 20s are presented.
Methods
Measurements were performed on a 7T whole-body MR scanner9 using a 4-port elliptically-shaped birdcage10 (length: 35cm). Phantom and in-vivo 23Na images (healthy volunteer, female, 27y/o) were acquired with a 3D density-adapted radial sampling scheme11 and a golden angle distribution of projections12.
Parameters: tp=2ms, TE/TR=1.05ms/20ms, nominal resolution=(4mm)3, FA=44°, tacq=30min 20s, N=18200 projections, reconstructed FOV=(400mm)3, fivefold short-term averaging.
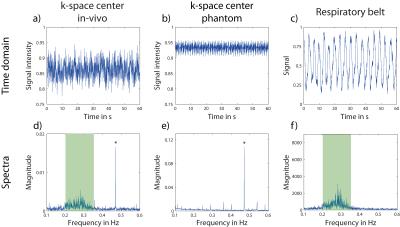
After averaging, time-resolved intensity at k-space center was determined for every projection (Scenter,p=1…N, Δtcenter=5∙TR=100ms). For comparison (Fig.1a-c), an external signal from a respiratory belt positioned on the chest was obtained (Δtexternal=20ms).
A 1D Fourier transform (FT) along k-space center points was performed for phantom and in-vivo MRI data, as well as along data points from the respiratory belt to evaluate corresponding frequency spectra. The relevant frequency domain for respiration (0.1Hz-0.6Hz) is compared for all three datasets (Fig.1d-f). The frequency distribution around 0.27Hz in the in-vivo k-space center spectrum can be attributed to respiratory motion, as it does not appear in the phantom spectrum but is visible in the respiratory belt data.
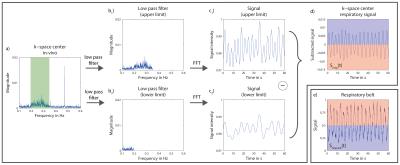
The frequency band from ca. 0.2Hz to ca. 0.35Hz is used to obtain the respiratory signal Sresp(t) from the data acquired for 23Na-MRI of human lung (Fig.2). Each projection is assigned to either the inspiratory or the expiratory data subset (Dinsp if Sresp(t)<0, Dexp if Sresp(t)>0).
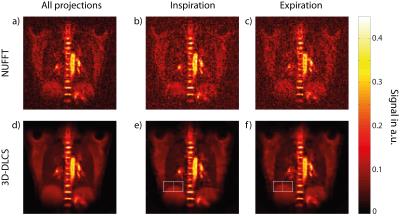
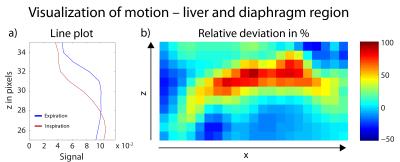
Under-sampled data subsets with numbers of projection Ninspiration=9063 and Nexpiration=9137, as well as the full dataset (N=18200) are reconstructed with a Nonuniform Fast Fourier Transform (NUFFT)13 and with 3D-DLCS (Fig.3). Spatial intensity variation due to respiration is analyzed for the region of liver and diaphragm (Fig.4).
Results
The time-resolved intensities in k-space center for in-vivo and phantom data are shown in (Fig.1a,b) together with the corresponding spectra (Fig.1d,e). The comparison of phantom and in-vivo spectra suggests that the distribution between ca. 0.2Hz and ca. 0.35Hz can be assigned to respiratory motion. This is confirmed by the spectrum from the respiratory belt (Fig.1f).
Respiratory signal Sresp(t), which is
extracted from the same data acquired for 23Na image reconstruction,
corresponds very well to signal recorded by the respiratory belt (Fig.2d,e). During
expiration (blue), signal from respiratory belt is low, while k-space center signal
is high because more 23Na containing tissue is located in the
sensitive part of the coil and vice versa for inspiration (red).
Motion-separated lung images reconstructed with NUFFT show a considerable degradation of image quality compared to the NUFFT image reconstructed with all projections. The 3D-DLCS reconstruction, however, is less prone to higher under-sampling as it occurs when different motion states are separated. Generally, lung images reconstructed with 3D-DLCS exhibit markedly reduced image noise compared to NUFFT images. The effect of respiratory motion is illustrated exemplarily for the region of liver and diaphragm (Fig.4).
Discussion & Conclusion
Retrospective self-gated reconstruction of 23Na datasets of human lung is feasible for the setup and sequence parameters used here, making a respiratory sensor obsolete. This allows for the reconstruction of 23Na images which correspond to different motion states for free-breathing volunteers and patients. In the present work the number of respiratory states is limited to two due to the low SNR of 23Na-MRI. Iterative reconstruction, like 3D-DLCS, was shown to reduce image noise and could enable the reconstruction of additional motion states. Reduced motion blurring and image noise may permit the detection of smaller lesions, which could be of interest when applying 23Na-MRI to studies of lung pathologies.Acknowledgements
This work was funded in part by the Helmholtz Alliance ICEMED - Imaging and Curing Environmental Metabolic Diseases, through the Initiative and Networking Fund of the Helmholtz Association.
This study was supported by grants from the Bundesministerium für Bildung und Forschung (BMBF) to the German Center for Lung Research (DZL) (82DZL00401 and 82DZL004A1).
References
1) Kauczor, H.U. & Kreitner, K.F. Eur Radiol (1999) 9: 1755-64
2) Henzler, T. et al. Rofo (2012) 184: 340-4
3) Kundel, H.L. et al. Magn Reson Med (1988) 6: 381-9
4) Lancaster, L. et al. Magn Reson Med (1991) 19: 96-104
5) Madelin, G. & Regatte, R.R. J Magn Reson Imaging (2013) 38: 511–29
6) Lustig, M. et al., Magn Reson Med (2007) 6: 1182-95
7) Feng, L. et al. Magn Reson Med (2014) 72: 707-17
8) Behl, N.G.R. et al. Magn Reson Med (2016) 75: 1605-16
9) MAGNETOM 7T, Siemens Healthcare, Erlangen, Germany
10) Platt, T. et al. Proc Intl Soc Mag Reson Med (2016) 24: 3977
11) Nagel, A.M. et al. Magn Reson Med (2009) 62: 1565-73
12) Chan, R.W. et al. Magn Reson Med (2009) 61: 354-63
13) Fessler, J.A. et al. Trans Signal Process (2003) 2: 560-74
Figures


