0484
Variation of RF heating around deep brain stimulation leads during 3.0 T MRI in fourteen patient-derived realistic lead models: The role of extracranial lead management1Radiology, Massachusetts General Hospital, Brookline, MA, United States, 2Neurosurgery, Albany Medical Center, 3Radiology, UCSF School of Medicine, 4Neurological Surgery, University of California San Francisco, 5Life Science Engineering, Institute of Medical Physics and Radiation Protection, Mittelhessen University of Applied Sciences (THM), 6Radiology, Massachusetts General Hospital, 7Massachusetts General Hospital, Charlestown, MA, United States
Synopsis
Post-operative MRI of patients with deep brain stimulation (DBS) implants is useful to assess complications and diagnose comorbidities. More than one third of medical centers, however, do not perform MRI on this patient population due to safety risks. Almost nothing is known about the variation and extent of RF heating of DBS leads during MRI at higher fields (>1.5 T) in a real patient population. Here we report the results of SAR calculations around DBS leads in a cohort of fourteen realistic DBS lead geometries. We also present preliminary results of applying an intra-operative lead management technique to reduce SAR during 3.0 T MRI.
Purpose
Post-operative MRI of patients with deep brain stimulation (DBS) implants is useful to assess complications and diagnose comorbidities; however, more than one third of medical centers do not perform MRI on this patient population due to safety risks. One of the major concerns is the radiofrequency (RF) heating due to the so-called “antenna effect”, which causes the specific absorption rate (SAR) of RF energy to substantially amplify at the implant’s tip [1, 2]. Recently we demonstrated that the SAR deposition at 3.0 T can be reduced by up to 140 fold applying a clinical lead management strategy that optimizes the routing of the extracranial leads [3]. An important step toward propagating this methodology into clinical practice is represented by a reliable measure of SAR deposition at DBS electrodes in realistic patient populations. Here we report the results of SAR calculations around DBS leads in a cohort of fourteen realistic lead models. We also present preliminary results of application of an intra-operative lead management technique to reduce local SAR amplification during 3.0 T MRI of patients with DBS implants.Methods
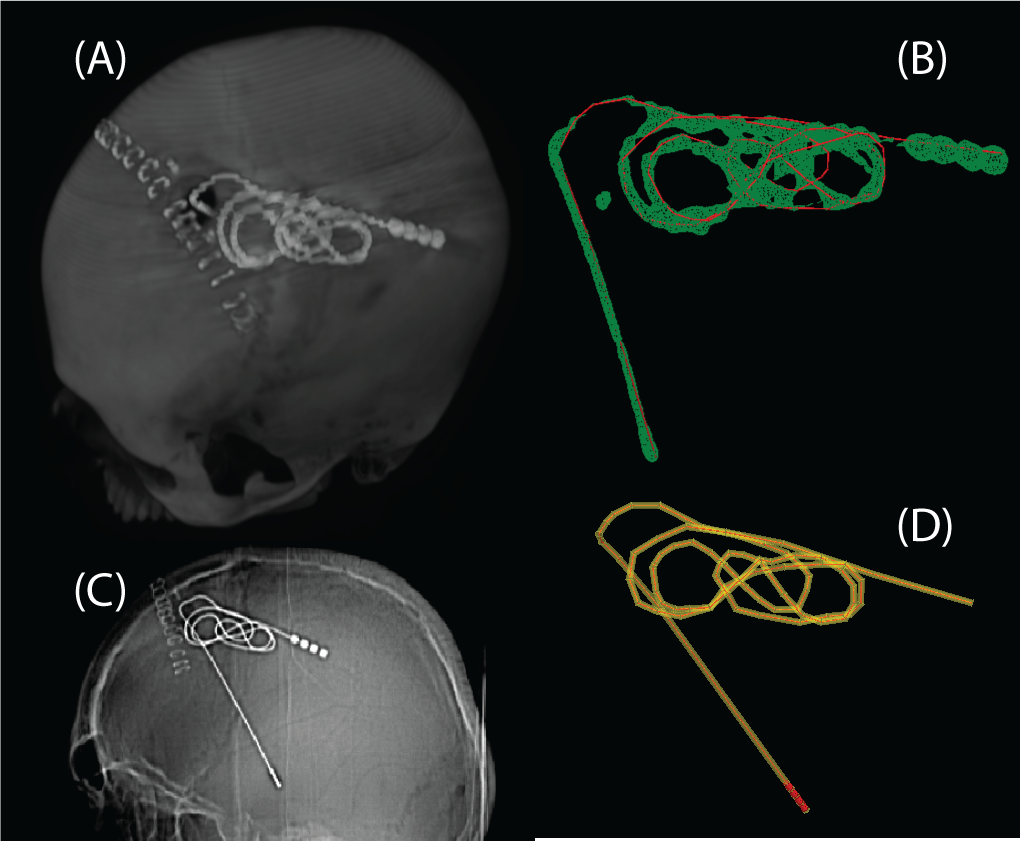
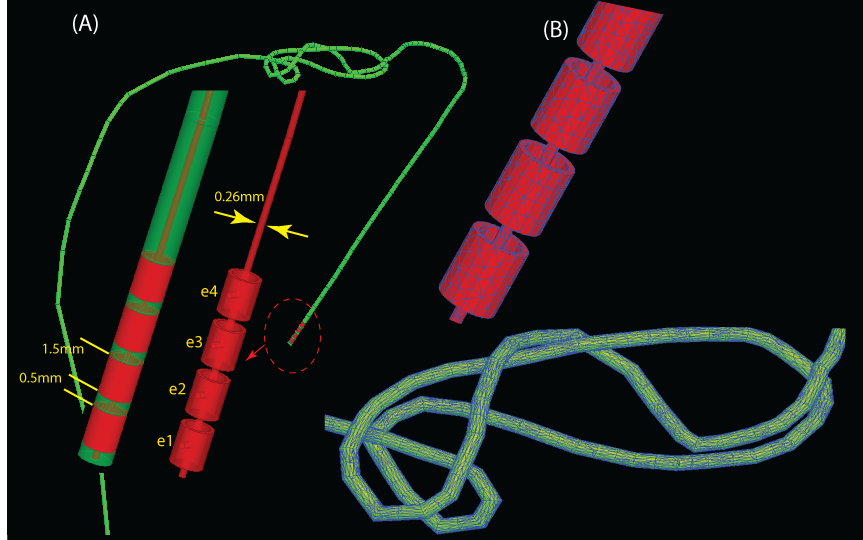
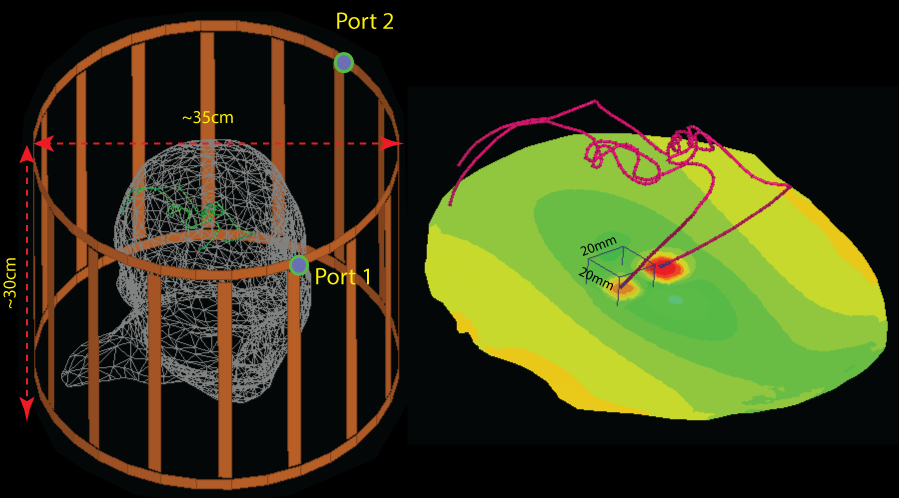
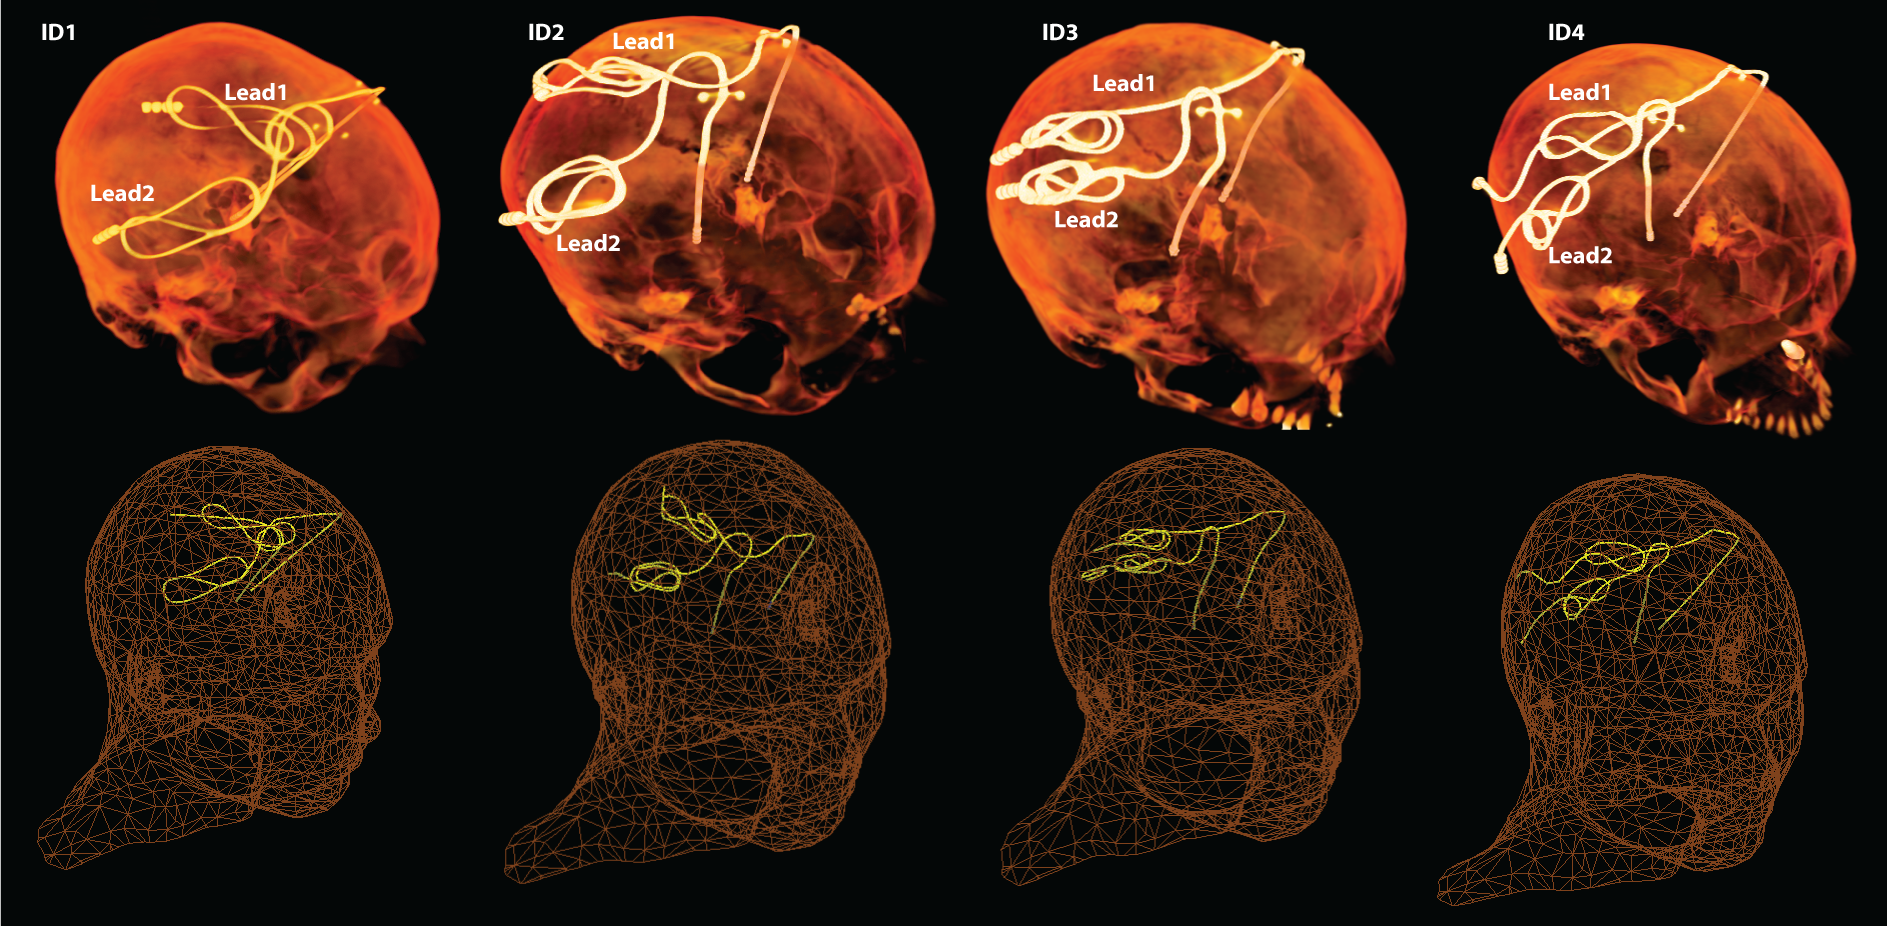
Numerical simulations: Post-operative computer tomography (CT) images of six patients with bilateral DBS implants and two patients with a unilateral implant were used to extract fourteen DBS lead trajectories. Reconstructed lead models were registered to a homogenous head model built by combining different tissue classes of a multimodal imaging-based detailed anatomical (MIDA) model of human head and neck reported elsewhere [4, 5]. Finite element method (FEM) was applied to calculate SAR deposition at electrode contacts during MRI at 3.0 T. Details of image segmentation, DBS lead model construction, MRI RF coil, and SAR calculations are given in Figures 1-3. For all simulations, the MRI coil input power was adjusted to produce a mean B1+=3µT on an axial plane passing through center of the head.
Intra-operative lead management :To attempt to control the lead trajectory, we used curved mayo scissors passed posterior and to the left of the incision. These scissors were inserted to the opening of the blades and opened to their widest to create a pathway for a coiled lead to go that could be produced in other patients. We then coiled the lead upon itself in 3 concentric circles allowing 6 cm of uncoiled lead between the cap on the burrhole and the start of the coiling. Additionally, 2 cm near the extension cap at the distal aspect of the lead was left uncoiled.
Results
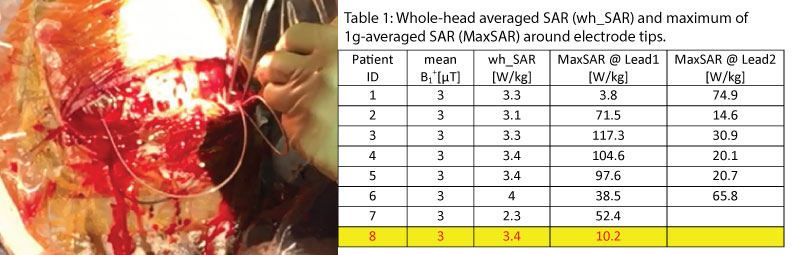
Table 1 gives the whole-head SAR and MaxSAR values for the fourteen lead models. We found a substantial patient-to-patient variation in local SAR values (3.0W/kg-104.6W/kg). In general, leads with larger extracranial loop area and those with the loops positioned toward the temporal lobe tend to demonstrate lower SAR amplification at the DBS electrode tip. Such results are in agreement with our recent finding that concentric extracranial loops positioned at the side of the head could reduce the SAR by up to 140-fold compared to straight lead trajectories [3]. Control of the loops’ profile is however challenging as the surgeon inserts the excess lead under the skin through an incision with no direct visual access of the lead (Figure 4). In the patient where the lead management technique was applied (patient ID=8 in Table1, CT images shown in Figure 1), the MaxSAR was approximately 5 times below the average of the rest of group.Discussion and Future Work
The significant effect of DBS lead trajectory and geometry on the SAR amplification at the electrode tip has been emphasized in recent studies [6, 7], but little is known about the variation and extent of RF heating of DBS leads in a real patient population. To our knowledge, this work is the first attempt to evaluate quantitative values of local SAR at and around DBS leads based on patient-derived realistic models of lead geometries and RF coils. We are now in the process of evaluating a cohort of 20 control patients and 7 patients operated on using the proposed lead management technique to complete this study. Completion of this study will potentially produce highly relevant data that support the development of safe DBS imaging guidelines.Acknowledgements
This work has been supported by NIH grants K99EB021320, R01EB006847 and P41EB015896.References
[1] A. R. Rezai, M. Phillips, K. B. Baker, A. D. Sharan, J. Nyenhuis, J. Tkach, et al., "Neurostimulation system used for deep brain stimulation (DBS): MR safety issues and implications of failing to follow safety recommendations," Investigative radiology, vol. 39, pp. 300-303, 2004.
[2] A. R. Rezai, D. Finelli, J. A. Nyenhuis, G. Hrdlicka, J. Tkach, A. Sharan, et al., "Neurostimulation systems for deep brain stimulation: In vitro evaluation of magnetic resonance imaging–related heating at 1.5 tesla," Journal of Magnetic Resonance Imaging, vol. 15, pp. 241-250, 2002.
[3] L. Golestanirad, L. M. Angelone, M. I. Iacono, H. Katnani, L. L. Wald, and G. Bonmassar, "Local SAR near deep brain stimulation (DBS) electrodes at 64 MHz and 127 MHz: A simulation study of the effect of extracranial loops " Magnetic Resonance in Medicine (In press), 2016.
[4] M. I. Iacono, E. Neufeld, E. Akinnagbe, K. Bower, J. Wolf, I. V. Oikonomidis, et al., "MIDA: a multimodal imaging-based detailed anatomical model of the human head and neck," PloS one, vol. 10, p. e0124126, 2015.
[5] M. I. Iacono, N. Makris, L. Mainardi, L. M. Angelone, and G. Bonmassar, "MRI-based multiscale model for electromagnetic analysis in the human head with implanted DBS," Computational and mathematical methods in medicine, vol. 2013, 2013.
[6] G. Calcagnini, M. Triventi, F. Censi, E. Mattei, P. Bartolini, W. Kainz, et al., "In vitro investigation of pacemaker lead heating induced by magnetic resonance imaging: role of implant geometry," Journal of Magnetic Resonance Imaging, vol. 28, pp. 879-886, 2008.
[7] E. Mattei, M. Triventi, G. Calcagnini, F. Censi, W. Kainz, G. Mendoza, et al., "Complexity of MRI induced heating on metallic leads: experimental measurements of 374 configurations," Biomedical engineering online, vol. 7, p. 11, 2008.
[8] M. M. Elwassif, Q. Kong, M. Vazquez, and M. Bikson, "Bio-heat transfer model of deep brain stimulation-induced temperature changes," Journal of neural engineering, vol. 3, p. 306, 2006.
[9] M. Kozlov and R. Turner, "Fast MRI coil analysis based on 3-D electromagnetic and RF circuit co-simulation," Journal of Magnetic Resonance, vol. 200, pp. 147-152, 2009.
[10] R. A. Lemdiasov, A. A. Obi, and R. Ludwig, "A numerical postprocessing procedure for analyzing radio frequency MRI coils," Concepts in Magnetic Resonance Part A, vol. 38, pp. 133-147, 2011.
[11] IEEE-P1528.4™/D1.0, "Recommended Practice for Determining the Peak Spatial Average Specific Absorption Rate (SAR) in the Human Body from Wireless Communications Devices, 30 MHz - 6 GHz: Requirements for Using the Finite-Element Method for SAR Calculations, specifically involving Vehicle Mounted Antennas and Personal Wireless Devices," 2014.
Figures