0483
FDTD Simulation of Thermo-Acoustic Ultrasound for Detection of RF Tip Heating1Electrical Engineering, Stanford University, Stanford, CA, United States, 2Procyon Engineering, San Jose, CA, United States
Synopsis
Thermo-acoustic ultrasound uses the acoustic waves generated by thermoelastic expansion to detect peaks in local SAR and could be used to assess the risk of RF heating for patients with implanted or interventional devices. We developed simulations to characterize the generation and propagation of thermo-acoustic waves from device lead tips, and we validated the simulations with experimental results. The simulations provide insight into the properties of thermo-acoustic signals and can aid in the development of a thermo-acoustic ultrasound system for the assessment of RF safety.
Purpose
RF tip heating of implanted and interventional device leads is a safety concern that restricts patients’ access to MRI.1,2 The heating has many dependencies3 and cannot be easily predicted prior to scanning. A pre-scan procedure to identify the risk of excess heating would allow more patients to receive clinically useful scans.
Thermo-acoustic ultrasound(TAUS) is an emerging technique in which the reception of acoustic waves generated by thermoelastic expansion is used to identify peaks in local SAR. Prior work has demonstrated the ability of a TAUS system integrated with an MRI scanner to detect RF tip heating induced by the scanner’s body coil,4 making the prospect of a TAUS-based pre-scan to assess RF safety promising. Here, we discuss the development and experimental validation of finite-difference time-domain(FDTD) simulations that provide insight into the TAUS signal generated by lead tips.
Theory & Methods
In TAUS, the pressure generated in a region is proportional to the temporal derivative of the local SAR,5 which can be approximated as a separable function of position and time. Our simulations of the TAUS signal are performed through two distinct steps. First, an electromagnetic simulation determines the spatial profile of the local SAR. This serves as the pressure source distribution for an acoustic simulation that uses the temporal derivative of the transmit power as an excitation signal. These simulations are designed to determine the relative magnitudes of the acoustic signals through space, not the absolute magnitude of pressure generated.
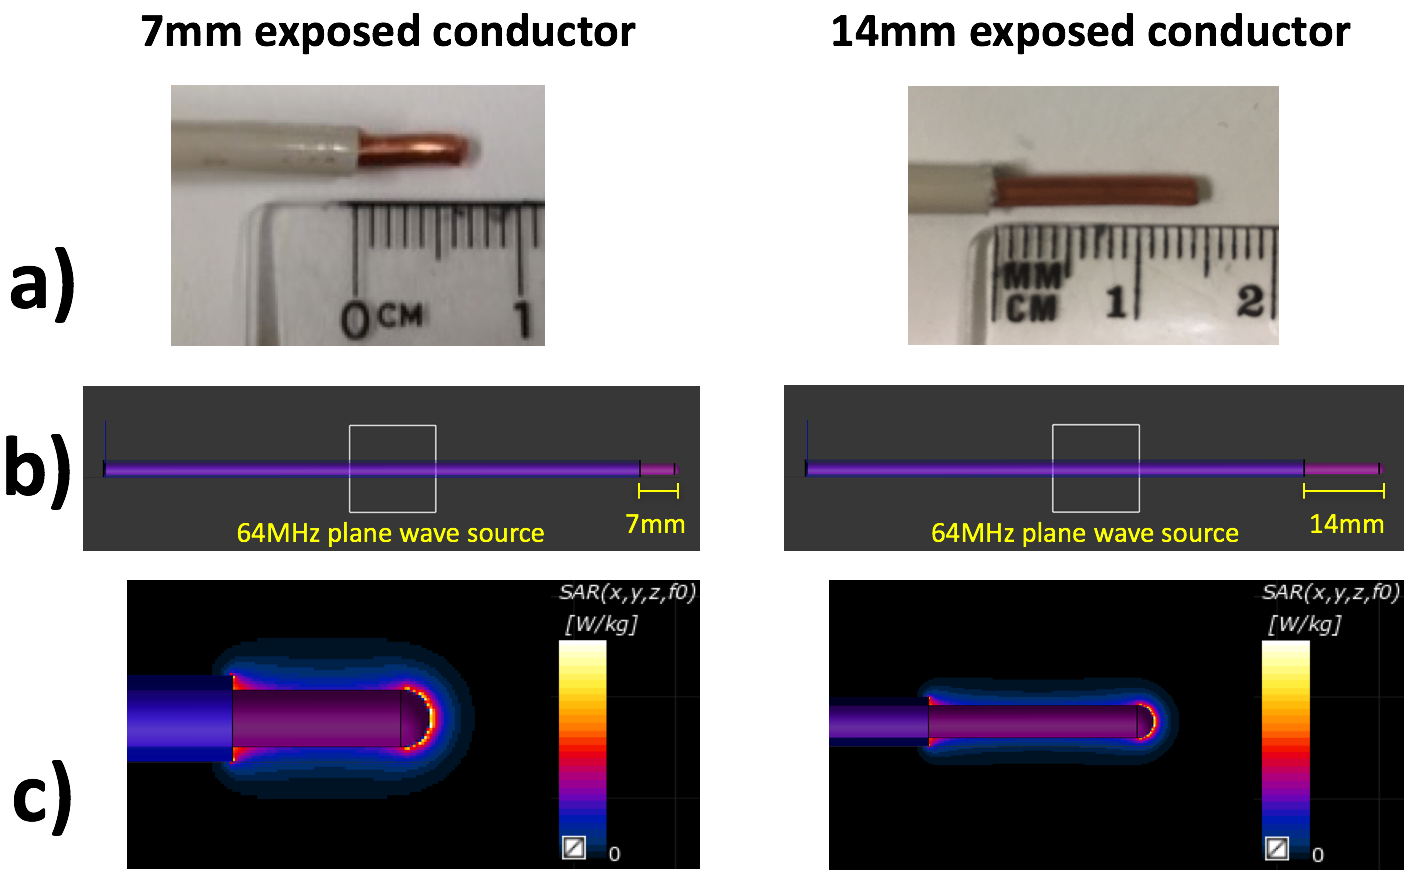
The electric field transfer function is commonly used to model RF heating of leads in MRI.6 Transfer function theory indicates that the spatial profile of the E-field at a lead tip not does strongly depend on the incident E-field distribution along the lead.7 Therefore, an arbitrary placement of an excitation source along a straight lead results in an accurate approximation of the SAR profile at the lead tip for any incident field and lead geometry. We utilized the FDTD electromagnetic solver in Sim4Life(ZMT,Zurich,Switzerland) to estimate the SAR profiles of lead tips immersed in a conductive medium(Figure 1).
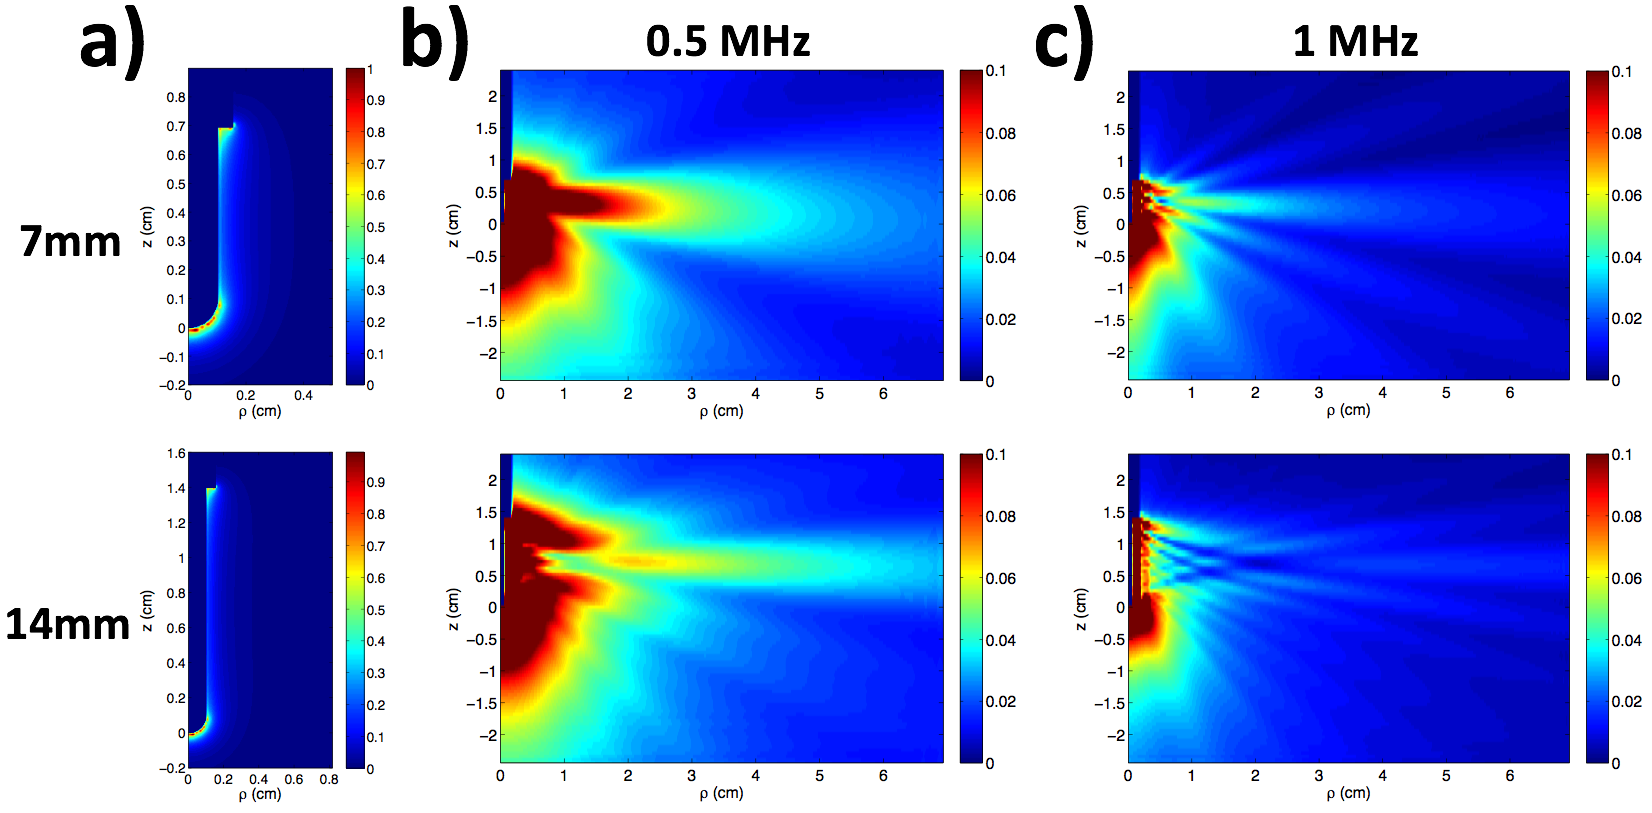
To simulate acoustic wave propagation from cylindrical lead tips, we created a 2D FDTD simulation in cylindrical coordinates with azimuthal symmetry in Matlab. SAR data from the electromagnetic simulation was interpolated onto the acoustic simulation grid to determine the pressure source profile(Figure 2a). A wideband Gaussian pulse was used for the transmit signal to characterize acoustic wave propagation at a range of excitation frequencies, and frequency-domain data was tracked at a series of positions.
The simulation results were used to estimate the signal magnitude observed by a transducer at a given position. The frequency-domain simulation data within the desired excitation bandwidth was averaged over the FDTD grid points covered by the circular transducer surface, and the resulting magnitude data was summed to determine the signal level.
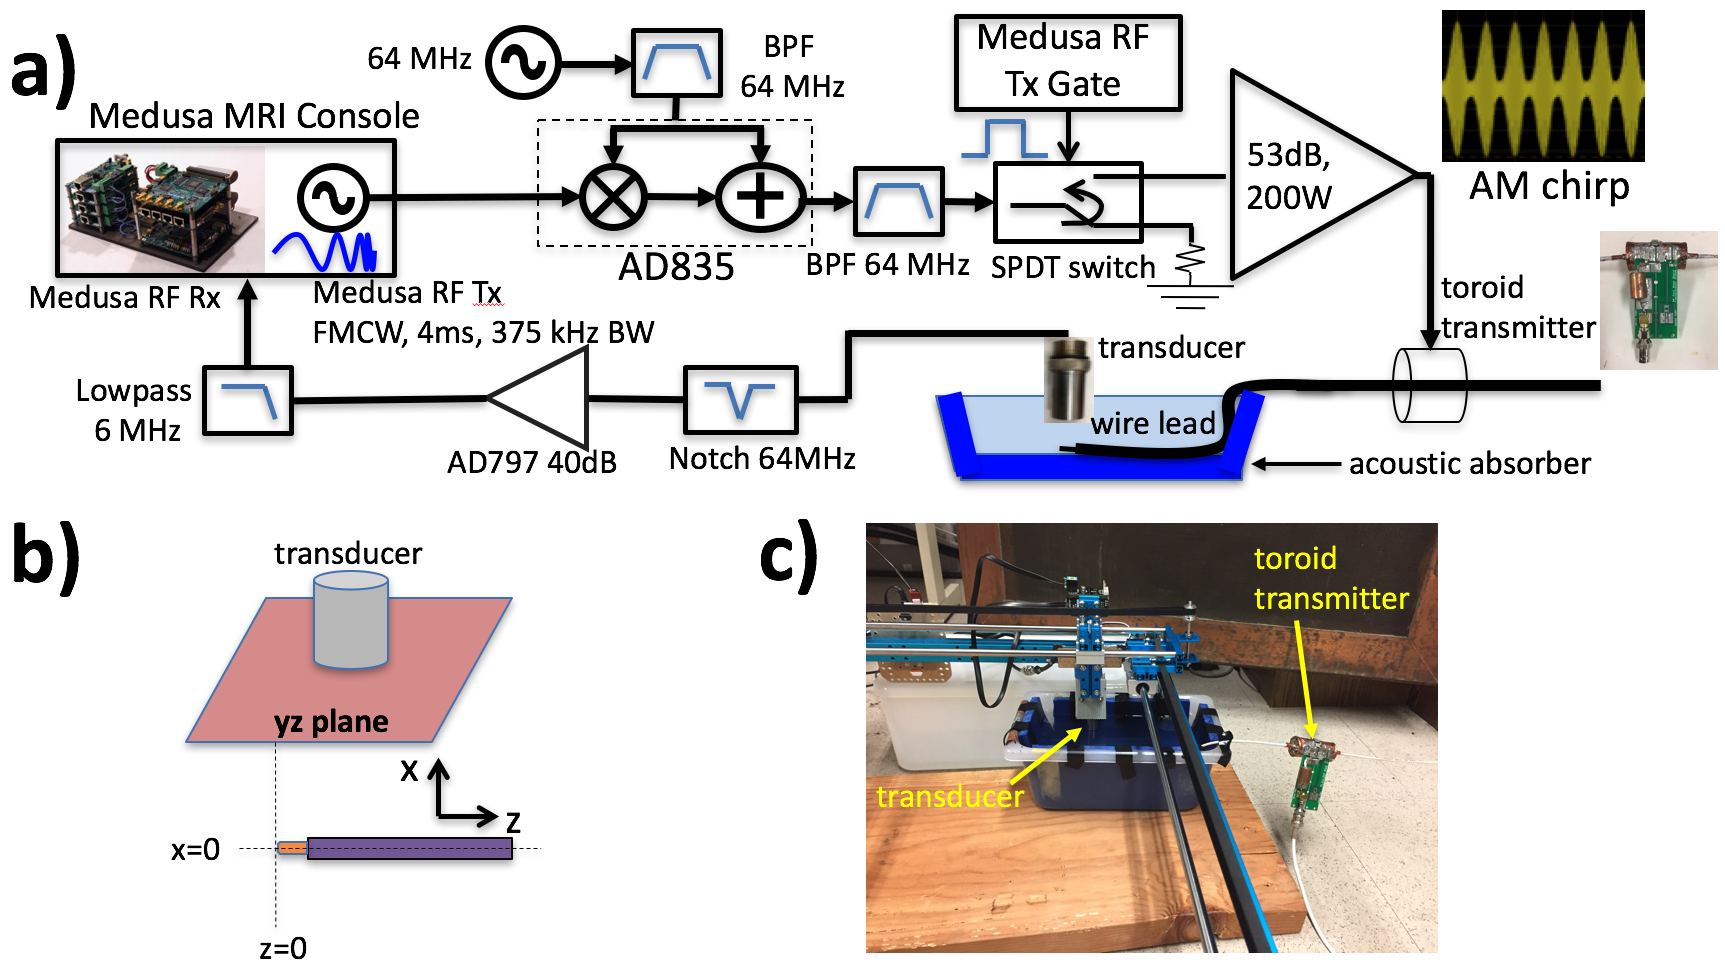
To validate the simulations, TAUS measurements were taken
using the setup shown in Figure 3. A Medusa MRI Console8 was used to
transmit and receive a frequency-modulated continuous wave(FMCW)4 signal
that amplitude-modulated a 64MHz carrier. An ultrasonic transducer was attached
to a 2D plotter(Makeblock,Shenzhen,China) to enable measurements at 1mm
increments over a plane(Figure 3b,c). Measurements were conducted using an FMCW
center frequency of 0.5MHz with a 0.5MHz transducer(Olympus V318-SU) and using a
center frequency of 1MHz with a 1MHz transducer(Olympus V303-SU). Measurements
were done on two leads, one with 7mm of exposed conductor and the other with
14mm(Figure 1a). They were coupled to a toroid transmitter9 and had
their tips immersed in saline solution.
Results & Discussion
Figure 1c shows the simulated SAR profiles. The SAR is highest along the exposed conductor, with peaks near the start and end of the conductor. The different SAR profiles for the two lead tips result in different spatial patterns for the simulated TAUS signal(Figure 2).
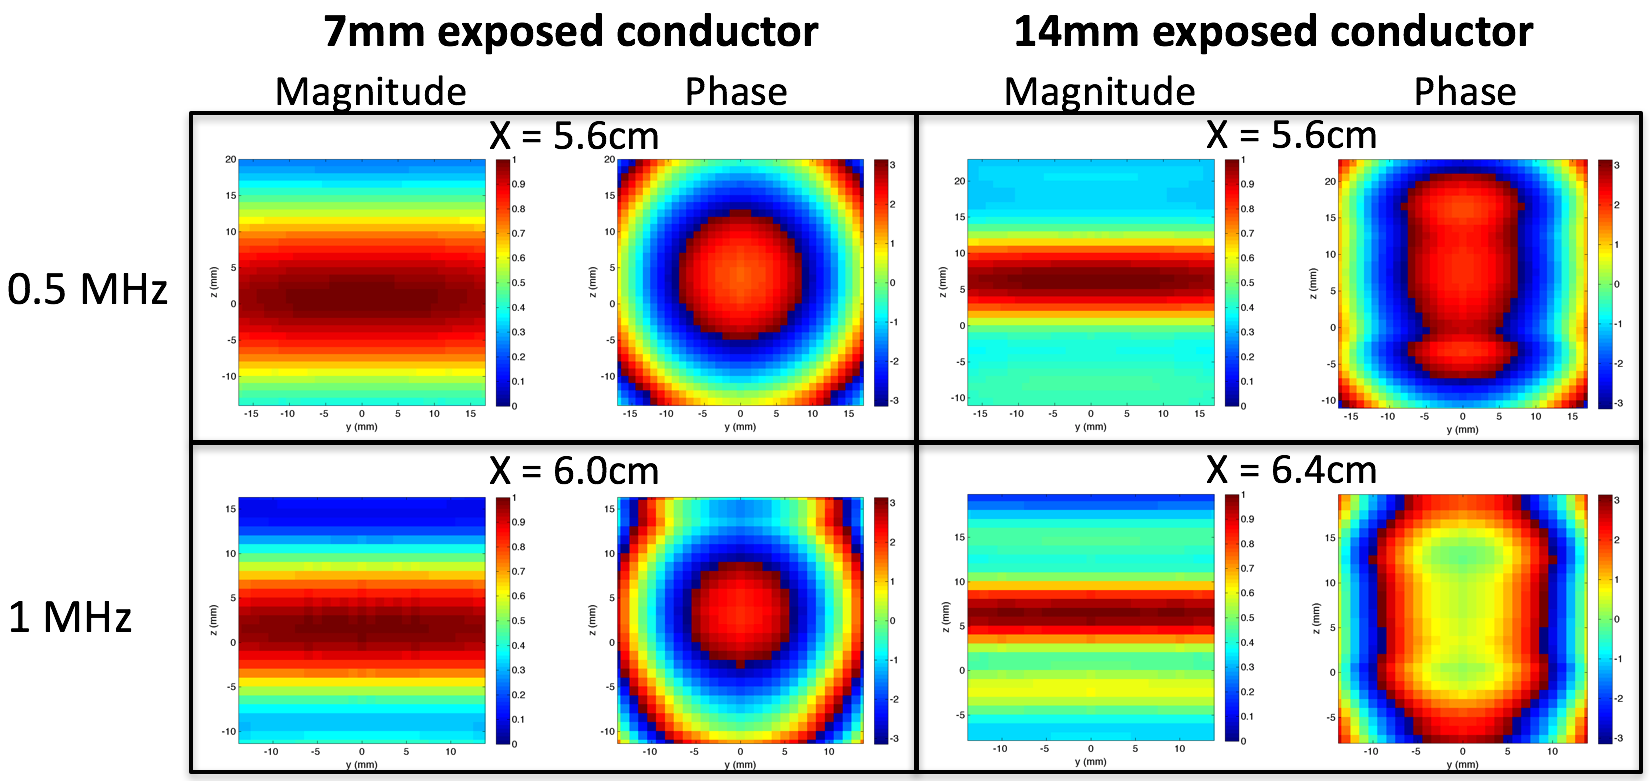
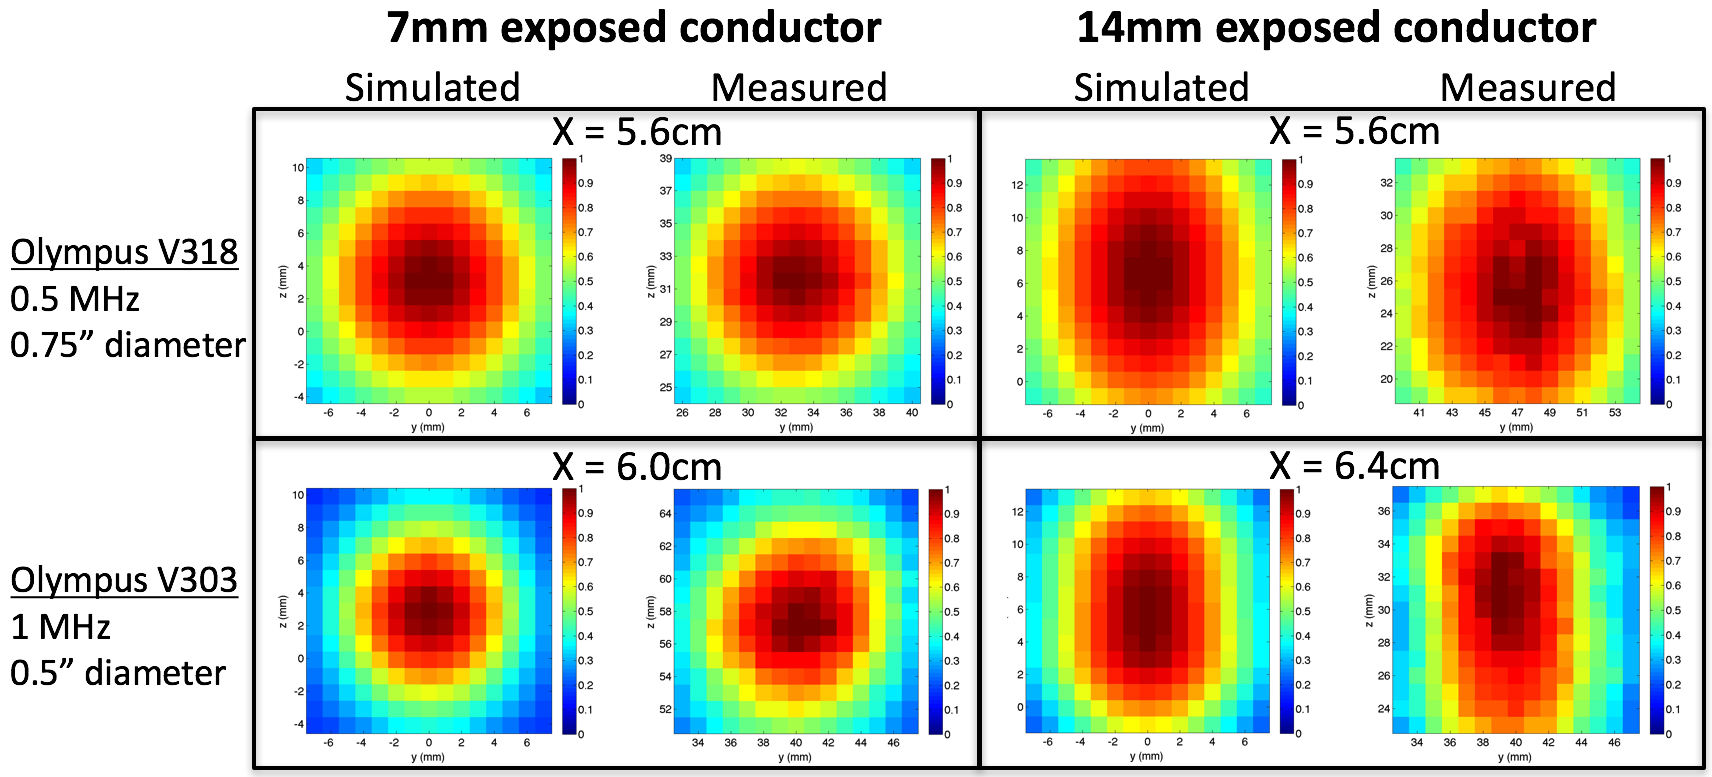
Figure 4 shows the simulated signal pattern in the measurement plane, while Figure 5 shows the simulated and measured transducer signal levels as a function of transducer position in the plane. These appear significantly different because the transducers are large relative to the acoustic wavelengths. Use of a transducer array with smaller element size or lower measurement frequencies could mitigate this effect. The simulated transducer signal patterns in Figure 5 appear to closely resemble the measured ones, indicating that the FDTD simulations provide accurate results.
Conclusions
We have developed an accurate simulation framework for TAUS generated by RF tip heating. These simulations provide insight into TAUS signal dynamics and can contribute to the development of a TAUS system for the assessment of RF safety for patients with implanted devices.Acknowledgements
This research is supported by NIH grants R01EB008108 and P01CA159992, the Department of Defense (DoD) through the National Defense Science & Engineering Graduate Fellowship (NDSEG) program, and the Stanford Graduate Fellowship program.References
1. Rezai AR, Phillips M, Baker KB, et al. Neurostimulation System Used for Deep Brain Stimulation (DBS): MR Safety Issues and Implications of Failing to Follow Safety Recommendations. Invest Radiol. 2004; 39:300-303.
2. Nyenhuis JA, Park S, Kamondetdacha R, et al. MRI and Implanted Medical Devices: Basic Interactions With an Emphasis on Heating. IEEE Trans Device Mater Rel. 2005; 5:467-480.
3. Nordbeck P, Weiss I, Ehses P, et al. Measuring RF-Induced Currents Inside Implants: Impact of Device Configuration on MRI Safety of Cardiac Pacemaker Leads. Magn Reson Med. 2009; 61:570-578.
4. Dixit N, Stang P, Pauly J, Scott G. Thermo-Acoustic Ultrasound Detection of RF Tip Heating in MRI. Proc Intl Soc Mag Reson Med. 2016; 24:0349.
5. Scott G, Etezadi-Amoli M, Stang P, et al. Thermo-Acoustic Ultrasound Detection of RF Coil and Tip SAR. Proc Intl Soc Mag Reson Med. 2015; 23:0377.
6. ISO/TS 10974:2012. Assessment of the safety of magnetic resonance imaging for patients with an active implantable medical device. ISO/TS 10974:2012.
7. Park S, Kamondetdacha R, Nyenhuis JA. Calculation of MRI-Induced Heating of an Implanted Medical Lead Wire With an Electric Field Transfer Function. J Magn Reson. 2007; 26:1278-1285.
8. Stang PP, Conolly SM, Santos JM, et al. Medusa: A Scalable MR Console Using USB. IEEE Trans Med Imag. 2012; 31:370-739.
9. Etezadi-Amoli M, Stang P, Kerr A, et al. Interventional Device Visualization with Toroidal Transceiver and Optically Coupled Current Sensor for Radiofrequency Safety Monitoring. Magn Reson Med. 2015; 73:1315-1327.
Figures