0482
Low Heating B1 Mapping in Parallel Transmit for Deep Brain Stimulators1University of Toronto, Toronto, ON, Canada, 2Massachusetts General Hospital, MA, United States, 3US Food and Drug Administration, Silver Spring, MD, United States, 4Sunnybrook Health Sciences Centre, ON, Canada, 5Innovere Medical, ON, Canada
Synopsis
Deep brain stimulators and other elongated implants interact with the RF transmission fields used in MRI, potentially causing unsafe levels of localized tissue heating. It may be possible to suppress these heating effects using parallel RF transmission (pTx) methods, but a practical approach still remains to be implemented. Toward this goal, we present a method that combines intra-operative computed tomography (CT) data, electromagnetic simulations, and low-SAR B1-mapping to determine pTx input parameters for suppressing heating effects in DBS patients.
Purpose
Implanted devices, such as Deep Brain Stimulators (DBS), are subject to heating during MRI due to interaction with radiofrequency (RF) fields1. Recently, techniques2,3 have been purposed to mitigate RF coupling using parallel RF transmission (pTx)4. However, many of these techniques rely heavily on electromagnetic (EM) simulation and do not account for model/patient discrepancies. We present a method that may be a useful step forward: combining patient-specific EM simulations with B1-mapping, to determine pTx input parameters that suppress local SAR elevations near DBS implants while maintaining B1+ homogeneity.Methods
Conceptually, the proposed method has two main stages. Stage 1 uses existing patient data and simulation-based optimization to determine solutions with “safe” pTx inputs (RF shim settings that enable B1-mapping with low local SAR at the tip of the DBS implant) which span all possible EM field distributions, without B1+ homogeneity constraints. Stage 2 involves pTx calibration with B1-mapping using the N “safe” pTx inputs similar to the method of Brunner et al5. This reduces the risk of heating at the implant tip, compared to the technique of mapping B1-fields of individual coil elements which does not protect against RF coupling. The resulting B1-maps are then used in an additional optimization step to determine pTx inputs that minimize local SAR while maintaining B1-homogeneity, similar to standard pTx techniques.
Specifically, stage 1 involves a constrained optimization via simplex algorithm to determine N linearly independent complex signal inputs to each channel of an N-element pTx coil which produce minimal 1g local SAR in the region of minimization (ROM) surrounding the implant tip and are linearly independent (Eq. 1):
$$ \min_{A_n^{(j)},\phi_n^{(j)}}(\mu_{tip}(\frac{\mid E_{tot}\mid^2}{\mid E_{quad}\mid^2})) (1) $$
$$s.t. \{(A_1^{(j)}e^{\phi_1^{(j)}},...,A_N^{(j)}e^{\phi_N^{(j)}}),(A_1^{(j-1)}e^{\phi_1^{(j-1)}}, ..., A_N^{(j-1)}e^{\phi_N^{(j-1)}}), ..., (A_1^{(0)}e^{\phi_1^{(0)}},..., A_N^{(0)}e^{\phi_N^{(0)}})\}\ is\ linearly\ independent$$
where An and Φn are the input amplitude and phase of the nth channel, μROM(·) is the mean in the ROM, Equad is the electric (E) field in pTx quadrature mode (An=1, Φn=2π/N) and is the E-field generated by the optimal inputs. E-fields are obtained from EM simulations of patient-specific models including DBS lead trajectories segmented from standard post-operative CT scans.
Stage 2 involves standard B1-mapping of the DBS patient using the set of “safe” inputs determined in Stage 1. The B1-maps are then used in a second optimization which determines the input amplitude and phase for each pTx channel to maximize B1+-field homogeneity for high quality imaging in a volume of interest (VOI), and to minimize the B1+ artifact in the ROM to avoid elevated local SAR (Eq. 2):
$$ \min_{A_n, \phi_n}(\frac{\sigma_{VOI}(\mid B_{1,tot}^+\mid)}{\mu_{VOI}(\mid B_{1,quad}^+\mid)}+\lambda\cdot\frac{B_{1,tot}^{art}}{B_{1,quad}^{art}}) (2)$$
$$ B_{(\cdot)}^{art}=(\frac{\max_{ROM}\mid B_{(\cdot)}^{+}\mid)}{\mu_{ROM}(\mid B_{(\cdot)}^+\mid)} $$
where σVOI(·) is the spatial standard deviation over the VOI, and maxROM (·) is the spatial maximum over the ROM.
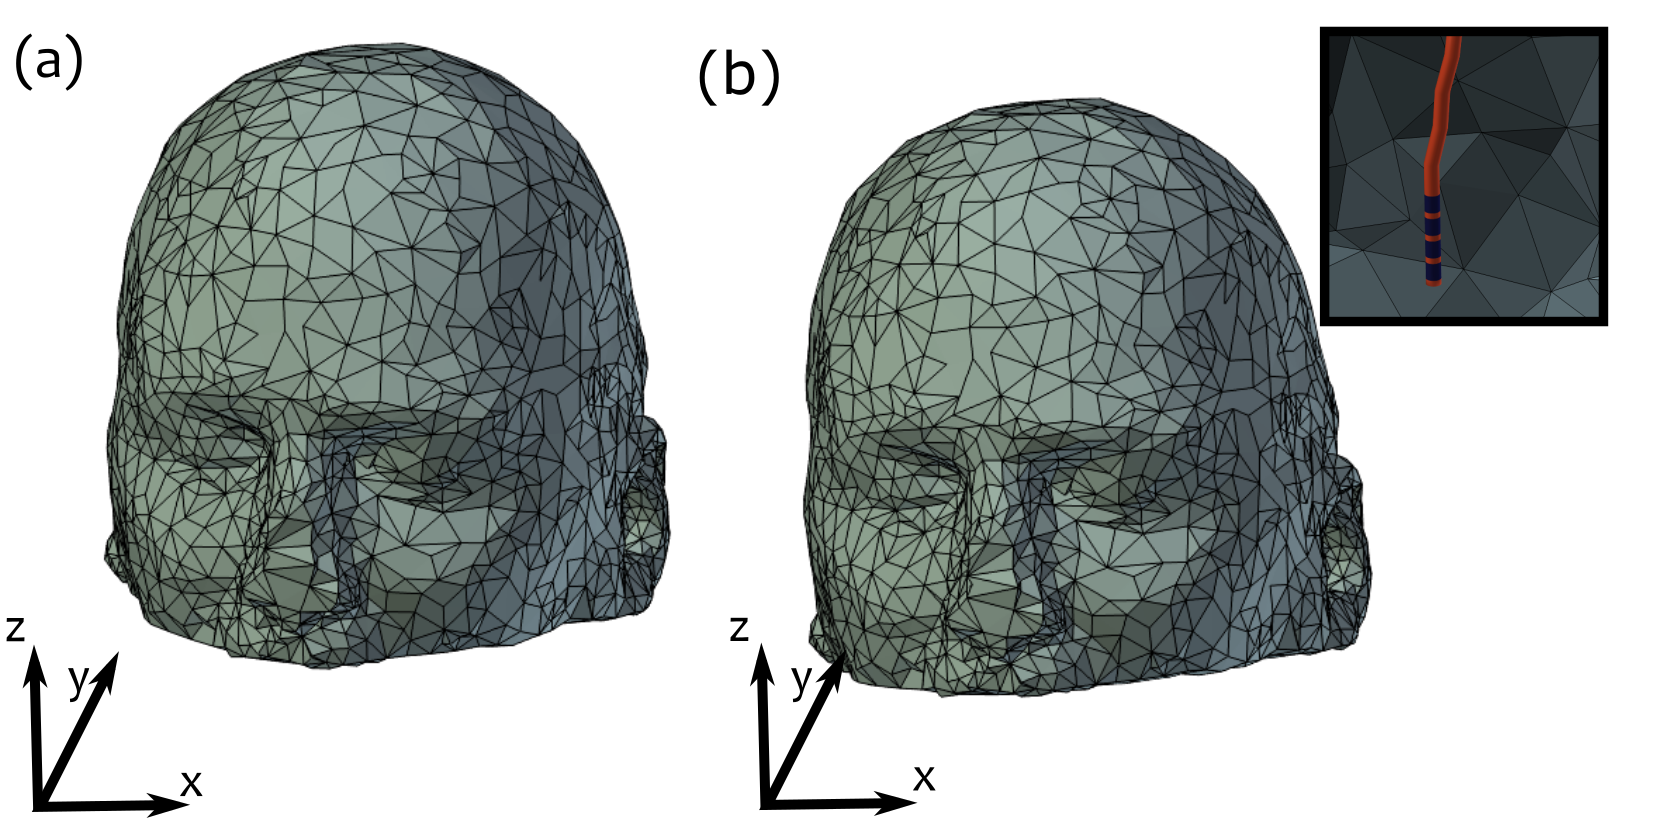
For initial evaluation, realistic DBS lead trajectories and head models were semi-automatically segmented from intra-operative CT images of 6 patients who received sub-thalamic nucleus DBS at Massachusetts General Hospital (MGH). Secondary use of patient data was approved by the MGH Internal Review Board. EM simulations were performed using FEKO (Atlair, MI, USA) and optimization was completed using Matlab (Mathworks, Natick, MA). “Safe” B1-mapping inputs were calculated for each patient with 4- and 8-element pTx coil configurations at 3 T. A random rigid-body transformation was applied to emulate possible positioning errors between Stage 1 and Stage 2 (Fig. 1). B1+-fields were calculated via simulation to represent B1+-mapping in Stage 2. The simulated B1+-field and SAR patterns for the final set of optimized inputs for each pTx configuration were then obtained, and compared with a transmit/receive quadrature birdcage coil.
Results
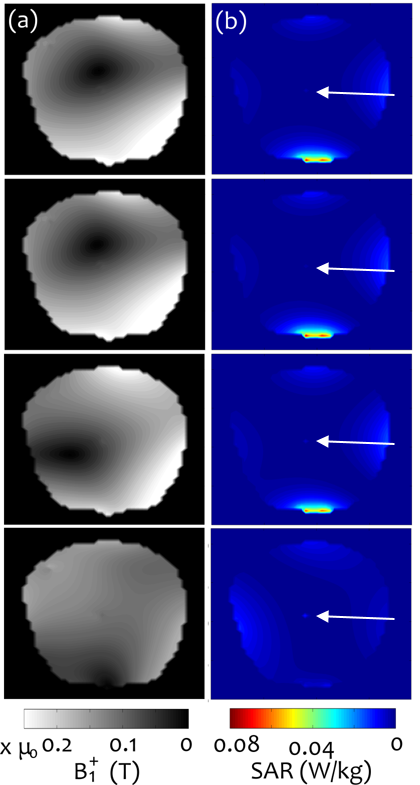
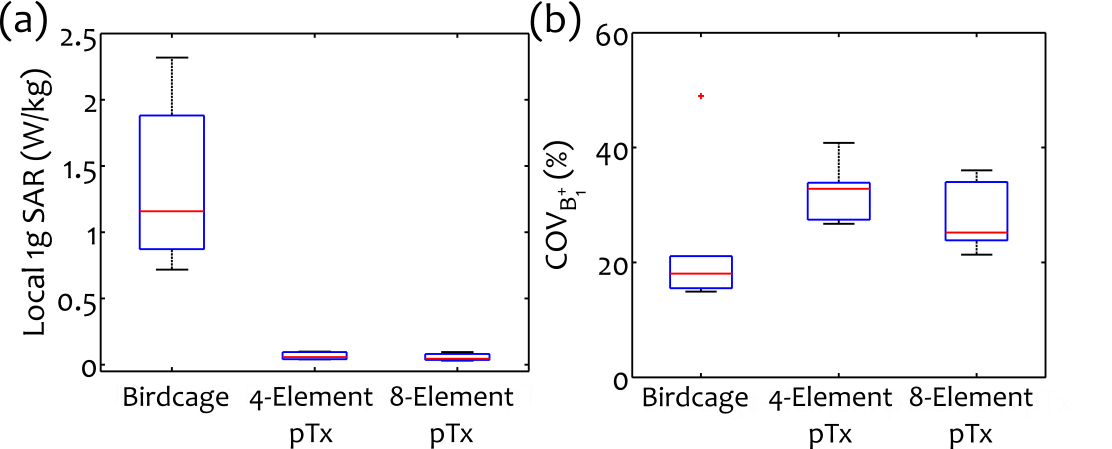
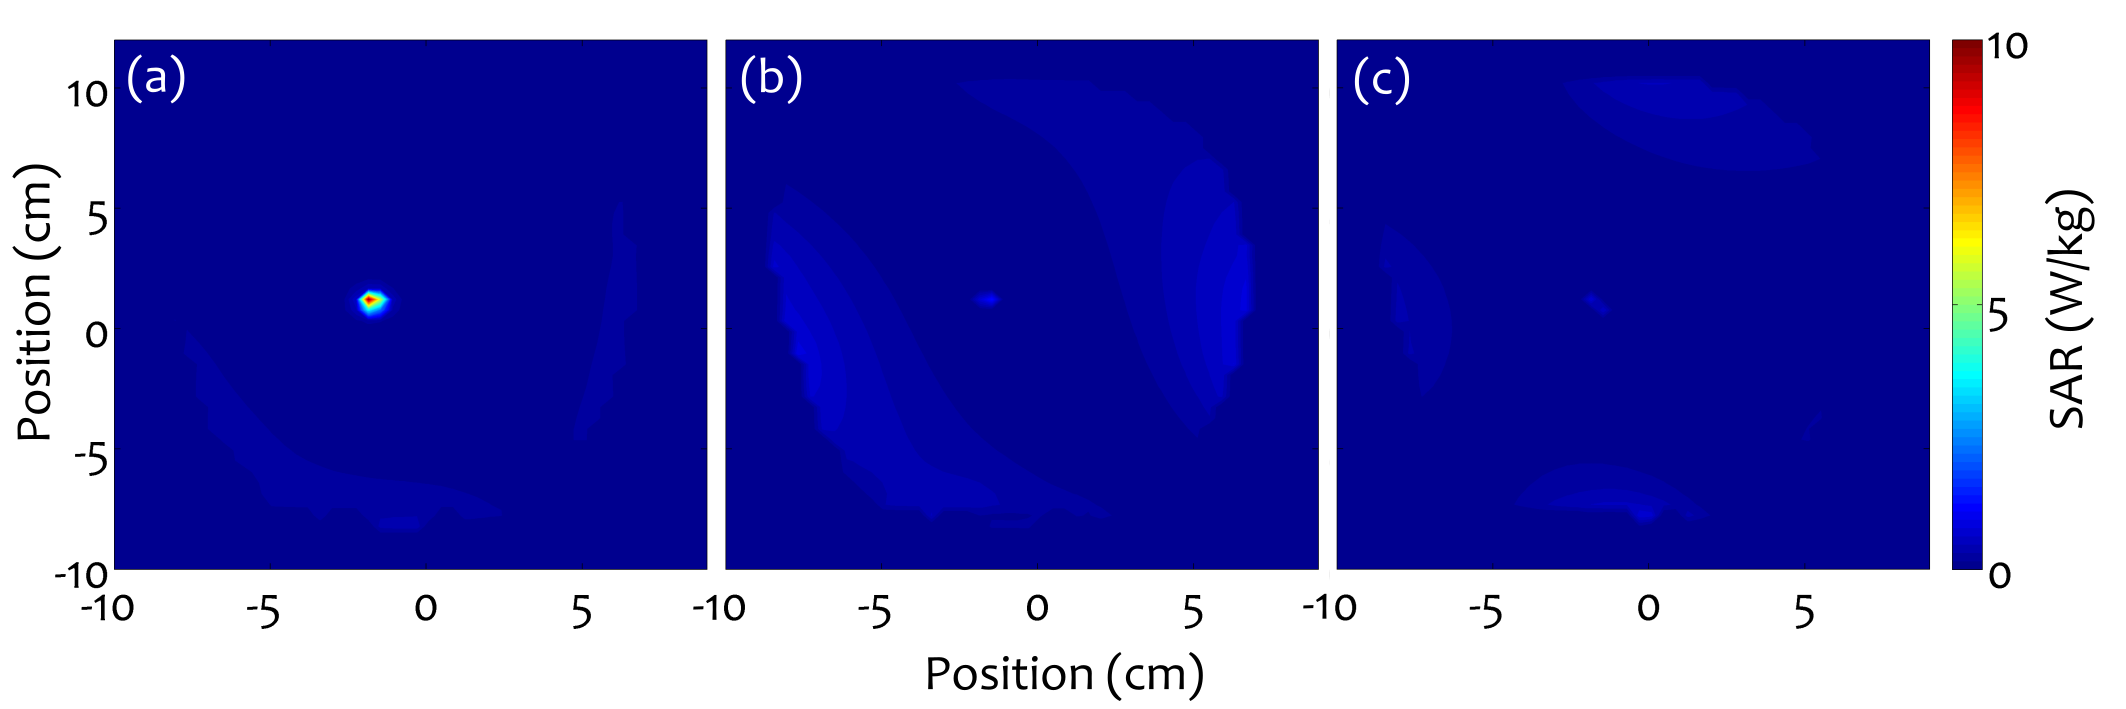
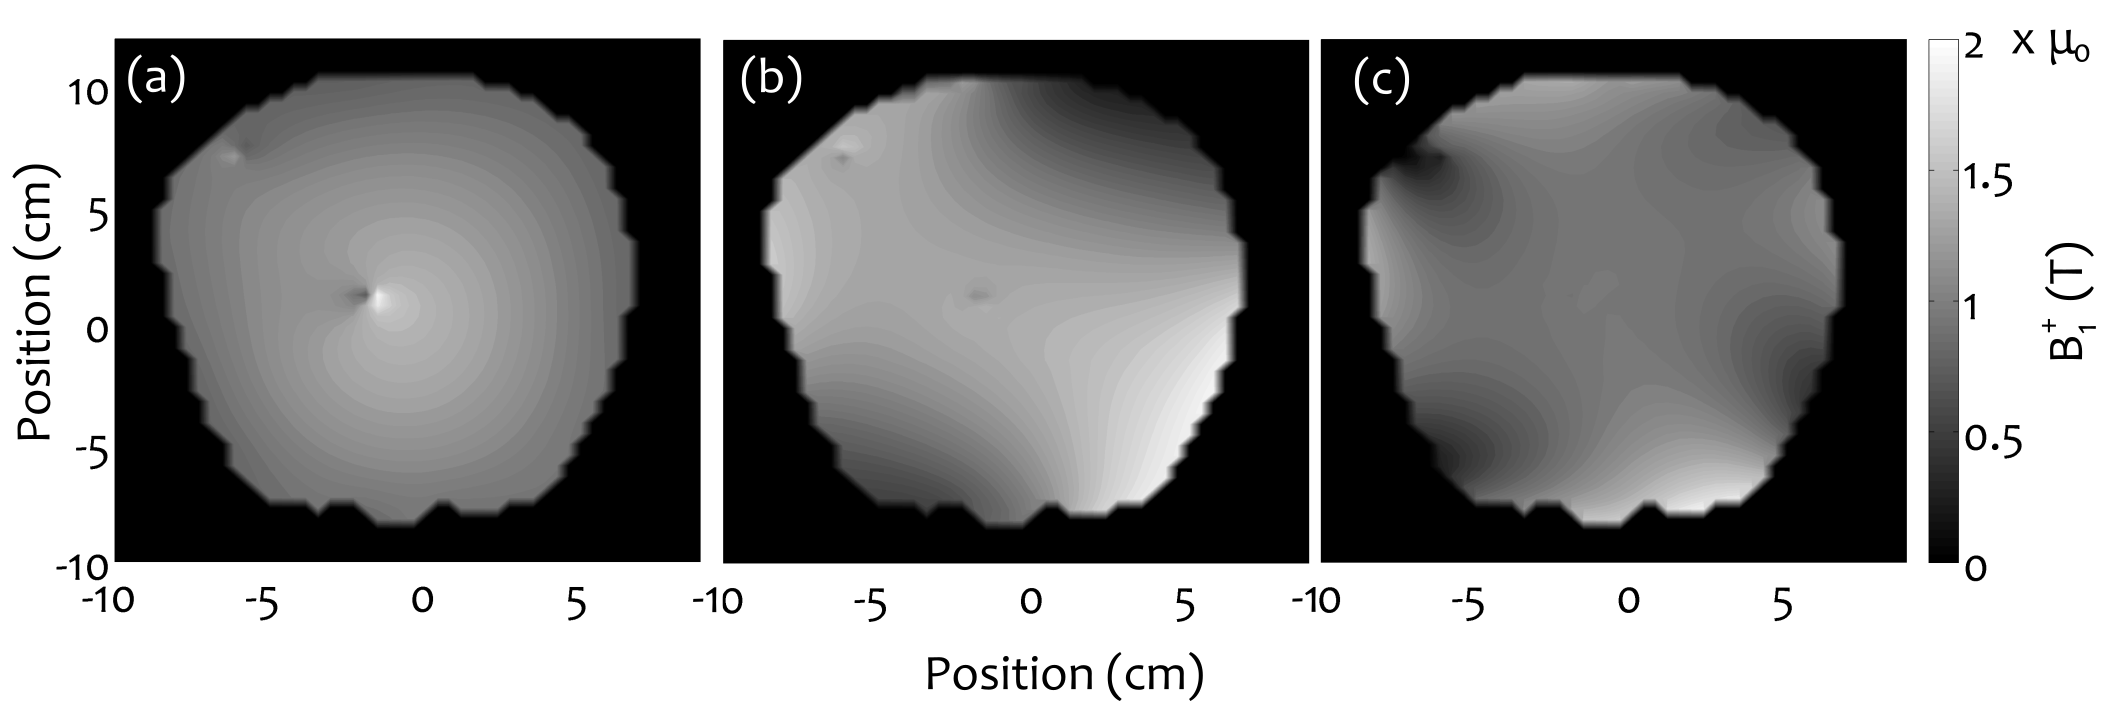
Linearly independent “safe” inputs with low local SAR levels were found in all cases. Figure 2 shows representative results for 4-element pTx. Final stage 2 results are shown in Fig. 3 for birdcage coil, 4- and 8-element pTx configurations. Statistically significant decreases in local 1g SAR in the ROM were observed for the two pTx configurations compared with the birdcage coil, with mean reductions of 94% and 95%, respectively. B1+ inhomogeneity increased (32% for 4-element and 25% for 8-element pTx) in comparison to birdcage excitation (18%). However, the difference is not statistically significant. Representative patient SAR plots and B1+-field are shown in Figs. 4-5, respectively.Discussion
The
proposed two-stage method makes reasonable use of existing CT data to obtain B1-maps without introducing substantial RF coupling. Simulation results are
promising and support undertaking further work to validate the technique
experimentally, to evaluate the effectiveness of using the B1+
artifact as a proxy for high local SAR, and to ensure B1-mapping
with a set of N “safe” inputs is robust
across all patient configurations and patient/simulation discrepancies. Acknowledgements
No acknowledgement found.References
1. Rezai AR, Phillips M, Baker KB, Sharan AD, Nyenhuis J, Tkach J, Henderson J, Shellock FG. Neurostimulation system used for deep brain stimulation (DBS): MR safety issues and implications of failing to follow safety recommendations. Invest Radiol 2004; 39(5):300-303.
2. Eryaman Y, Guerin B, Akgun C, Herraiz JL, Martin A, Torrado-Carvajal A, Malpica N, Hernandez-Tamames JA, Schiavi E, Adalsteinsson E, et al. Parallel transmit pulse design for patients with deep brain stimulation implants. Magn Reson Med 2015; 73(5):1896-903.
3. McElcheran CE, Yang B, Anderson KJ, Golenstani-Rad L, Graham SJ. Investigation of Parallel Radiofrequency Transmission for the Reduction of Heating in Long conductive Leads in 3 Tesla Magnetic Resonance Imaging. PLoS One 2015; 10(8):e0134379.
4. Katscher U, Bornert P, Leussler C, van den Brink JS. Transmit SENSE. Magn Reson Med 2003; 49(1):144-50.
5. Brunner DO, Pruessmann, KP. B1+ Interferometry for the Calibration of RF Transmitter Arrays. Magn Reson Med 2009; 61:1480-1488.
Figures