0481
A Hybrid model for calculation of Radio Frequency heating at the electrodes of an implanted neuro-stimulator.1Electrical and Computer Engineering, Purdue University, West Lafayette, IN, United States, 2Saluda Medical, Artarmon NSW, Australia
Synopsis
We present an efficient computational method to calculate the temperature rise during MRI of tissue surrounding the electrodes of an active implanted lead. Inputs to the model are transmission line parameters as derived from electrical tests on the lead and the calculated tangential electric-field along the length of the lead during MRI. The method was validated by comparing measured and calculated temperature rises at the electrodes of a neurostimulation lead in a phantom test. The distribution of temperature rise in the tissues surrounding the electrode array was calculated for a whole body SAR of 2 W/kg. The maximum temperature rise was 5.4oC, which is expected to be safe, but more work would be required to assess uncertainty in this determination.
Introduction and Purpose
The temperature rise during MRI at the electrodes of an implanted neuro-stimulator must be less than the threshold of approximately 6 oC for tissue damage.1 It has been proposed to calculate the temperature rise using a full wave computation, which is the Tier 4 analysis that is discussed in ISO/IEC 10974.2 However a Tier 4 calculation may be impractical due to the detailed geometry. The purpose of this work was to develop a hybrid computational method that provides the same information as Tier 4, but computationally more efficient. A requirement was that the model account for impact of the in-homogeneity of the tissues that surround the electrode.Methods
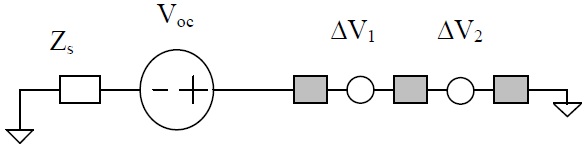
Fig 1. shows the model for the simulation of heating with the hybrid transmission line model.The lead up to the array is modeled by the Thevenin equivalent parameters of a source impedance and open circuit voltage. Source impedance (Zs) is determined with the equation from transmission line theory. For a lead with large damping factor(α), Zs approaches the characteristic impedance Z0. Open circuit voltage is calculated with the open circuit transfer function SVoc derived from transmission line theory and the tangential electric field (Etan) along the length of the lead. The temperature rise of the tissue surrounding the electrodes is calculated with FDTD.
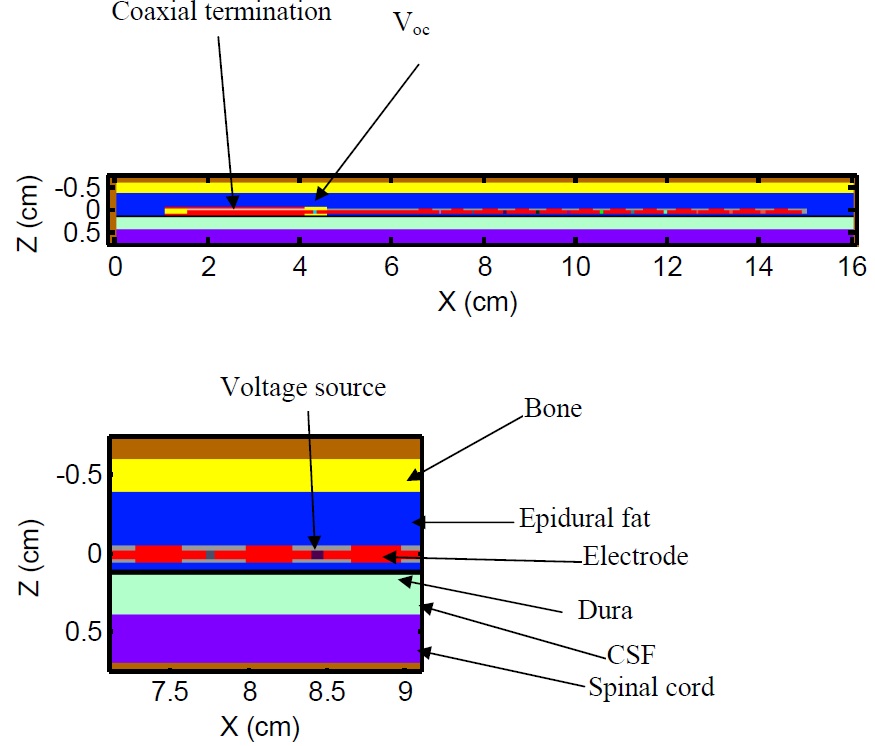
Fig. 2 shows the model of the lead. Etan in the vicinity of the electric array is accounted for by placement of voltage sources between the electrodes. Zs is modeled as a 3 cm long section of transmission line at the end of the lead and is set by adjusting the conductivity of the dielectric layer. This section is covered with a conducting metal shield. A conducting wire of diameter 0.6 mm models the filar wires. The tissues in the vicinity of the electrodes are modeled by planar layers are shown in Fig 2. The structure is based on the one presented by Struijk et al3 for modeling of spinal cord stimulation.
Measurements of temperature rise at electrodes were made in a rectangular phantom inside an RF coil. The temperature rise at different electrodes in the phantom tests were compared to predicted values in order to validate the method.
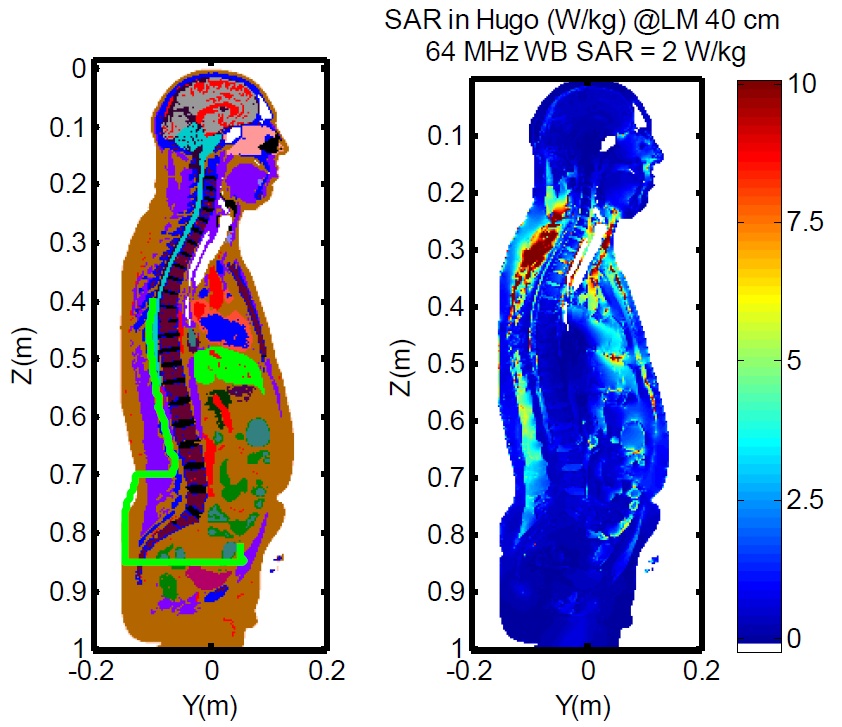
To evaluate the in-vivo rise, a pathway for the lead was defined in the Hugo model, as shown in Fig 3. Etan was then determined from the trajectory of the lead and the surrounding electric field.
Results
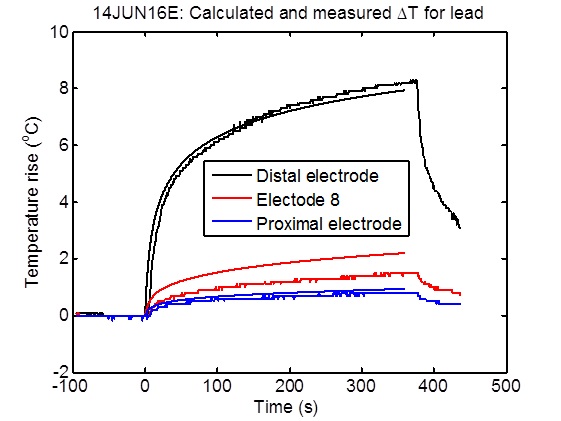
Fig. 4 shows the measured and calculated temperature rises vs. time at three different electrodes. The maximum difference between calculated and measured value of temperature rise is approximately 1 oC, compared to maximum measured rise at the distal electrode of 8.2 oC. The model is thus able to predict the measured temperature rises to within 15% of the maximum rise and is considered to be validated.
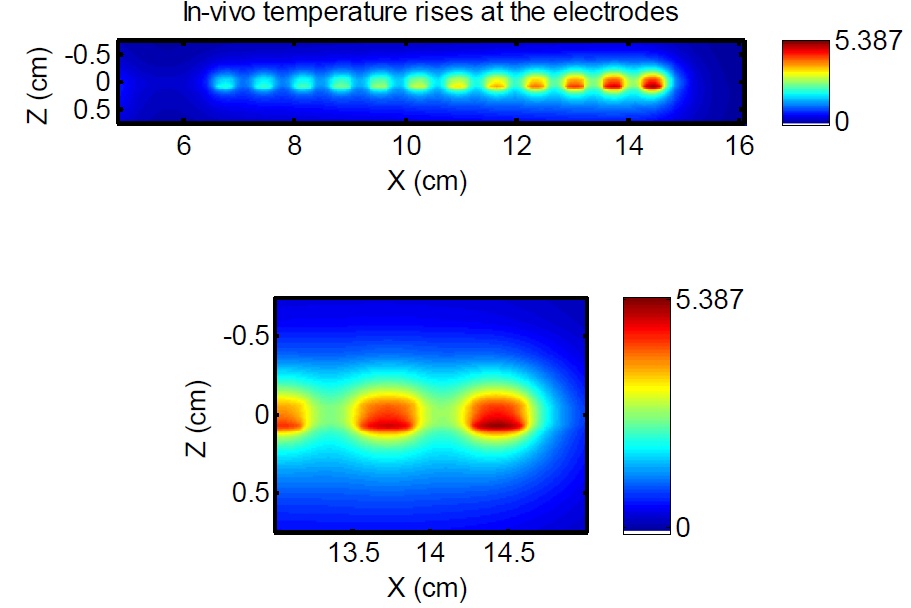
Fig. 5 shows the calculated distribution of temperature rise over the electrode array in the Hugo model. The greatest rise occurs at the distal electrode. Noteworthy is that the temperature rise is concentrated near the electrodes. With the buffer layer of Celebral Spinal Fluid(CSF), the maximum temperature rise in the spinal cord is approximately 1 oC.
Discussion and Conclusion
The hybrid model will account for in-homogeneity in the tissues that surround the electrodes of a stimulator in the body, whereas only one type of material will surround the electrodes in a phantom test.
The hybrid analysis is intermediate to the Tier 3 and Tier 4 analysis methods that are presented in ISO/IEC 10974 and for which sample calculations for a model implant were performed by Cabot et al.3 In a Tier 3 analysis, the temperature rise (ΔT) at an electrode is determined from transfer function SE and Etan along the lead according to $$\triangle T=A|\int_{0}^{L}S_{E}(z')E_{tan}(z')dz'|^2$$ where A is a constant, SE is the electric field transfer function, L is lead length and z’ is distance along the lead.
The more exact Tier 4 analysis, calculates temperature rise based on a full wave model of the implant. For the small dimensions of the filars of an active implant, the Tier 4 analysis is computationally intensive to the extent that the time required for the calculation may be impractical.4 The hybrid computational method will yield nearly the same information as the full wave analysis, providing a detailed map of temperature rise and power distribution around the electrodes as shown in Fig. 5. The hybrid method is more computationally efficient than full wave because only the electrode array and the surrounding tissues need to be modeled in detail.
Acknowledgements
No acknowledgement found.References
(1) ISO/TS 10974:2012, Assessment of the safety of magnetic resonance imaging for patients with an active implantable medical device, 2012. www.iso.org.(2) R.J. Coffey, R. Kalin and J.M. Olsen, Magnetic Resonance Imaging Conditionally Safe Neurostimulation Leads: Investigation of the Maximum Safe Lead Tip Temperature,Neurosurgery, Vol. 74, 215-224, 2014.
(3) J.J. Struijk, J. Holsheimer, and H.B.K. Boom, Excitation of dorsal root fibers in spinal cord stimulation: A theoretical study, IEEE Trans. on Biomedical Engineering. vol 40, pp. 632-639, 1993.
(4) E. Cabot, E. Zastrow, and N. Kuster, Safety Assessment of AIMDs under MRI Exposure: Tier3 vs. Tier4 Evaluation of Local RF-induced Heating, EMC 2014 proceedings, copyright IEICE,pages 237-240.
(5) E. Cabot, T. Lloyd, A. Christ, W. Kainz, M. Dougglas, G. Stenzel, S. Wedan, and N. Kuster,Evaluation of the RF Heating of a Generic Deep Brain Stimulator Exposed in 1.5 T Magnetic Resonance Scanners, Bioelectromagnetics 2013, 34:104-113.
Figures