0477
An 8Tx/8Rx coil validation workflow toward Virtual Observation Points-based parallel transmission cervical spinal cord in vivo imaging at 7T1Aix-Marseille Université, CNRS, CRMBM UMR 7339, Marseille, France, Marseille, France, 2AP-HM, Hôpital de la Timone, Pôle d’imagerie médicale, CEMEREM, Marseille, France, 3iLab-Spine - Laboratoire international associé - Imagerie et Biomécanique du rachis, France/Canada, 4Medical Physics in Radiology, German Cancer Research Center (DKFZ), Heidelberg, Germany, 5UNIRS, NeuroSpin, CEA/DSV/I2BM, Gif-sur-Yvette, France, 6RAPID Biomedical GmbH, Rimpar, Germany, 7Siemens Healthineers, Saint-Denis, France
Synopsis
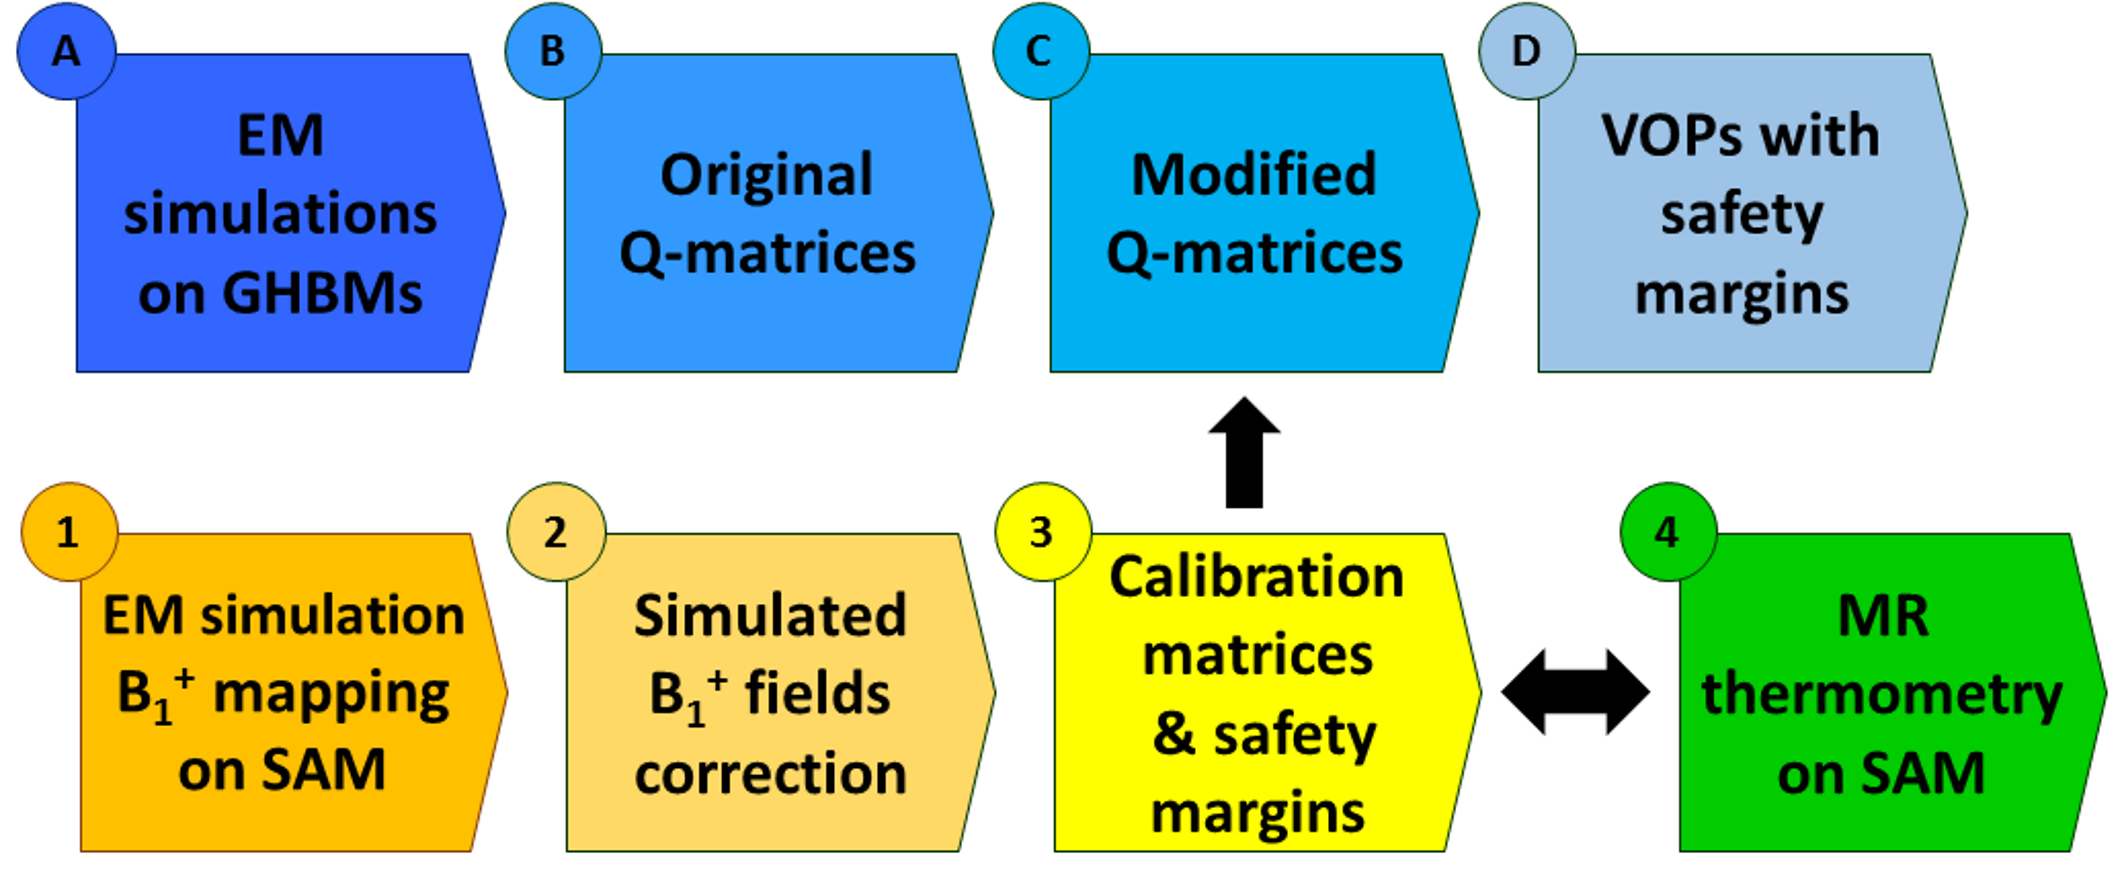
Parallel transmission is a cutting-edge asset to tackle RF field inhomogeneity or to realize inner volume selection for cervical spinal cord imaging at 7T. To perform VOP-based pTx in vivo exams with a dedicated 8Tx/8Rx coil the following workflow is proposed: 1) starting from electromagnetic simulations on generic human body models, Q-matrices sets were compressed with the VOP method. 2) B1+ mapping was performed on a phantom with known properties to validate these electromagnetic simulations by deriving calibration matrices, and initialize error propagations and further related safety margins. 3) MR thermometry was also performed to cross-check obtained results.
Introduction
Unlike standard MR systems, multi-transmit array (pTx) systems allow transmitting multiple radiofrequency (RF) pulses simultaneously and synchronously through independent RF channels, thus enabling RF field homogeneity optimization or multidimensional RF pulse acceleration [1]. With the spatial modulation of the RF fields in the human body, the distribution of the deposited power and therefore the local Specific Absorption Rate (SAR) change as well, depending on the amplitudes and phases of the currents applied to the individual coil elements [2]. In the sake of RF safety, local SAR in humans is subject to regulatory limitations [3]. Hence, to predict and control local SAR in a computationally efficient manner, the pTx system must be equipped with the recently introduced Virtual Observation Points (VOP [4]), which are either provided by the coil manufacturer or generated in situ.
In this work, we present a workflow which will enable to perform VOP-based pTx in vivo exams with an 8Tx/8Rx coil dedicated to spinal cord (SC) imaging at 7T. Starting from electromagnetic (EM) simulations on generic human body models (GHBMs), Q-matrices [2] sets were compressed with the VOP method. In parallel, two experiments (B1+ mapping and MR thermometry) were performed on a phantom to validate EM simulations and to derive calibration matrices and error propagations, paving the way for comprehensive safety margins integration.
Methods
System: whole-body 7T Magnetom Step 2.3 (Siemens Healthineers, Erlangen, Germany).
Coil: 8Tx/8Rx transceiver array (Rapid Biomedical, Rimpar, Germany) constituted with 8 loops spread on a saddle surface cradling the neck.
EM simulations (time-domain solver, hexahedral mesh): with CST Studio Suite (CST, Darmstadt, Germany).
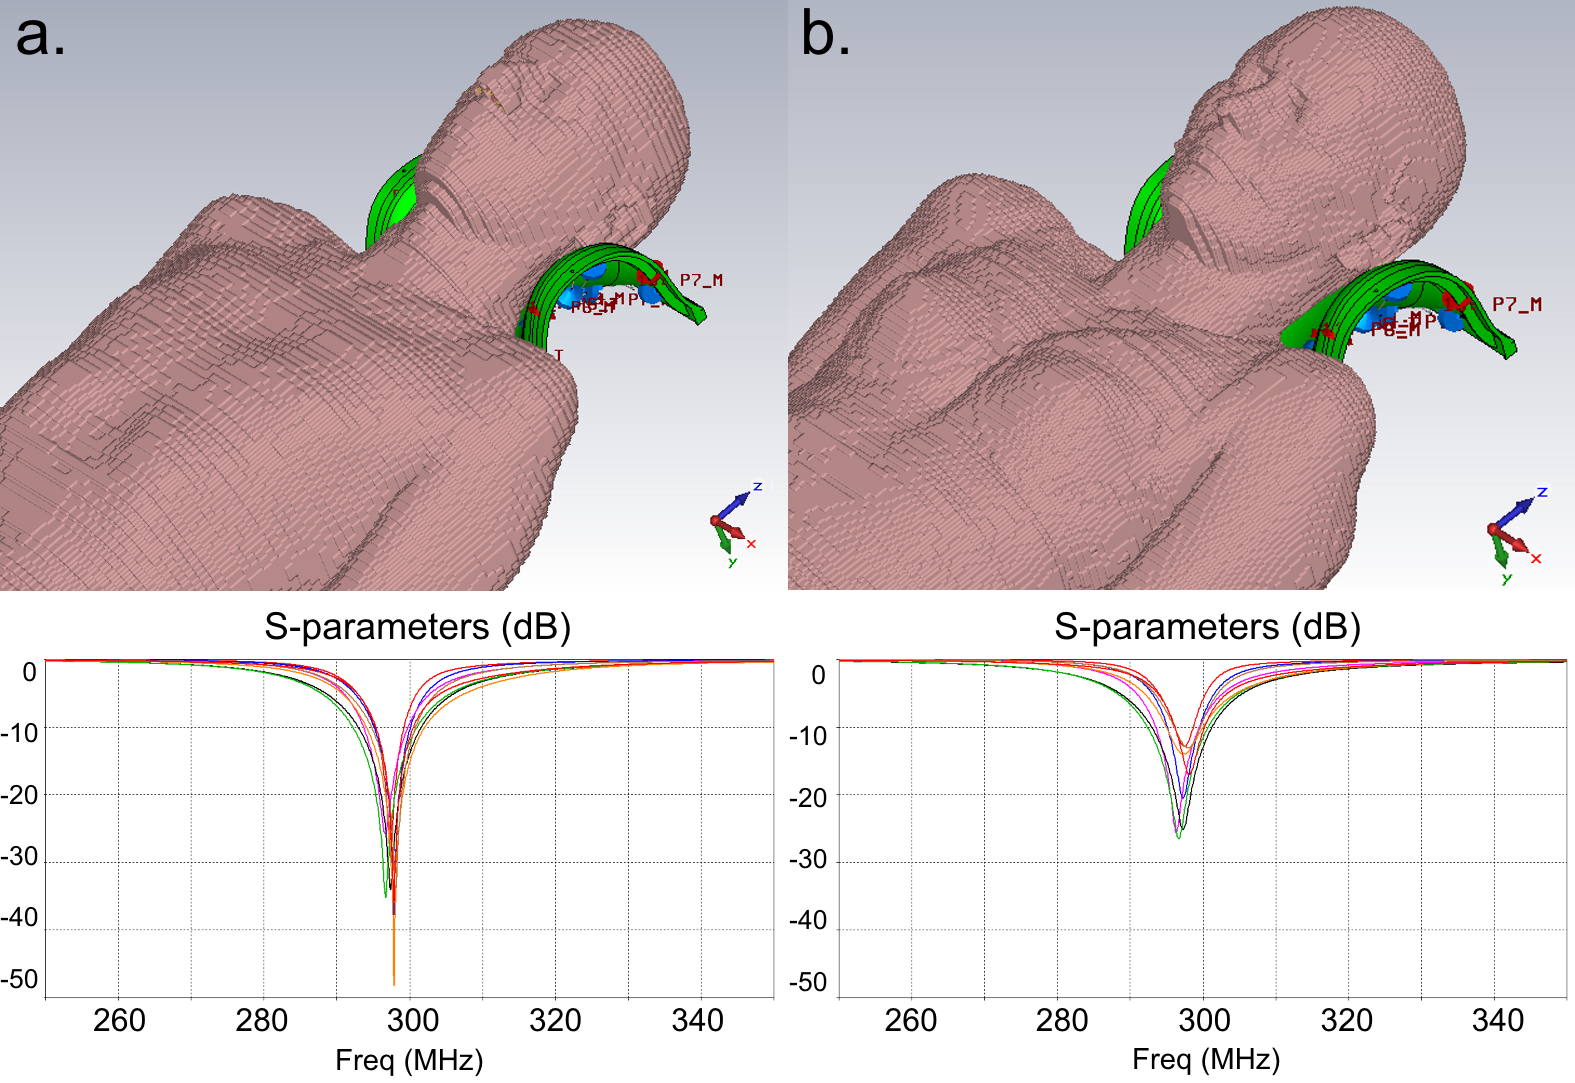
GHBMs: 2 models (Gustav, Laura) of the CST Voxel family.
Q-matrices generation: in-house routine.
VOP compression [4]: 10% maximum SAR overestimation.
MR phantom: SAM-V4.5BS (Speag, Zurich, Switzerland), head-shaped filled with gel with known EM and thermal properties [5].
B1+ mapping: with interferometric [6] magnetization-prepared TFL sequence [7]. Simulated B1+ fields are corrected through linear combinations to account for imperfect predictions of mutual coupling and losses [8] (calibration matrices obtained with least-squares minimization), and then compared to measured B1+ fields.
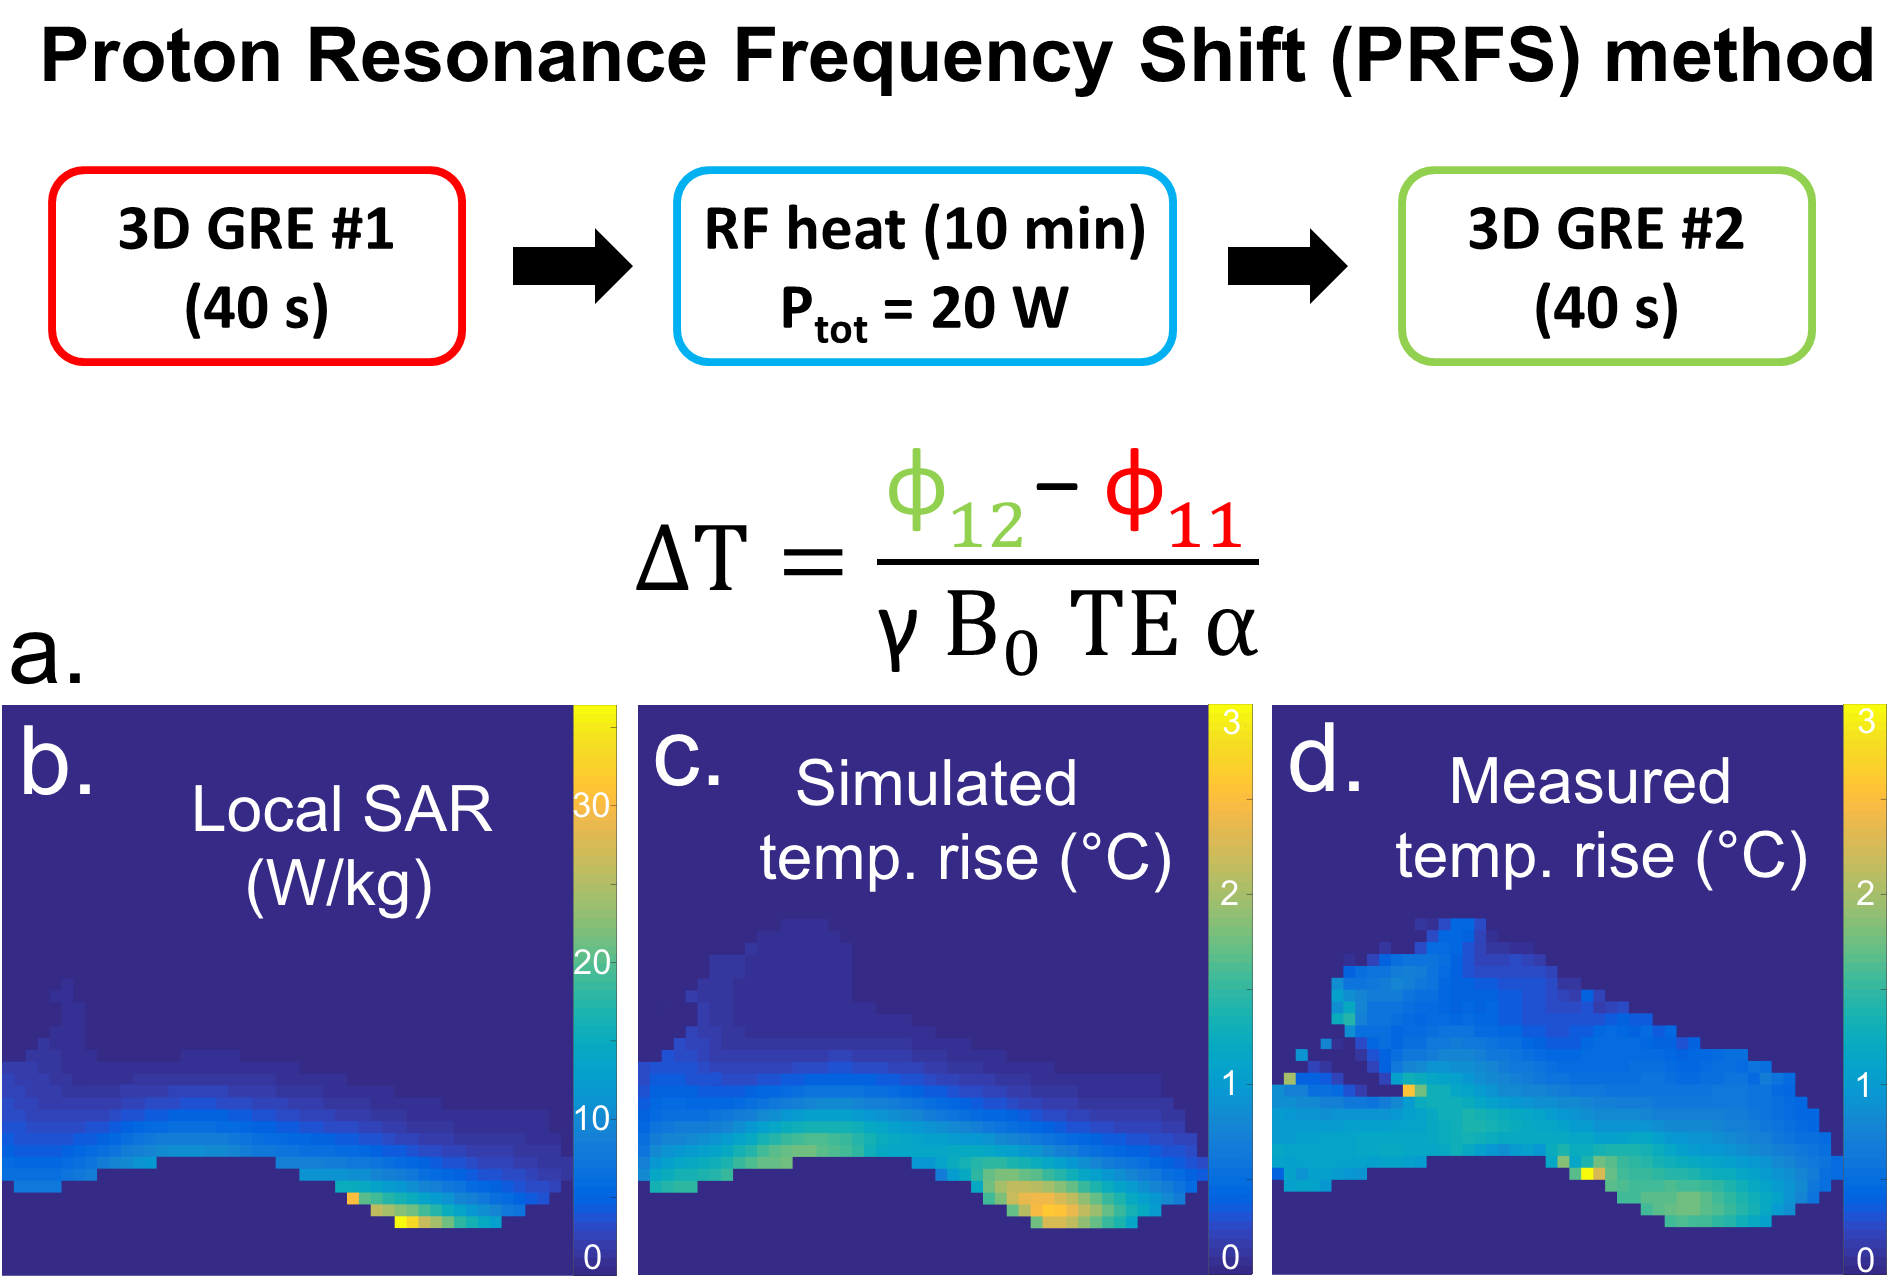
MR thermometry: with the Proton Resonance Frequency Shift method (PRFS) [9]. RF-induced heat generated with a RF-only sequence (duration: 10min, Ptot: 20W). Phase measurements with 3D GRE sequences. Thermal simulations: integration of the heat equation.
Results
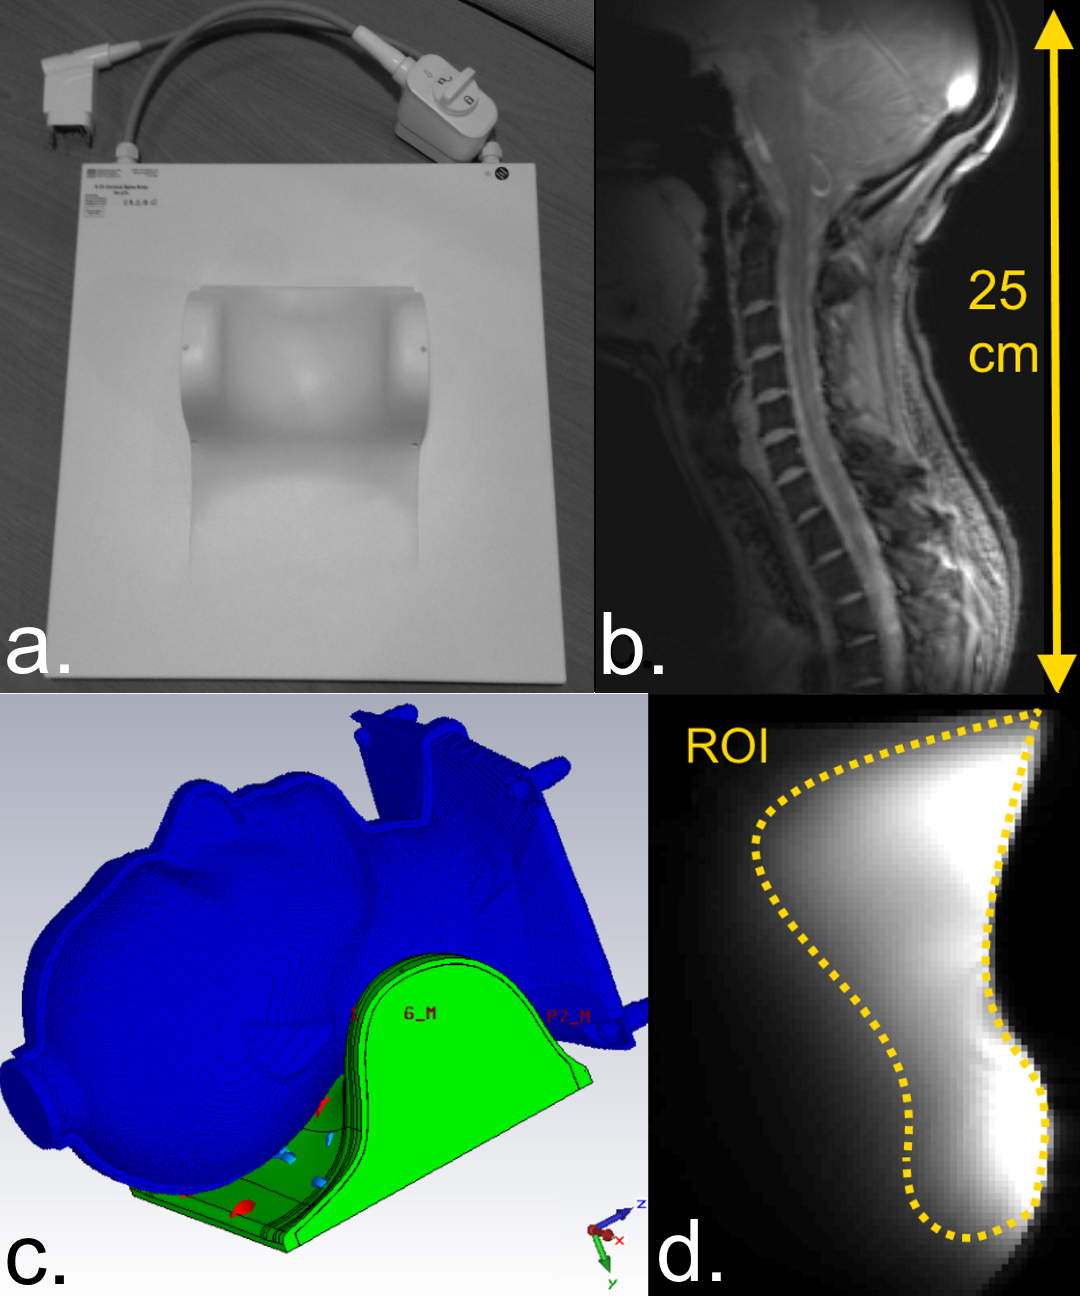
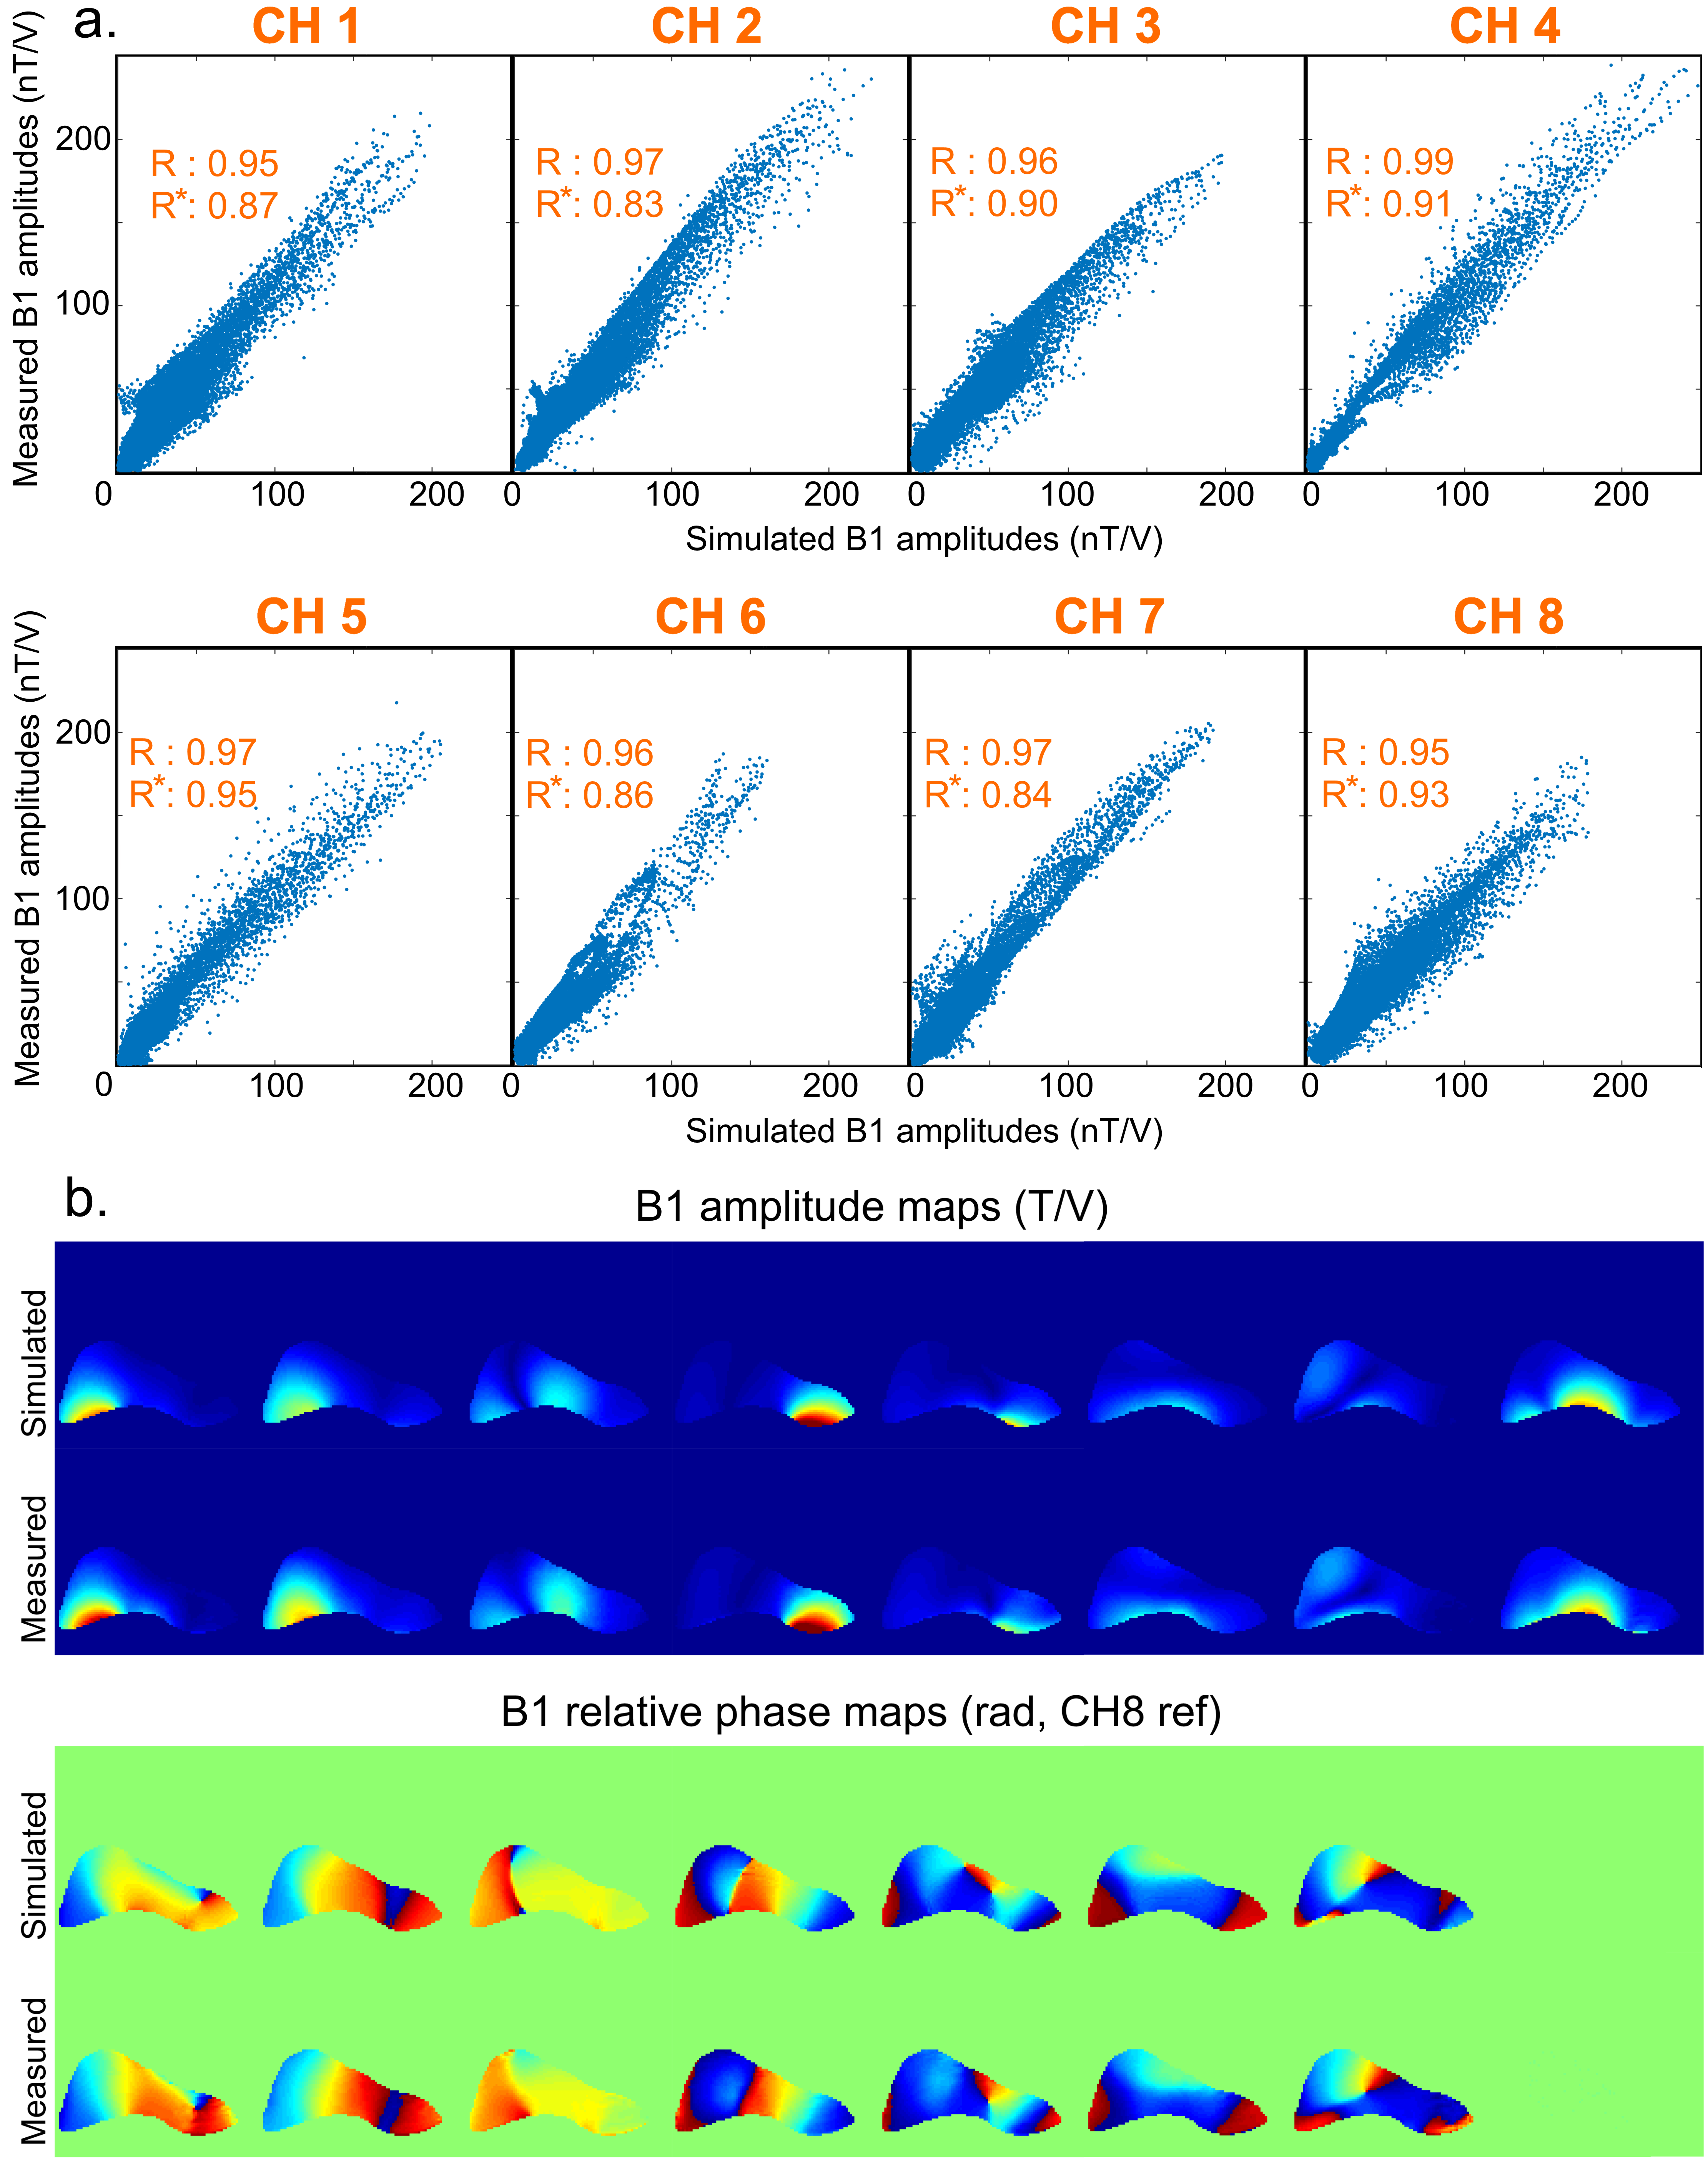
Fig1.a and Fig1.b show the coil and its spatial coverage in vivo (single-channel imaging). Fig1.c is a screenshot of the EM simulation and Fig1.d is the corresponding pTx sagittal scout on SAM. Fig2 shows the EM results on GHBMs Gustav and Laura with corresponding S-parameters. Resulting electric fields are used to compute VOP sets. Fig3.a depicts the scatter plots of individual B1+ field amplitudes for all channels coefficients after linear combinations correction, with corresponding correlations. A good agreement is observed between measured and simulated data, with an amplitude mean correlation of R~0.96 and a complex mean correlation of R*~0.89. Fig3.b exhibits central sagittal slices showing simulated and measured B1+ fields. Fig4.a presents the experimental setup for MR thermometry. Simulated SAR map (Fig4.b), simulated temperature rise map (Fig4.c) and measured temperature rise map (Fig4.d) are shown on the central sagittal slice. The temperature patterns look similar, but with a global underestimation of ~20% with the measurement, except in the anterior areas. As compared to B1+ mapping, MR thermometry agreement was expected lower due to approximations in simulation and measurements. The summarized workflow is presented in Fig5.Discussion
This work presents the first steps toward VOP-based pTx in vivo imaging of the SC at 7T in our group. The proposed validations are in line with the ones recommended in [10,11]. To ensure safe local SAR management, several safety margins have also to be considered: 1) Inter-subject variability influence on SAR, which was only studied for head coil [12,13], will require a dedicated study for SC. 2) EM simulation errors on B1+, which could be propagated using the methodology described in [14], are currently under integration in the process. 3) System measurement errors influence is already integrated during VOP compression [15]. The final derived safety factor is expected to encompass observed MR thermometry result differences.
Further steps include: 1) additional phantoms and B1+ mapping methods to verify the consistency of the B1+ correction and 2) more GHBMs simulation to create a ‘VOP database’ usable for any volunteers/patients. Future work should also include VOP consistency checking between online monitoring and offline prediction. Once enabled, parallel transmission will be a cutting-edge asset to tackle RF field inhomogeneity or to realize inner volume selection for cervical SC imaging at 7T.
Acknowledgements
Fundings: 7T-AMI ANR-11-EQPX-0001, A*MIDEX-EI-13-07-130115-08.38-7T-AMISTART & A*MIDEX ANR-11-IDEX-0001-02. The authors thank Olivier Girard, Robin Heidemann, Ulrich Fontius and Matthias Korn for support and valuable discussions.References
[1] Katscher et al., MRM 49, 2003. [2] Graesslin et al., MRM 68, 2012. [3] IEC Guidelines 60601-2-33-2, 2015. [4] Eichfelder and Gebhardt, MRM 66, 2011. [5] Alon et al., MRM 74, 2015. [6] Brunner and Pruessmann, MRM 61, 2009. [7] Fautz et al., ISMRM 2008, p 1247. [8] Beqiri et al., MRM 74, 2015. [9] Rieke and Pauly, JMRI 27, 2008. [10] Hoffmann et al., NMR Biomed 29, 2016. [11] Yetisir et al., ISMRM 2016, p 2211. [12] de Greef et al., MRM 69, 2013. [13] Le Garrec et al., MRM 2016. [14] Ferrand et al., ISMRM 2015, p 1862. [15] TX Array System Step 2.3 User Manual, Siemens Healthineers.Figures