0475
Non-invasive Assessment of Vascular Water Permeability in the Mouse Brain using multi-TE ASL1UCL Centre for Advanced Biomedical Imaging, Division of Medicine, University College London, London, United Kingdom, 2Leonard Wolfson Experimental Neurology Centre, UCL Institute of Neurology, London, United Kingdom
Synopsis
We apply a multi-TE ASL technique in the mouse brain, to separate intravascular and extravascular components of the ASL signal, as a non-invasive assessment of vascular permeability. Methodological development enabled the technique to reliably capture ASL signal compartmentation in the mouse brain, despite inherently low SNR. We report a significant decrease in intravascular fraction of the ASL signal from 0.66 (± 0.17) to 0.35 (± 0.10) as inflow time increases from 1000ms to 1500ms. This technique can be applied to transgenic mouse models of neurodegeneration, and a kinetic model can extract vascular permeability parameters from the ASL signal distribution.
Introduction
Previous studies have combined ASL with distinct contrast mechanisms during the image readout to separate the intravascular (IV) and extravascular (EV) components of the labelled blood water in brain tissue 1, 2, 3. The relative IV and EV contribution to the ASL signal is dependent on the permeability of the cerebral vessels to blood water 4, with greater EV contribution associated with increased blood water permeability. Multi-TE ASL measurements are entirely non-invasive, and therefore advantageous relative to more established methods of blood brain barrier (BBB) assessment such as DCE-MRI 5 and PET 6. Vascular water permeability has previously been assessed in the rat cortex by sampling the transverse decay of the ASL signal and fitting to a two-compartment bi-exponential model 7. This non-invasive technique, however, has yet to be applied to the mouse brain. It is challenging to implement such low SNR techniques in the mouse brain due to the markedly smaller size and associated susceptibility artefacts. But, given the extensive range of transgenic mouse models of pathology currently available, development of this methodology may be highly beneficial to the understanding BBB integrity in neurodegenerative disease.Methods
Images were acquired using an Agilent 9.4T imaging system with a two channel array surface coil (Rapid Biomedical). ASL data were acquired in female C57/B6 wild type (WT) mice at 18 weeks (n=6), using a flow-alternating inversion recovery (FAIR) sequence with a two shot segmented SE-EPI readout method. A multiple TE protocol was implemented at inflow times (TI) = 1000 ms and 1500 ms. Imaging parameters were: TE = 10, 12, 15, 18, 23, 30, 40, 50, 65 ms; FOV = 25 x 25 mm; matrix size = 32x32; TR = 5000 ms; repetitions = 20. Anaesthesia was induced at 2% isoflurane in a mixture of 1.0L/min medical air, and adjusted to maintain the respiration rate at ~100 bpm throughout the scans.
Analysis was performed in Matlab R2015a (Mathworks), with mean and standard error being reported across all subjects. The mean ASL signal intensity, ΔM, from a manually defined cortical region of interest, was extracted from the images at each TE. The data was evaluated using two models: a) a monoexponential model, $$$\triangle M= \exp(- \frac{TE}{T2^{app}})$$$ and b) a bi-exponential model, $$$\triangle M= \triangle M_{IV}\exp(- \frac{TE}{T2_{fast}}) + \triangle M_{EV}\exp(- \frac{TE}{T2_{control}})$$$, where T2app is apparent transverse decay, T2fast is the ‘fast-decaying’ compartment of the transverse decay that derives from the IV compartment and T2control is the transverse decay derived from the control signal (static tissue), ΔMIV is the intravascular component and ΔMEV is the extravascular component of the ASL signal. As such, for the bi-exponential model, all four fitted parameters are estimated from the acquired data 7.
Results
The mean apparent transverse relaxation, T2app, measured by the monoexponential model, increases from 25.5 (± 1.4 ms at TI = 1000 ms) to 29.9 (± 1.7 ms at TI = 1500 ms) (p = 0.0023), reflecting the shift of labelled water from the IV to EV space at longer TI. The T2app values shows a decrease compared to measurements in the rat cortex 7, which may reflect subtle physiological differences of the mouse brain.
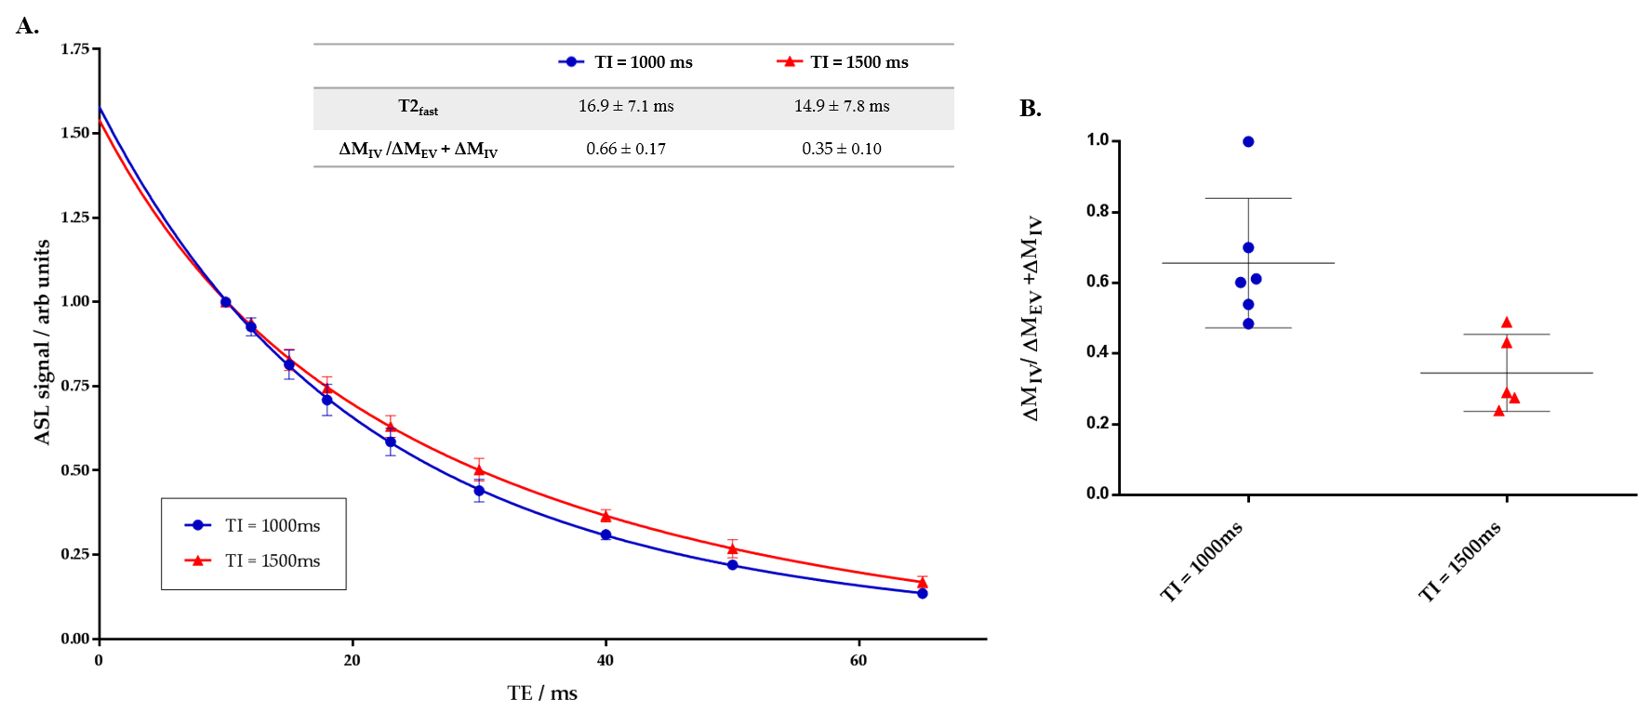
Figure 1A shows that the transverse decay of the ASL signal in the mouse brain is well described by the bi-exponential model and provides evidence to support the feasibility of this approach to extract the intravascular, ΔMIV, and extravascular, ΔMEV, contributions to the ASL signal. Methodological improvements for the mouse brain include a larger range of TEs, to more reliably capture the fast decaying component of the bi-exponential model. Figure 1B shows that there is a reduction in the intravascular fraction of the ASL signal, from 0.66 ± 0.17 to 0.35 ± 0.10 as the TI increases from 1000 to 1500 ms (p = 0.0087). This reflects the gradual exchange of the labelled blood water into the tissue, giving a surrogate index of vascular permeability. The IV and EV signal contributions will be used to extract the tissue transit time using the kinetic model 8, to evaluate the permeability further. Figure 1B suggests that the technique is able to estimate the compartmental distribution of the ASL signal with good between-subject reproducibility and thus may provide a sensitive non-invasive biomarker of BBB pathology.
Conclusion
We have developed an imaging protocol to measure the IV-EV components of labelled blood water in the mouse brain, where low SNR techniques often find inherently challenging. This technique may be applied to transgenic mouse models of neurodegeneration to assess vascular permeability in neurodegenerative disease.Acknowledgements
This work is supported by the Medical Research Council (MR/K501268/1) and the EPSRC-funded UCL Centre for Doctoral Training in Medical Imaging (EP/L016478/1) .References
[1] Silva AC, Williams DS, Korestsky AP. Evidence for the Exchange of Arterial Spin-Labelled Water with Tissue Water in Rat Brain from Diffusion-Sensitized Measurements of Perfusion. Mag. Res. Med. 1997; 38: 232-237. [2] Kim T and Kim SG. Quantification of cerebral arterial blood volume using arterial spin labeling with intravoxel incoherent motion-sensitive gradients. Magn Reson Med 2006; 55: 1047–1057 [3] Duong TQ and Kim SG. In vivo MR measurements of regional arterial and venous blood volume fractions in intact rat brain. Magn Reson Med 2000; 43: 393–402. [4] Parkes LM. Quantification of Cerebral Perfusion Using Arterial Spin Labeling: two-Compartment Models. J. Mag. Reson. Imaging. 2005; 22: 732-736. [5] Tofts PS, Kermode AG. Measurement of the Blood-Brain Barrier Permeability and Leakage Space using Dynamic MR Imaging. 1. Fundamental Concepts. Mag. Res. Med. 1991; 17: 357-367 [6] Schlageter NL, Carson RE, Rapoport SL. Examination of Blood-Brain Barrier Permeability in Dementia of the Alzheimer Type with [68Ga]EDTA and PET. J. Cereb. Blood Flow Metab. 1987; 7: 1-8 [7] Wells J, Lythgoe MF, Thomas DL, et al. Measuring biexpoential transverse relaxation of the ASL signal at 9.4T to estimate arterial oxygen saturation and the time of exchange of labelled blood water into cortical brain tissue. J. Cereb. Blood Flow Metab. 2013; 33: 215-224. [8] Buxton RB, Frank LR, Edelman RR, et al. The General Kinetic Model for Quantitative Perfusion Imaging with Arterial Spin Labeling. Mag. Res. Med. 1998; 40: 383-396.Figures