0474
Towards a non-contrast assessment of blood-brain-barrier permeability1Department of Biomedical Engineering, Johns Hopkins University, Baltimore, MD, United States, 2The Russell H. Morgan Department of Radiology and Radiological Science, Johns Hopkins University, Baltimore, MD, United States, 3C.J. Gorter Center for high field MRI, Radiology, Leiden University Medical Center, Leiden, Netherlands
Synopsis
Blood-brain-barrier (BBB) permeability has been shown to be disrupted in many diseases. Current study proposes a non-invasive method to measure the extraction fraction and BBB permeability of water. Studies were performed to provide proof-of-principle and a new sequence was developed to improve efficiency. These methods provided consistent results with previous literature. CO2 effect on permeability was explored and increased measurement sensitivity was demonstrated.
Purpose
Subtle disruption of blood-brain-barrier (BBB) is implicated in many diseases, such as Alzheimer’s disease, multiple sclerosis, and amyotrophic lateral sclerosis. Current methodology to measure BBB permeability requires gadolinium contrast agent as well as lengthy scan duration (to allow time for sufficient number of Gd molecules to leak out). A non-contrast method would be desirable1,2. The present study aims to quantify BBB permeability, using water as a tracer, through detection of arterially labeled blood spin leaving the cerebral microvasculature on the venous side. Indeed, although it is traditionally assumed that all arterial spins are exchanged to tissue, this is the first study to show definitively that a small fraction of arterial spins do get drained into the vein and that these can be detected. A series of three studies were performed to provide proof-of-principle, to validate a newly developed sequence to improve efficiency, and measure response to a CO2 challenge.Theory
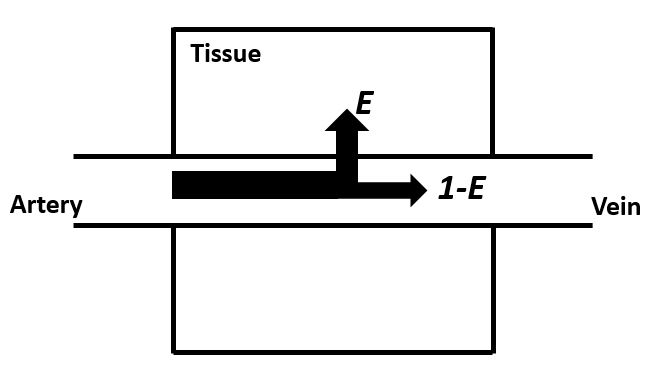
BBB-permeability can be represented as permeability-surface-area-product (PS): $$$PS=-ln(1-E)·f$$$, where E is the extraction fraction of water, and f is cerebral blood flow (CBF)3. f is relatively easy to measure. For E, we reason that water molecules labeled arterially will be partially extracted to tissue, whereas non-extracted spins will be drained into the venous system (Fig. 1). In this study, we will focus on a large vein: the superior sagittal sinus (SSS). By labeling incoming arterial water by pCASL and measure the signal at SSS, we will be able to assess E and thereby PS. Assuming little dispersion, the pCASL signal at SSS can be written as:
$$\triangle M=\begin{cases}0 & t < \delta\\2\alpha(1-E)M_{0}exp(-\delta/T_{1,blood}) & \delta < t < \delta+\tau\\0 & t > \delta+\tau\end{cases}$$
where δ is bolus arrival time (BAT), α is labeling efficiency and τ is labeling duration.
Materials and Methods
All subjects provided informed consent and the study was approved by the local IRB.
Study One – Proof-of-principle with conventional multi-delay pCASL sequence
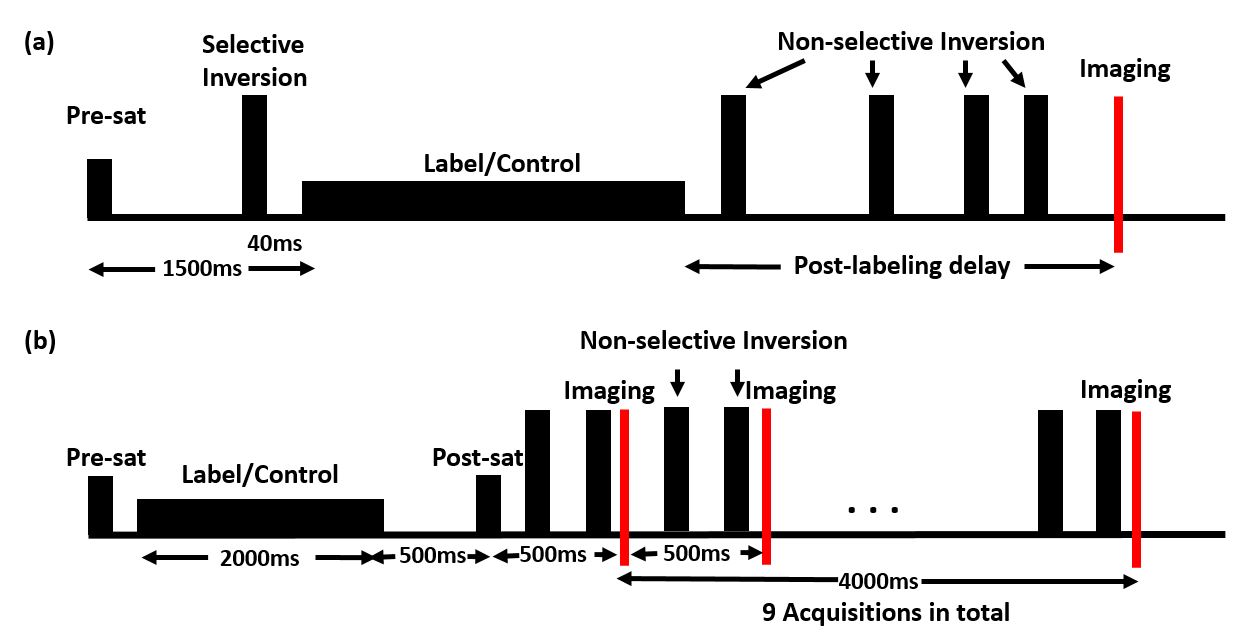
A Philips 3T was used. A conventional pCASL sequence with six (long) post-labeling delays (PLD=2000, 2500, 3000, 3500, 4000, 4500 ms) was used (labeling duration=2s) (Fig. 2a). Images were acquired at mid-sagittal plane (N=6, Male/Female: 3/3, Age: 27±6.4 yrs; single slice, voxel size = 3.13*3.13 mm2). ASL-signal at SSS was fitted to the model above. Scan time=40m42s.
Study Two – Improving efficiency by using a background-suppressed multi-acquisition pCASL sequence
We devised a new sequence that is similar to Look-Locker but has optimal background suppression for all readouts (Fig. 2b). This allows nine PLD acquisitions in one TR (N=6, Male/Female: 2/4, Age: 25±5.7 yrs; flip angle = 90°, single, coronal slice, voxel size = 2.34*2.34 mm2). Scan time=3m55s.
Study Three – Enhancing sensitivity by CO2 inhalation
We examined the effect of hypercapnia on ΔM. We reasoned that 1) CO2 reduces BAT; 2) CO2 increases CBF which should increase (1-E), both of which should augment the targeted signal ΔM. Both Study 1 and Study 2 sequences were performed under room-air and CO2 inhalation periods (N=5, Male/Female: 1/4, Age: 21±3.8 yrs).
Results and Discussion
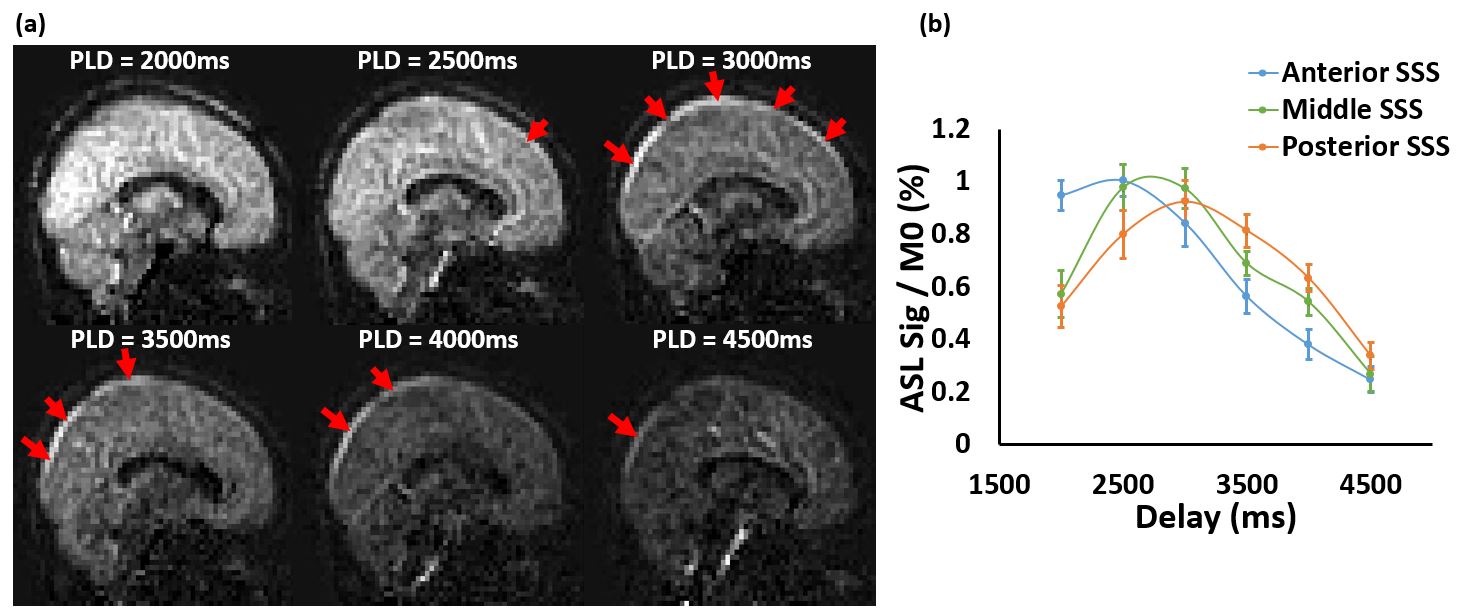
Study 1: Representative sagittal ASL-images acquired with conventional multi-delay pCASL method are shown in Fig. 3a. Venous ASL-signal can be seen at SSS starting at PLD=2500ms, reaching a peak around PLD=3000-3500ms and decaying afterwards. Quantitative analysis of SSS-signal in Fig. 3b indicates that, from anterior to posterior SSS, the BAT increases and that the peak signal decreases due to T1-related decay of label. Average E was 96.5±1.7% (N=6). Assuming CBF of 57ml/100g/min, this corresponds to PS=191.3±26.5ml/100g/min.
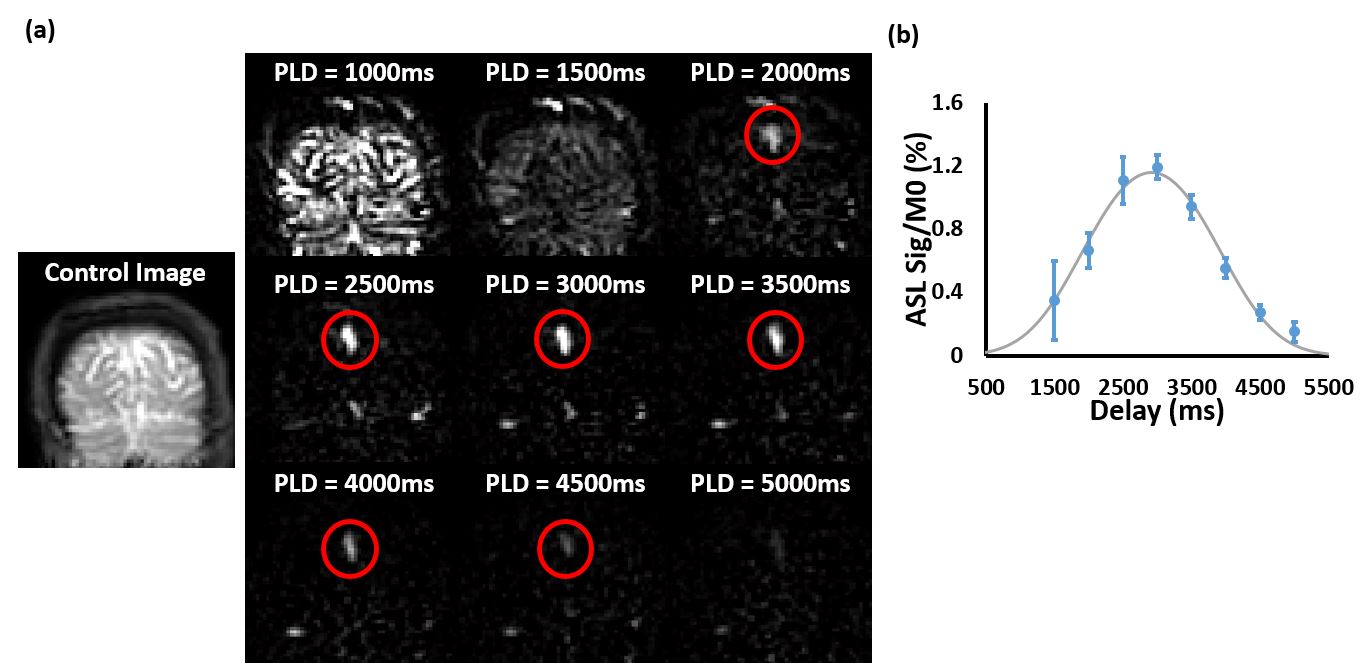
In study 2, coronal images were acquired with background-suppressed multi-acquisition pCASL (Fig. 4a). It can be seen that data from short PLDs contained substantial tissue perfusion, which contaminated venous ASL-signal. Thus, only data from PLD=1500ms and above were used in the fitting analysis (Fig. 4b). Average E was 97.3±2.1%. Assuming CBF=57ml/100g/min, this corresponds to PS=218.7±46.0ml/100g/min. The E and PS results measured from Study 1 and Study 2 were not significantly different (p=0.38), and are in general agreement with literature values from PET 4,5.
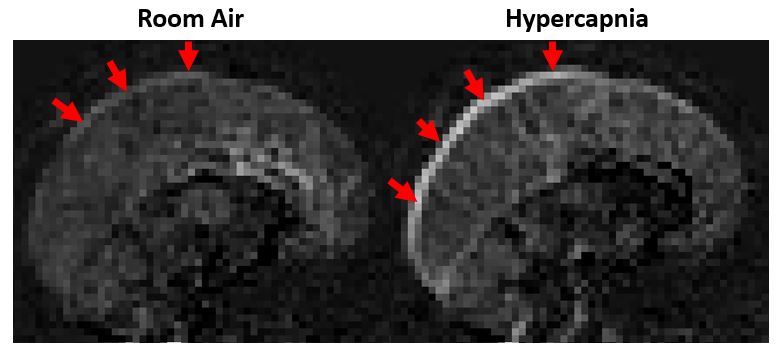
As shown in Fig. 5, CO2 inhalation induced an increase in the SSS-signal compared to room air, and the labeled spins arrived earlier. Quantitative analysis showed an increase in CBF and decrease in E (Table 1). Paired t-test showed significant differences in CBF and E (p=0.005 and 0.03), but not a significant change in PS (p>0.05).
Conclusion
In this study, we developed a novel method for non-contrast agent assessment of BBB permeability of water, by measuring ASL-signal in the venous vessels. CO2 effect on this method was also examined, which showed a decrease in extraction fraction of water, thereby enhancing the overall sensitivity.Acknowledgements
No acknowledgement found.References
1. Gregori, J., Schuff, N., Kern, R. and Günther, M., T2-based arterial spin labeling measurements of blood to tissue water transfer in human brain. J. Magn. Reson. Imaging. 2013; 37: 332–342.
2. St. Lawrence, K. S., Owen, D. and Wang, D. J. J., A two-stage approach for measuring vascular water exchange and arterial transit time by diffusion-weighted perfusion MRI. Magn. Reson. Med. 2012; 67: 1275–1284.
3. Crone, C., The permeability of capillaries in various organs as determined by use of the ‘indicator diffusion’ method. Acta Physiologica Scandinavica. 1963; 58: 292–305.
4. Herscovitch, P., Raichle, M.E., Kilbourn, M.R. and Welch, M.J., Positron emission tomographic measurement of cerebral blood flow and permeability—surface area product of water using [15O]water and [11C]butanol. J Cereb Blood Flow Metab. 1987; 7: 527-542.
5. Paulson, O.B., Hertz, M.M., Bolwig, T.G. and Lassen, N.A., Filtration and diffusion of water across the blood-brain barrier in man. Microvasc Res. 1977; 13(1): 113-123.
Figures